Abstract
Chemical plants must handle a wide variety of hazardous substances. To ensure safety in such plants, it is necessary to conduct extensive and highly accurate risk assessments. In this study, we aimed at developing a method that enables flexible and accurate risk assessment. We combined two different simulation tools to reproduce the phenomena of toxic gas leakage and diffusion as well as its impact on human health. The atmospheric diffusion after the leakage of toxic gas was simulated by computational fluid dynamics (CFD). Assuming the movement line of the person, toxic gas absorption and subsequent metabolism were calculated by a physiologically based pharmacokinetic (PBPK) model. From this, changes in blood concentration of toxic substances with time were simulated and we evaluated the effects of toxic gases on human body. Ethanol was selected as a toxic gas in this study. Based on the assumed scenario, the diffusion of leaked ethanol gas was calculated by CFD leading to the confirmation that the concentration of ethanol gas varies significantly with wind speed, human position, and elapsed time. The PBPK model showed that the maximum blood concentration of ethanol was 161 µmol/L, which is sufficiently low compared to that of ethanol poisoning (i.e., 10,900 µmol/L). These results suggest that the effects on the human body are relatively low and the evacuation can be performed safely. Compared to conventional methods of risk assessment, our new method allows the risk assessment of multiple scenarios, namely interindividual differences, activity status and the used of protective equipment.
INTRODUCTION
In recent years, the need for chemical substance management at chemical product manufacturing plants has increased due to a number of large-scale accidents and natural disasters at chemical plants (Bos et al., 2010; Department for Business Innovation & Skills UK, 2013; Wood et al., 2006; Kefalas et al., 2006; Liu et al., 2018). The Environmental Protection Agency (EPA) of the United States and the Health and Safety Executive (HSE) of the United Kingdom have issued guidelines for the risk assessment of chemical plants (U.S. Environmental Protection Agency, 1987; Bacon et al., 1999), which have been adopted in many countries. From the perspective of risk assessment, in the event of accidental or disaster-related leakage, the hazard potential of acute toxicity must be assessed and appropriate measures must be taken both regarding hardware (e.g., safety design, and warning equipment) and software (e.g., development of safety evacuation scenario).
The risk assessment of chemical plants is currently conducted in the following two steps: 1) estimation of time-dependent changes in the concentration distribution due to leakage and diffusion of toxic substances based on the assumed scenario of a leakage accident. The concentration distribution is estimated using a gas diffusion model based on chemical engineering models or computational fluid dynamics (CFD) that numerically solves the Navier-Stokes equation in a three-dimensional (3D) space (He et al., 2017; Gousseau et al., 2011; Lea et al., 2002; Mizuta et al., 2020; Qi et al., 2010; Nagaosa, 2014; I et al., 2008); 2) assessment of effects on human health conducted using the acceptable guideline concentrations for acute toxicity in the management of chemical substances in most cases. Currently, five guidelines have been established in the United States (Acute Exposure Guideline Levels, AEGLs; Emergency Response Planning Guidelines, ERPGs; Temporary Emergency Exposure Limits, TEELs; Protective Action Criteria, PAC; and Immediately Dangerous to Life and Health Limits, IDLHs) and one guideline has been established in Europe (European Acute Exposure Threshold Levels, AETLs). Therefore, different countries, regions, and competent authorities have developed different procedures with different targets and objectives, making it difficult to choose an ideal model to conduct risk assessment at an actual site (Bos et al., 2010). For instance, previous evidence pointed out that, when establishing the AETLs in Europe, the existing IDLHs may result in excessive risk assessment depending on its application, and as a countermeasure, the AETLs were established as an independent procedure (Wood et al., 2006). In parallel, in Japan, the Great East Japan Earthquake in March 2011 triggered a review of the guidelines for disaster prevention assessment of petroleum complexes. The use of IDLHs or AEGLs is currently recommended as the threshold concentration of chemicals for risk assessment of toxic chemical spill (Office of Special Disasters, Fire and Disaster Management Agency, Japan, 2013).
When risk assessment is performed assuming an actual leakage accident, the hazard changes depending on which of the multiple specified threshold values as described above, and the necessary countermeasures often change significantly. Accordingly, risk assessment is forced to take a margin on the safety side, and likely overestimates the hazard effects, resulting in a need for high-cost countermeasures. As mandatory risk evaluations and countermeasure planning are becoming trendy in business activities, it is necessary to develop a more accurate method for risk assessment to achieve both safety and economic efficiency.
By combining two existing tools, this study proposes a new risk assessment method that estimates changes in blood concentrations of hazardous substances based on their exposure concentrations and assesses their effects on the human body from blood concentrations. In this study, the concentration distribution due to diffusion during a toxic substance leak is first calculated by CFD. The hazard of the calculated exposure concentration is not evaluated using a threshold concentration as in the conventional method, but a new risk assessment method is proposed in which the exposure concentration is input to a PBPK model and the calculated blood concentration is used to evaluate the effect on human health. The PBPK model allows risk assessment that takes into account individual differences, activity status and other metabolic factors. Furthermore, by combining the two tools, CFD and the PBPK model, it is expected to be possible to evaluate various scenarios, such as leakage conditions, weather, and human movement, to formulate effective countermeasures and to plan safely and economically without excess or deficiency. As CFD software, we used the commercial CFD software “R-FLOW” (R-FLOW Corporation, Saitama, Japan), which has functions to analyze toxic gas diffusion in the atmosphere in detail and to create 3D geometries of analysis targets based on scenarios in an easy-to-operate manner. “R-FLOW” has been used in many academic studies in the fields of chemical engineering and mechanical engineering (Komoda et al., 2001; Senda et al., 2014; Hirata et al., 2014; Nakayama et al., 2016, 2018). For the PBPK model, we used “IndusChemFate” (http://cefic-lri.org/toolbox/induschemfate), which has the capability to simultaneously consider inhalation and transdermal absorption as absorption routes. Fragki et al. (2022) evaluated the applicability of “IndusChemFate” in chemical hazard assessment and illustrated that IndusChemFate can be a useful first-tier for simulating toxicokinetics. Pletz et al. (2020) evaluated the performance of eight PBPK models, including “IndusChemFate,” and “IndusChemFate” was selected as one of the two most highly rated models. Accuracy validation of “IndusChemFate” was performed by Jongeneelen and Berge (2011) and Huizer et al. (2012, 2014), and good agreement with experimental results was confirmed. Huizer et al. (2012, 2014) point out the importance of highly accurate metabolic rate parameters to ensure the accuracy of the analysis. Currently available metabolic rate parameters for toxicants for PBPK models are limited and are expected to be enhanced in the future. In this study, ethanol, whose analytical accuracy has already been confirmed by Jongeneelen and Berge (2011), was selected as a model substance to confirm the operation of the developed method. We used the same input parameters for the PBPK model for ethanol, including metabolic parameters, as in the study by Jongeneelen et al.
MATERIALS AND METHODS
Overview of analysis methods
Taking the quantitative impact assessment of toxic gas leaked from a tank on workers in the nearby area as an example, the analytical method used in this study to couple CFD and PBPK model is shown in the flow diagram in Fig. 1.
In CFD, the diffusion of toxic gases leaked from the tank to the surroundings under the influence of wind was analyzed to calculate time-dependent changes of the concentration of toxic gases in the air at the position of the worker. This data was input as inhaled gas composition data in the PBPK model, and changes with time in the blood concentration of toxic substances due to metabolism and other organic factors are calculated to evaluate the impact on human health. The analysis methods for CFD and PBPK model are described below.
Method for CFD analysis using R-flow
To estimate the concentration distribution of ethanol gas leaked from a tank, the detailed diffusion of the toxic gas from the initial stage of leakage to the surrounding area with time was simulated using “R-FLOW”, a commercially available CFD software. Successively, changes in concentration distribution can be estimated by solving for the diffusion of toxic gases in the flow field. The continuity equation (i.e., conservation of mass) and the Navier-Stokes equation (i.e., conservation of momentum) are used in R-FLOW for gas flow and are solved by discretizing them using the finite volume method with respect to space and time. To calculate the diffusion of toxic gases, three factors must be considered in CFD. The three factors are advection diffusion, turbulent diffusion and molecular diffusion. Advection diffusion, whereby toxic gases are carried by wind, can be analyzed using information on the gas flow field. Turbulent diffusion, whereby toxic gases are diluted by the turbulence in the flow field. In this study we used the Standard k-ε (SKE) model, one of the most common Reynolds-averaged Navier-Stokes (RANS) as a turbulence model. Molecular diffusion can be calculated using the diffusion equation based on the concentration gradient and diffusion coefficient of ethanol gas.
As the input data for the CFD simulation, the following four types of data are required. Geometry data: The 3D geometry of the analysis area, defined as the area of ethanol gas leakage and the surrounding space, and the 3D geometry data including tanks, buildings, and other structures within the area were created using 3D CAD (Computer Aided Design). The 3D shape model used in this analysis is depicted in Fig. 2. Wind velocity condition: when considering wind outside or air conditioning blowout inside a room, the velocity or flow rate that flows into the analysis area was entered as a boundary condition (see wind speed arrow in Fig. 2). The velocity distribution and outflow of the airflow within the area are calculated as a result of the simulation. Toxic gas leakage conditions: the leakage location, volume, and velocity of the outflow were entered as the assumed ethanol leakage scenario. Physical property data: density, viscosity, and diffusion coefficient of air and toxic gases were input for this analysis. As part of the CFD procedure, the analysis of the air flow in the analysis area is necessary in advance using only air in CFD before conducting the analysis after the toxic gas leakage. The toxic gas leakage was started into the analyzed air flow field, and the situation where the toxic gas diffuses immediately after the leakage was simulated. Numerical values of wind speed, wind direction, and concentration of toxic gases at all positions and time points can be outputs in the CFD. Results can also be presented as 3D graphics to visualize the diffusion of toxic gases.

The conjunction of results derived from fluid analysis as input values for PBPK modelling is as follows: based on a scenario such as human movement, the concentration of toxic gas at a specific position and time within the analysis area is output as a time series data from the fluid analysis results. This data can be used as input data for exposure concentrations in the pharmacokinetic analysis described below to integrate both analyses. As the current version of PBPK model “IndusChemFate” does not support the time variation of exposure concentrations, we used the time average value in this study.
In the present study, the PBPK model was used to simulate changes in blood concentration of inhaled ethanol gas over time resulting from its absorption into the body, metabolism in various organs, and excretion. In recent years, the PBPK model has been increasingly used in many countries for pharmaceutical research and drug approval applications due to its applicability. For example, in Europe, the “Guideline on the reporting of PBPK modelling and simulation (draft)” was published in July 2016, and is continually being updated, providing guidelines for PBPK models that can be used in regulatory submissions (European Medicines Agency, 2018). In the United States, “PBPK Analyses-Format and Content Guidance for Industry (draft)” was also released in December 2016 and is being updated in the same manner. In the field of human biomonitoring (HBM), which is becoming increasingly important for the risk assessment of chemical substances, the PBPK model is an indispensable tool for analyzing the correlation between exposure concentrations and concentrations in bodily fluids (e.g., blood and urine). Therefore, the need for a highly accurate and practical model is ever increasing.
The PBPK models constitute publicly available license-free software as well as commercial software. Pletz et al. evaluated eight publicly available PBPK models based on the following criteria: easy to use, readily available, full documentation and manual of use, transparent and simple, and easy to manipulate in case minor amendments were needed (Pletz et al., 2020). In this study, we used “IndusChemFate”, a model evaluated favorably by Pletz et al., which allows the input of inhalation exposure. The PBPK model software can quantitatively and dynamically estimate the movement of chemical substances in the body by creating a mathematical model consisting of differential equations of the metabolism of chemical substances absorbed in the body and their circulation through blood flow, connecting each organ with a blood vessel. Figure 3 shows the eleven organs, blood flow, and absorption/excretion pathways considered in “IndusChemFate”. Absorption comprises the inhalation from the respiratory system, oral intake, and transdermal absorption. The blood/gas partition coefficient for inhalation from the respiratory system and the octanol/water partition coefficient for transdermal absorption are estimated by quantitative structure-activity relationships. Dermal uptake is estimated by the use of a dermal diffusion-based module that considers dermal deposition rate and duration of deposition. Modeling is performed considering transport by the bloodstream. Multiple absorption routes, such as inhalation and transdermal absorption concurrently, were considered for the current simulation. Herein, the analysis function was used to calculate the inhalation and transdermal absorption of ethanol gas. As shown in Fig. 3, “IndusChemFate” can consider the intestinal tract, lungs, kidney, etc. as candidate organs for metabolism analysis. In this study, only liver metabolism was considered for calculation. Metabolism within organs is calculated using the Michaelis-Menten equation (i.e., Vmax and Km data) and can be modeled up to the 4th order metabolism, but only one enzyme system per organ can be considered simultaneously. By varying blood flow, size of each organ (e.g., blood residence time), and enzyme reaction rate parameters, one can consider the different age, race and gender. Table 1 shows the ethanol physicochemical property and metabolism data built into “IndusChemFate” (version 2.0) used in this study. “IndusChemFate” can estimate the blood concentrations of the parent compound and its metabolites as well as the concentrations in 11 organs, in urine and breath. In this study, only the blood concentration of ethanol was used for risk assessment.

Table 1. List of physical properties and pharmacokinetic parameters for ethanol and its metabolites registered in the “IndusChemFate” built-in database.

RESULTS
To confirm the application of the methodology developed in this study, an evaluation of the impact on the human body was conducted assuming the gaseous ethanol jet from a tank as a toxic gas (Fig. 4). A 100 m wide x 100 m long x 75 m high cubic area, including the ethanol tank and the surrounding buildings, was set as the target of analysis, and a 3D geometry was created for CFD. A crack appeared in the side wall of the gas phase section above the liquid level of a tank storing liquid ethanol. It was assumed that air containing ethanol at a saturated concentration (8.5%) at room temperature continuously leaked through the crack at a flow rate of 0.234 m3 /sec. The location of the crack was assumed to be 3.7 m above the ground level of the cylindrical tank as shown in Fig. 4. No leakage of liquid ethanol was assumed in this study. Assuming outdoor leakage, the analysis was conducted at normal temperature and pressure (Temperature: 20C, Pressure 1013 hPa). Wind velocity, which has a significant impact on the diffusion of leaked gas, was set at 0.1 and 0.5 m/sec to evaluate changes in the distribution of the leaked gas concentration and its impact on workers. Two locations (i.e., locations A and B) were considered (see Fig. 5) and changes in the concentration of ethanol gas at these locations were monitored. The physical property data for air and ethanol used in CFD are shown in Table 2.

Table 2. Physical properties of gases used in the analysis.
|
Density |
Viscosity |
Diffusion coefficient |
| Kg/m3 |
Pa·sec |
m2/sec |
| Air |
1.205 |
1.80E-05 |
1.15E-05 |
| Ethanol |
1.916 |
- |
(Temperature:20C, Pressure 1013 hPa)
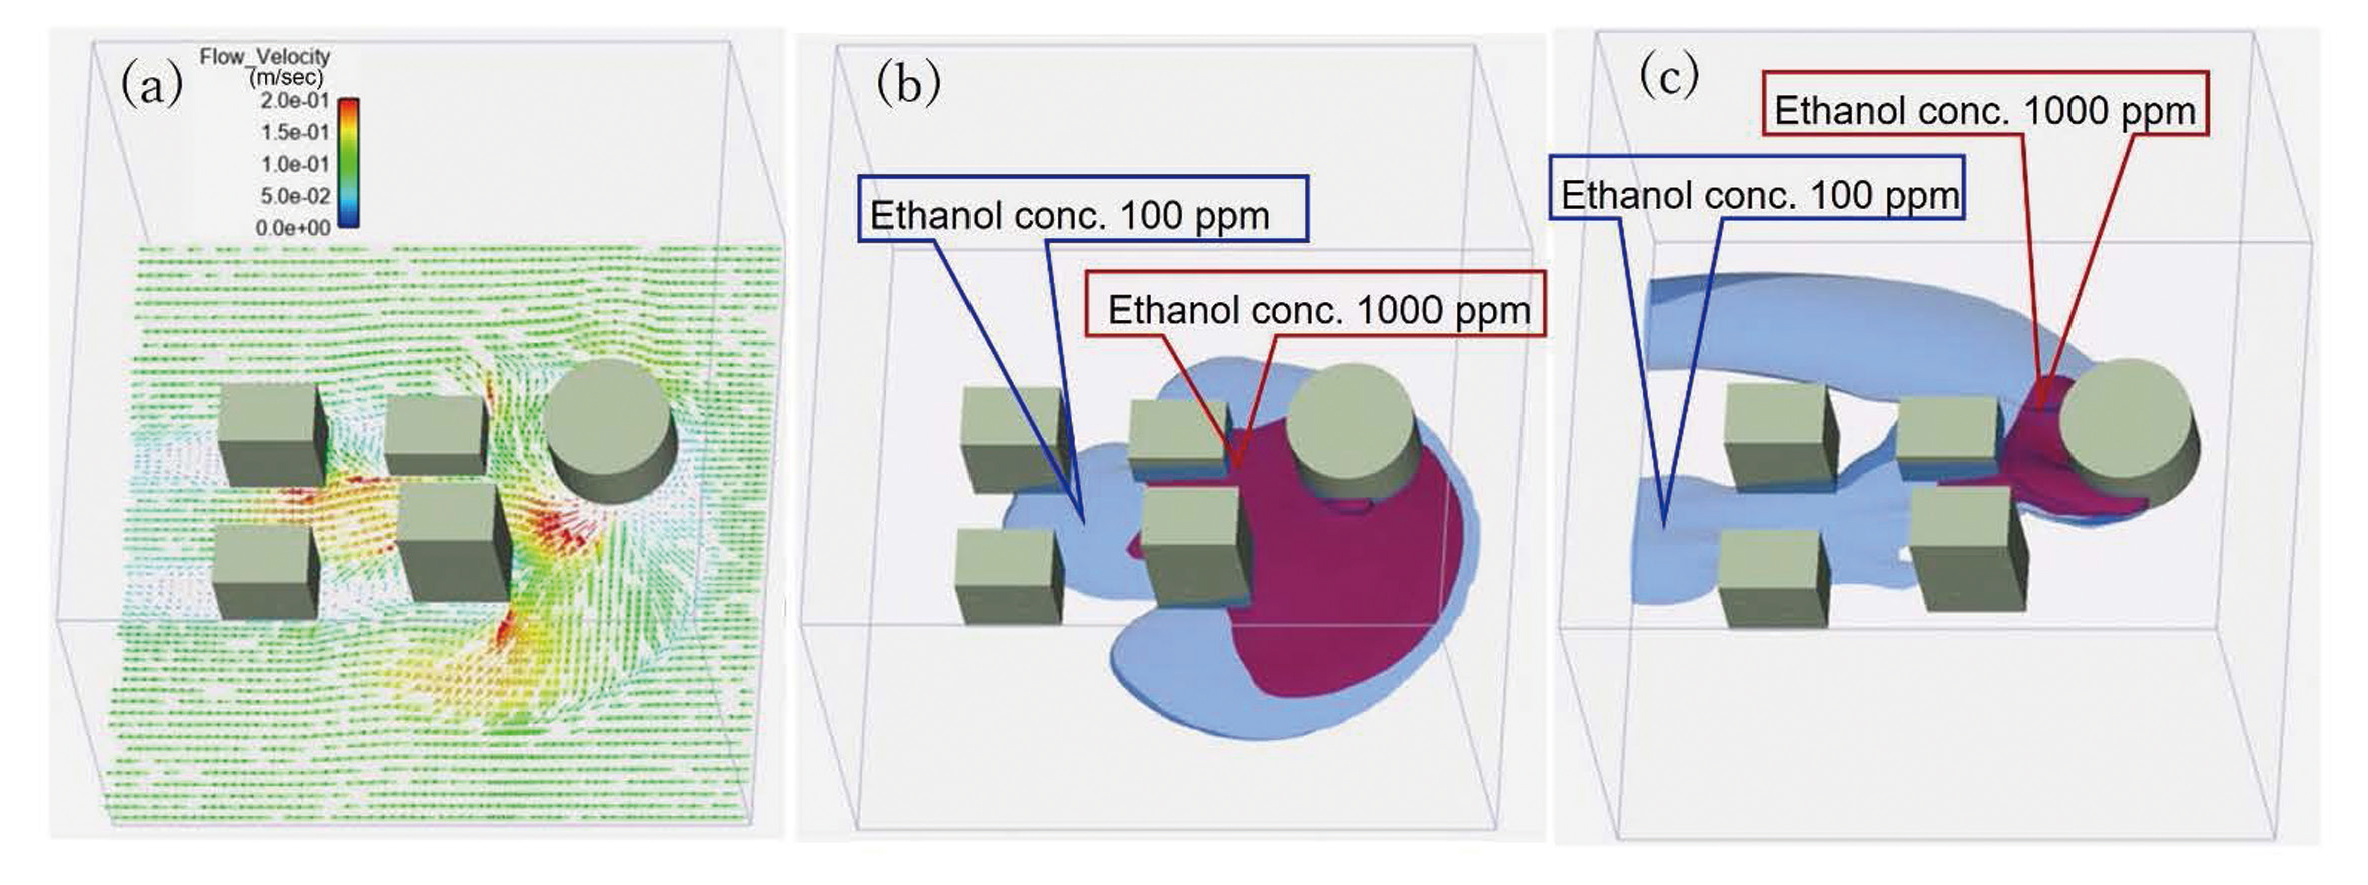
As a result of the CFD, Fig. 6(a) shows a wind velocity vector diagram (i.e., horizontal section 1 m from the ground). The areas with ethanol concentrations of 100 ppm (blue) and 1000 ppm (red) within 5 min after leakage initiation at a wind velocity of 0.1 and 0.5 m/sec are illustrated in Fig. 6(b) and 6(c), respectively. Given that the density of ethanol gas is heavier than air (i.e., density ratio 1.6), leaked ethanol gas spreads downwards and accumulates on the surface of the ground. Thus, the diffusion of leaked ethanol gas greatly differed depending on the wind speed, with the area of higher concentrations varying significantly.
Calculated results of ethanol gas concentration time-dependent changes at two locations (i.e., locations A and B) are showed in Fig. 7. At location A, the ethanol concentration differs greatly depending on the wind speed. Accordingly, the ethanol concentrations sometimes exceeded 2000 ppm at 0.1 m/sec and reached almost 0 ppm at 0.5 m/sec. At location B, the concentrations were equal to or sometimes exceeded 1000 ppm at both wind speeds. Considering these time-dependent changes in ethanol gas concentrations, the exposure concentrations for the PBPK model were determined in the following analyses.

As a scenario for risk assessment, the worker stays at point A or B (see Fig. 5) for 1000 sec, from 600 to 1600 sec, and is exposed to high concentrations of ethanol gas for this period of time. After that, evacuation to a safe location with no ethanol concentration in the air was assumed. The PBPK model used in this study “IndusChemFate” does not allow for temporal changes in exposure concentration and only supports constant concentration. Therefore, in this study, the average concentration over the exposure time of the workers in the above scenario (600 sec from the start of exposure to 1000 sec) was determined and used as the exposure concentration in the PBPK model. The time variation of exposure concentrations during the movement to rush to the work location before the work and during the movement to a safe location after the work were not considered, and calculations were made for instantaneous start of exposure and instantaneous zero exposure concentrations after the work. The average concentrations (ppm) calculated by the CFD and the values converted to units (mg/m3) for input to the PBPK model are shown in Table 3. Some commercially available PBPK model software can take into account time-dependent changes in exposure concentrations, hence, these can be used to perform a more accurate analysis.
Table 3. Exposure concentrations of toxic gases at different wind speeds and locations. The unit system of concentration is shown for the results of CFD (ppm) and for the input of the PBPK model (mg/m
3).
|
Case1 |
Case2 |
Case3 |
Case4 |
| Conc. (unit) |
Wind 0.1 m
Location A |
Wind 0.1 m Location B |
Wind 0.5 m Location A |
Wind 0.5 m Location B |
| ppm |
1.69E+03 |
1.94E+03 |
1.21E-05 |
9.27E+02 |
| gm/m3 |
2.04E+03 |
2.34E+03 |
1.46E-05 |
1.12E+03 |
To evaluate the effects on the worker, the exposure concentrations calculated from the CFD were used to calculate the changes in blood concentrations of ethanol and metabolites over time during the first 2 hr (i.e., 7200 sec) of exposure using the “IndusChemFate”. In order to include gender, body shape, age, and physical activity of the person being evaluated, “IndusChemFate” has a database of physiological and anatomical parameters for twelve types of human and animal data (see Table 4). By selecting one of these options, physiological and anatomical parameters, consisting of the body weight and blood flow rate (see Table 5), are automatically set. In this study, the option no. 1 (male, standard body and resting) was selected as a standard worker.
Table 4. Human and animal data for the PBPK model. The built-in database of “IndusChemFate” contains twelve different sexes, body systems, ages, body weights, blood flow rates, etc. according to activity status.
| No. |
Human |
Body shape |
Activity |
| 1 |
Male |
Normal |
Resting |
| 2 |
Obese |
Resting |
| 3 |
Normal |
Light working |
| 4 |
Obese |
Light working |
| 5 |
Female |
Normal |
Resting |
| 6 |
Obese |
Resting |
| 7 |
Normal |
Light working |
| 8 |
Obese |
Light working |
| 9 |
Child |
Normal |
Playing |
| 10 |
Obese |
Playing |
| 11 |
Mouse |
Experimental animal |
| 12 |
Rat |
Experimental animal |
Table 5. Physiological and anatomical parameters
| Male·Normal·in rest |
| BodyWt# = 70 'kg normal man |
| FrArt# = 0.3 'fraction arterial blood |
| FrVen# = 0.7 'fraction venous blood |
| VolBlood# = 0.0832 * BodyWt# 'litre |
| VolBlungArt# = FrArt# * VolBlood# 'volume arterial blood |
| VolBlungVen# = FrVen# * VolBlood# 'volume venous blood |
| VolAdip# = 0.184 * BodyWt# 'litre VolBone# = 0.0589 * BodyWt# 'litre |
| VolBrain# = 0.0192 * BodyWt# 'litre |
| VolHeart# = 0.0051 * BodyWt# 'litre |
| VolKidney# = 0.0046 * BodyWt# 'litre |
| VolIntest# = 0.0222 * BodyWt# 'litre |
| VolLiver# = 0.0225 * BodyWt# 'litre V |
| olLungs# = 0.0144 * BodyWt# 'litre |
| VolMuscle# = 0.4576 * BodyWt# 'litre |
| VolSkin# = 0.0553 * BodyWt# 'litre |
| VolMarrow# = 0.0729 * BodyWt# 'litre |
| TotSkin# = 18000 'body surface cm2 |
| SkinFac# = 1 'ratio skin permeability |
| UrinFlow# = 0.0214 'litre/kgbw/day |
| GlomFiltr# = 0.08 'fraction of renal arterial flow |
| CardOutp# = 6 * BodyWt# 'litres per hour |
| AlvVent# = 7 * BodyWt# 'litres per hour |
| FrAdip# = 0.08226 'fraction cardiac output rest |
| FrBone# = 0.04139 'fraction cardiac output rest |
| FrBrain# = 0.09814 'fraction cardiac output rest |
| FrHeart# = 0.10536 'fraction cardiac output rest |
| FrKidney# = 0.16886 'fraction cardiac output rest |
| FrLivVen# = 0.152 'fraction cardiac output rest |
| FrLivArt# = 0.0381 'fraction cardiac output rest |
| FrLung# = 0.0234 'fraction cardiac output rest |
| FrMuscle# = 0.13711 'fraction cardiac output rest |
| FrSkin# = 0.06783 'fraction cardiac output rest |
| FrMarrow# = 0.08515 'fraction cardiac output rest |
The conditions automatically set by "IndusChemFate" (body weight, blood flow rate, organ size, etc.).
In this case, option No. 1 in Table 4 (Male, Normal body shape, in rest) was selected.
For ethanol metabolism, the following metabolic pathway was analyzed in this study.
Primary metabolism Secondary metabolism
CH3CH2OH → CH3CHO → CH3COOH
“IndusChemFate” has a build-in database for basic physical properties and kinetic parameters such as metabolic data are included. Including ethanol, 14 substances (Pyrene, MTBE, Benzene, Aniline, ETBE, NMP, Ethylene, Heptane, 1,2-Dichloroethane, Ethanol, Butoxyethanol, Glycol, Hydrocyanic acid, Bisphenol A) and their primary to quaternary (different for each substance) metabolites are registered in the databases, based on published literature. The physical properties of ethanol and its metabolites, which were automatically acquired from the database, are shown in Table 1. Only the liver was considered as the organ responsible for metabolism. Values for the pharmacokinetic parameters (Vmax and Km) for ethanol were taken from Umulis et al. (2005). In “IndusChemFate”, Vmax is represented in µmol/kg tissue/hr. From the commonly reported values determined in vitro, scaling to in vivo hepatic drug clearance values should be performed using a factor of 0.04 mg/kg (i.e., assuming microsomal fraction of liver tissue is approximately 4% and average human liver weight is 2 kg).
The changes in the venous blood concentration of ethanol and its toxic metabolite acetaldehyde in the worker's body calculated by the PBPK model for the exposure concentrations calculated by CFD for the four scenarios (i.e., locations A and B and wind speeds of 0.1 and 0.5 m/sec) are showed in Fig. 8. During the exposure period (i.e., 1000 sec), the ethanol concentration in venous blood increases rapidly, followed by an increase in the acetaldehyde concentration. The highest blood concentration in each condition corresponds to the exposure concentration. At location B, where the exposure concentration is the highest, with a wind speed of 0.1 m/sec, the exposure concentration was 2340 mg/m3, and the peak ethanol blood concentration was also the highest at 161 µmol/L. The time to reach the highest blood concentration was 1020 sec for ethanol and 1040 sec for acetaldehyde, indicating a delay of 20 and 40 sec for ethanol and acetaldehyde, respectively, after exposure was completed. “IndusChemFate” can estimate the changes in blood concentrations of the parent compound and its metabolites as well as the concentrations in 11 organs and in urine and breath. In this study, only the blood concentration of ethanol was used for risk assessment.

Acute intoxication symptoms for blood concentrations of ethanol have been well studied previously (Vonghia et al., 2008). When blood ethanol levels exceed 10,900 µmol/L, acute psychosomatic symptoms become apparent, such as increased talkativeness and decreased ability in cognitive and agility tasks. The highest blood ethanol concentration among the four scenarios, with a peak value of 161 µmol/L at “location B, wind speed 0.1 m/sec”, was significantly low compared to the blood concentration of 10,900 µmol/L in the exhilaration period. Thus, in the four cases assumed in this study as actual possible scenarios, there were no cases in which the effects of ethanol were noticeable. Therefore, it is estimated that the evacuation and short-term rescue operations can be performed safely.
The PBPK tool used in this study can take into consideration the absorption of toxic substances through different routes, such as inhalation and transdermal absorption. We posited that the tool could be used to evaluate the effectiveness of protective equipment, such as gas masks for inhalation and protective clothing for transdermal absorption. Therefore, the next analysis was conducted to evaluate the effects of gas masks and protective clothing when a person who handles an accident remains for a long period of time (2 hr, i.e., 7200 sec) in an area with an exposure concentration of 2340 mg/m3, which was estimated by the CFD in the case of “location B, wind speed 0.1 m”. As illustrated in Fig. 9, the change in blood ethanol concentration was calculated for three different scenarios: no protective equipment, wearing a gas mask (i.e., reducing the ethanol concentration in inhaled gas to a 1/100 ratio), and wearing protective clothing (i.e., reducing the ethanol exposure concentration on the skin to a 1/100 ratio). Peak ethanol blood concentrations were reduced by 83% and 17% when wearing a gas mask or protective clothing, respectively, as compared to no protective equipment. These findings clearly indicated that it is possible to evaluate each effectiveness of protective equipment separately, enables the choice of the proper protective equipment, and allowable work time when working in toxic exposure environments.

DISCUSSION
In chemical plant design, where both safety and economic efficiency are important, it is necessary to evaluate various risk in an accurate and flawless manner. In recent years, there has been an increasing need to develop methods in this regard. Hence, in this study, we proposed a new method that combines both CFD and PBPK model to be used as a novel risk assessment tool.
In conventional methods addressing the risk assessment of toxic gas leakage, gas diffusion is calculated using a simplified model or CFD whereas the effects on human health are assessed by comparing the assumed exposure concentration to the acceptable guideline concentration (i.e., threshold concentration) for acute toxicity. Toxic gas diffusion calculations used to be performed using a simple model of gas diffusion due to the calculation speed of computers. However, in recent years, many methods using highly accurate CFD, which reproduces the detailed structural geometry of the target area due to faster calculation speeds, have been proposed (He et al., 2017; Gousseau et al., 2011; Lim et al., 2017; Efthimiou et al., 2017). Our study analyzed a leak of ethanol gas as a model for toxic gas leakage using CFD considering the effects of toxicant jet position, jet direction, jet velocity, jet volume, ambient wind direction and wind speed. As shown in Fig. 6, the diffusion of the leaked ethanol gas was visualized, which allowed the observation that the exposure concentration greatly varies with time, depending on wind speed and the location of the person. Thus, it is possible to evaluate the effects of the weather (i.e., wind speed) and the leakage conditions of toxic substance on the day of accident.
On the other hand, conventional methods used for evaluating the risk of exposure concentrations on the human body only use the allowable guideline concentration (i.e., threshold concentration). Different allowable concentration values are provided by several different agencies and this makes it difficult to choose which allowable guideline concentration should be used when conducting risk assessments at actual sites (Bos et al., 2010). In addition, multiple threshold concentrations are provided for the same substance, which can lead to the underestimation of the hazard by inappropriate selection or, conversely, to the worsening of the economic efficiency by conducting an excessively severe evaluation. Öberg et al. compared AEGLs and ERPGs values and reported that for about 40% of substances, including those with high production volumes, the acceptable guideline concentrations deviated by a factor superior of 3 (Öberg et al., 2010). Heinälä et al. reported that experts in chemical safety in twenty-four European Union countries were surveyed about the usability of the acceptable concentrations in various guideline, and 35% of responders stated that they were difficult to use (Heinälä et al., 2013). Moreover, this study has highlighted that it is confusing in cases where multiple types of allowable guideline concentrations with different values are defined, representing the main reason for the variation in risk assessment practices.
Although the chemical substances registered in these databases have been added and updated continuously, they do not cover all chemical substances used in chemical plants. Furthermore, the availability of threshold concentration data has limited the number of cases that can be evaluated. To solve the above-mentioned issue, this study proposed a method to evaluate the effect of a toxic substance on human health by estimating blood concentrations using the PBPK model. In this model, and importantly, the absorption rates by multiple routes (e.g., inhalation and transdermal absorption), the activity state of the person being analyzed (e.g., rest, exercise, etc.), the amount of blood circulation, and the metabolic processing of the toxic substance in each organ can be considered separately. As a result, intra-individual and inter-individual variations including body size, race and clinical conditions in response to exposure to toxic substances can be determined using the blood concentrations of toxic substances, making it feasible to evaluate the effects on the human body in different scenarios. Furthermore, the effectiveness of each type of protective equipment, such as gas masks and protective clothing, can be quantitatively evaluated. Thus, the analysis method of this study enables a highly accurate risk assessment for a wide range of scenarios, in the evacuation and post-response phases of an accident event of a toxic gas leak.
There are several PBPK models currently available, but each model has different features (e.g., performance) that can be considered, one should evaluate which model to use in advance. As reported by Pletz et al., the performance of eight publicly available PBPK models, namely Stochastic Human Exposure and Dose Simulation (SHEDS) model, “ConsEXPO”, “EUSES”, “Integra”, “IndusChemFate”, “HBM Simulator”, “MerlinExpo”, and “R/Httk”, was evaluated. Five of these models (i.e., “Integra”, “IndusChemFate”, “HBM Simulator”, “MerlinExpo”, and “R/Httk”) were chosen through primary screening based on the following criteria: easy to use, readily available, full documentation and instruction manual, transparent and simple, and easy to manipulate in case minor amendments were needed. In a second round, two models (i.e., “IndusChemFate” and “R/Httk”) were selected through screening based on following criteria: simple to use, simple to download, simple to implement, without commercial license, availability of model code to check the equation and, if necessary, to adapt it and reported platform validation. Finally, these two selected models were validated in detail based on World Health Organization (WHO) criteria for PBPK models (World Health Organization, 2010). In both models it was concluded that “A standard overall evaluation could be drawn for substances for which kinetic parameters are available”. However, the current version of “R/Httk” (version 2.1.0, 2022) only considers oral intake as an input value (https://cran.r-project.org/web/packages/httk/index.html). In our study, we used “IndusChemFate”, a model evaluated favorably by Pletz et al., which considers inhalation exposure as an input value.
Our method requires a set of requirements, namely the physical property data for CFD and the absorption/metabolism parameters for the PBPK model in order to analyze the exposure to toxic substance. Although there is a sufficient amount of physical property data for CFD, the number of chemicals for which the required parameters for PBPK model are available is currently limited. The parameters used in this study for PBPK model were the values for which the accuracy of the analysis was confirmed by Jongeneelen and Berge (2011). These authors compared the experimental data from a 2007 study (Kramer et al., 2007), calculated values using “IndusChemFate” (version 1.0) and validated the accuracy of the simulation. We confirmed that straightforward case studies were possible in cases where pharmacokinetic parameters were available from the built-in database, as in the present ethanol study. In recent years, PBPK model has been used to evaluate the effects of chemical substances on the human body (Tralau et al., 2012; Zeise et al., 2013). Enhancement of absorption and metabolism parameters is expected for each chemical substance.
In conclusion, we propose a new tool for quantitative risk assessment of toxic gas leakage by coupling CFD and the PBPK model to simulate the blood concentration of ethanol, a model of a leaked toxicant, after a leakage event. R-FLOW and “IndusChemFate” were used as simulation software to integrate both CFD and the PBPK model, which have already been experimentally verified and can be used as general-purpose tools with proven analysis accuracy. This method can be used for any toxic gas if the physical properties and pharmacokinetic parameters are available. Moreover, it is relatively easy for anyone to apply to the safety evaluation of a wide range of chemical substances during production, storage, and use. Although in this study the method was developed for gas leakage, it can also be applied to liquid leakage. This analysis will be performed in future studies, by extending the computational method of CFD to consider liquid volatilization.
Conflict of interest
The authors declare that there is no conflict of interest.
REFERENCES
- Bacon, J., Gallagher, E. and Paton, A.C. (1999): Emergency Planning for Major Accidents. Health and Safety Executive. https://www.hse.gov.uk/pubns/priced/hsg191.pdf
- Bos, P.M., et al. (2010): Human risk assessment of single exposure in chemical incidents. National Institute for Public Health and the Environment. https://www.rivm.nl/bibliotheek/rapporten/320300001.pdf
- Department for Business Innovation & Skills UK. (2013): Review of Enforcement in the Chemicals Industry (COMAH). https://assets.publishing.service.gov.uk/government/uploads/system/uploads/attachment_data/file/77153/bis-13-557-review-of-enforcement-in-chemicals-industry-comah.pdf
- Efthimiou, G.C., Andronopoulos, S., Tavares, R. and Bartzis, J.G. (2017): CFD-RANS prediction of the dispersion of a hazardous airborne material released during a real accident in an industrial environment. J. Loss Prev. Process Ind., 46, 23-36.
- European Medicines Agency. (2018): Guideline on the reporting of physiologically based pharmacokinetic (PBPK) modelling and simulation. https://www.ema.europa.eu/en/documents/scientific-guideline/guideline-reporting-physiologically-based-pharmacokinetic-pbpk-modelling-simulation_en.pdf
- Fragki, S., Piersma, A.H., Westerhout, J., Kienhuis, A., Kramer, N.I. and Zeilmaker, M.J. (2022): Applicability of generic PBK modelling in chemical hazard assessment: A case study with IndusChemFate. Regul. Toxicol. Pharmacol., 136, 105267.
- Gousseau, P., Blocken, B. and van Heijst, G.J. (2011): CFD simulation of pollutant dispersion around isolated buildings: on the role of convective and turbulent mass fluxes in the prediction accuracy. J. Hazard. Mater., 194, 422-434.
- He, L., Hang, J., Wang, X., Lin, B., Li, X. and Lan, G. (2017): Numerical investigations of flow and passive pollutant exposure in high-rise deep street canyons with various street aspect ratios and viaduct settings. Sci. Total Environ., 584-585, 189-206.
- Heinälä, M., Gundert-Remy, U., Wood, M.H., Ruijten, M., Bos, P.M., Zitting, A., Bull, S., Russell, D., Nielsen, E., Gassel, G., Leffler, P., Tissot, S., Vincent, J.M. and Santonen, T. (2013): Survey on methodologies in the risk assessment of chemical exposures in emergency response situations in Europe. J. Hazard. Mater., 244-245, 545-554.
- Hirata, K., Ishida, H., Hiragohri, M., Nakayama, Y. and Kajiwara, T. (2014): Effectiveness of a backward mixing screw element for glass fiber dispersion in a twin-screw extruder. Polym. Eng. Sci., 54, 2005-2012.
- Huizer, D., Oldenkamp, R., Ragas, A.M., van Rooij, J.G. and Huijbregts, M.A. (2012): Separating uncertainty and physiological variability in human PBPK modelling: the example of 2-propanol and its metabolite acetone. Toxicol. Lett., 214, 154-165.
- Huizer, D., Huijbregts, M.A., van Rooij, J.G. and Ragas, A.M. (2014): Testing the coherence between occupational exposure limits for inhalation and their biological limit values with a generalized PBPK-model: the case of 2-propanol and acetone. Regul. Toxicol. Pharmacol., 69, 408-415.
- httk, https://cran.r-project.org/web/packages/httk/index.html
- IndusChemFate. http://cefic-lri.org/toolbox/induschemfate/
- I, Y.P. and Cheng, T.L. (2008): The development of a 3D risk analysis method. J. Hazard. Mater., 153, 600-608.
- Jongeneelen, F.J. and Berge, W.F. (2011): A generic, cross-chemical predictive PBTK model with multiple entry routes running as application in MS Excel; design of the model and comparison of predictions with experimental results. Ann. Occup. Hyg., 55, 841-864.
- Kefalas, D.A., Christolis, M.N., Nivolianitou, Z. and Markatos, N.C. (2006): Consequence analysis of an open fire incident in a pesticide storage plant. J. Loss. Prevent. Proc., 19, 78-88.
- Komoda, Y., Inoue, Y. and Hirata, Y. (2001): Characteristics of laminar flow induced by reciprocating disk in cylindrical vessel. J. Chem. Eng. of Jpn, 34, 919-928.
- Kramer, A., Below, H., Bieber, N., Kampf, G., Toma, C.D., Huebner, N.O. and Assadian, O. (2007): Quantity of ethanol absorption after excessive hand disinfection using three commercially available hand rubs is minimal and below toxic levels for humans. BMC Infect. Dis., 7, 117.
- Lea, C.J., et al. (2002): A Review of the State-of-the-Art in Gas Explosion Modelling. Health & Safety Laboratory. https://www.hse.gov.uk/research/hsl_pdf/2002/hsl02-02.pdf
- Lim, H., Um, K. and Jung, S. (2017): A study on effective mitigation system for accidental toxic gas releases. J. Loss Prev. Process Ind., 49, 636-644.
- Liu, L.F., Ni, L., Jiang, J.E., Mebarki, A. and Zhang, W.X. (2018): Consequence analysis of derivative accidents due to reaction runaway. J. Loss. Prevent. Proc., 55, 471-479.
- Mizuta, Y., Sumino, M., Kunito, Y., Shiota, K., Izato, Y. and Miyake, A. (2020): Emergency evacuation model assuming leakage of toxic substances in a chemical plant. J. Loss. Prevent. Proc., 68, 104287.
- Nagaosa, R.S. (2014): A new numerical formulation of gas leakage and spread into a residential space in terms of hazard analysis. J. Hazard. Mater., 271, 266-274.
- Nakayama, Y., Kajiwara, T. and Masaki, T. (2016): Strain Mode of General Flow: Characterization and Implications for Flow Pattern Structures. AIChE J., 62, 2563-2569.
- Nakayama, Y., Takemitsu, H., Kajiwara, Kimura, K., Takeuchi, T. and Tomiyama, H. (2018): Improving Mixing Characteristics with a Pitched Tip in Kneading Elements in Twin-Screw Extrusion. AIChE J., 64, 1424-1434.
- Öberg, M., Palmen, N. and Johanson, G. (2010): Discrepancy among acute guideline levels for emergency response. J. Hazard. Mater., 184, 439-447.
- Office of Special Disasters, Fire and Disaster Management Agency, Japan. (2013): Disaster Prevention Assessment Guidelines for Petroleum Complexes (Japanese).
- Pletz, J., Blakeman, S., Paini, A., Parissis, N., Worth, A., Andersson, A.M., Frederiksen, H., Sakhi, A.K., Thomsen, C. and Bopp, S.K. (2020): Physiologically based kinetic (PBK) modelling and human biomonitoring data for mixture risk assessment. Environ. Int., 143, 105978.
- Qi, R., Ng, D., Cormier, B.R. and Mannan, M.S. (2010): Numerical simulations of LNG vapor dispersion in Brayton Fire Training Field tests with ANSYS CFX. J. Hazard. Mater., 183, 51-61.
- R-flow Co. Saitama, Japan. http://www.rflow.co.jp/product.html#RFLOW
- Senda, S., Komoda, Y., Hirata, Y., Takeda, H., Suzuki, H. and Hidema, R. (2014): Fluid Deformation Induced by a Rotationally Reciprocating Impeller. J. Chem. Eng. of Jpn, 47, 151-158.
- Tralau, T., Riebeling, C., Pirow, R., Oelgeschläger, M., Seiler, A., Liebsch, M. and Luch, A. (2012): Wind of change challenges toxicological regulators. Environ. Health Perspect., 120, 1489-1494.
- Umulis, D.M., Gürmen, N.M., Singh, P. and Fogler, H.S. (2005): A physiologically based model for ethanol and acetaldehyde metabolism in human beings. Alcohol, 35, 3-12.
- U.S. Environmental Protection Agency. (1987): Technical Guidance for Hazards Analysis. https://www.epa.gov/sites/default/files/2015-09/documents/technical_guidance_for_hazard_analysis.pdf
- Vonghia, L., Leggio, L., Ferrulli, A., Bertini, M., Gasbarrini, G. and Addolorato, G.; Alcoholism Treatment Study Group. (2008): Acute alcohol intoxication. Eur. J. Intern. Med., 19, 561-567.
- Wood, M., Pichard, A., Gundert-Remy, U., de Rooij, C. and Tissot, S.M. (2006): The AETL methodology as a potential solution to current challenges associated with the development and use of acute exposure levels in Seveso II applications. J. Hazard. Mater., 133, 8-15.
- World Health Organization. (2010): Characterization and application of physiologically based pharmacokinetic models in risk assessment. International Programme on Chemical Safety. Harmonization Project Document No. 9. https://apps.who.int/iris/handle/10665/44495.
- Zeise, L., Bois, F.Y., Chiu, W.A., Hattis, D., Rusyn, I. and Guyton, K.Z. (2013): Addressing human variability in next-generation human health risk assessments of environmental chemicals. Environ. Health Perspect., 121, 23-31.

;%0A%09%09%09newWindow.document.open();%0A%09%09%09newWindow.document.write('<img src=%22./Graphics/48_285-t1.jpg%22>');%0A%09%09%09newWindow.document.close();%0A%09%09)
