Abstract
To ensure safety in chemical plants handling a wide variety of liquid and gaseous hazardous substances, it is necessary to carry out highly accurate risk assessments and take appropriate measures. In this study, a risk assessment method was developed for the problem of the leakage of liquid hazardous substances. The risk assessment of toxic liquid leaks must consider the exposure of workers to the liquid and toxic gases produced by vaporization. The absorption and subsequent metabolism of hazardous substances in the body via multiple pathways after exposure to liquids and gases was calculated using a pharmacokinetic model. Estimation of exposure concentrations of toxic gases volatilized from leaked liquids was reproduced by computational fluid dynamics simulation. In this study, ethanol was selected as the hazardous substance and the risk of hazardous liquid leakage was assessed. The results of the analysis, which considered liquid and gas exposure under the conditions of the assumed scenario, showed that the maximum blood concentration of ethanol was 1640 µmol/L, which is sufficiently low compared to the concentration of 10,900 µmol/L at which acute toxic effects become apparent. These results suggest that work can be carried out safely under the conditions of the assumed scenario. The risk assessment methodology for liquid spills in this study confirms that risk assessment is possible under multiple scenarios, including individual differences, activity conditions, and the use of protective equipment.
INTRODUCTION
In order to deal with the occurrence of large-scale accidents and natural disasters at chemical plants handling liquid and gaseous hazardous substances, it is necessary to conduct risk assessments for various cases, such as the leakage of liquid and gaseous hazardous substances, and take appropriate measures from hardware and software aspects, including safety design and warning systems (Bos et al., 2010; Department for Business Innovation & Skills UK., 2013; Wood et al., 2006; Kefalas et al., 2006; Liu et al., 2018).
For the risk assessment of toxic substance leakage in chemical plants, it is necessary to develop an appropriate risk assessment method depending on the form of the leaked material because the phenomena to be considered differ depending on whether the leaked toxic substance is a gas or a liquid. In a previous report (Horiguchi and Numazawa, 2023), we developed a risk assessment method for cases where the leaked material is gas. In this report, we developed a risk assessment method for cases where the leaked material is liquid. In the case of liquid leakage, in addition to the method for gas exposure developed in the previous report, it is necessary to consider the following two points: "liquid exposed" and "gas generation due to volatilization from the leaked liquid". In this study, the methodology has been improved to take these two points into account.
Risk assessment for liquid toxic substance leakage problems is conducted in two steps: 1) volatilization of the leaked liquid and volatile gas diffusion prediction, and 2) risk assessment of exposure of the human body to the volatile gas and liquid.
1) For the volatilization and diffusion prediction of leaked material, toxic substances in the leaked liquid generate a pool on the ground. Toxic gases are generated by volatilization from the liquid surface of the pool, and the diffusion of these gases to the surrounding environment is analyzed using a gas diffusion model based on a chemical engineering model or Computational Fluid Dynamics (CFD), which numerically solves the Navier-Stokes equations in a three-dimensional (3D) space, to estimate temporal changes in the concentration distribution of the toxic gases (Bash et al., 2013; Bellegoni et al., 2021; Cui and Wu, 2016; Fernandez et al., 2012; Gopalaswami et al., 2017; Pandya et al., 2008; He et al., 2017; Lim et al., 2017; Mizuta et al., 2020; Qi et al., 2010; Nagaosa, 2014; I and Cheng, 2008).
In this study, 1) we predicted the volatilization and diffusion of leaked material using the same CFD software as in the previous report (commercially available CFD software "R-FLOW"). Unlike the gas leak in the previous report, a liquid leak requires the consideration of toxic gas generation due to vaporization from the liquid surface. Although R-FLOW does not have a function to consider vaporization from the liquid surface, we used the temperature analysis function of R-FLOW to calculate volatilization from the liquid surface and diffusion of gases generated by volatilization using the analogy between mass diffusion and heat conduction. This enables the analysis of the diffusion of toxic gases volatilized from the liquid surface to the surrounding area by wind flow that considers the detailed 3D shapes of the buildings and other structures around the leakage point. The analysis was performed assuming a constant temperature (isothermal analysis).
2) To the best of our knowledge, no risk assessment method that simultaneously considers the effects of exposure to volatile gases and exposure to liquids has been reported. For exposure to volatile gases, the method reported previously and conventional methods using allowable concentrations exist, but none of them consider the effects of the exposed liquid at the same time. In this study, 2) for the risk assessment of exposure to volatile gases and liquid exposure, a pharmacokinetic (PBPK) model “IndusChemFate” was used. As a validation study of the accuracy of “IndusChemFate”, Jongeneelen and Berge (2011) showed that the absorption and subsequent metabolism of ethanol in the body during ethanol disinfection of the skin can be analyzed to accurately calculate changes in the blood concentration of ethanol. In this study, ethanol, whose analytical accuracy was confirmed by Jongeneelen and Berge (2011), was selected as a model substance.
MATERIALS AND METHODS
Overview of the Analysis Methods
To assess the quantitative impact of toxic liquid leaks from a tank on workers in the surrounding area, we used a combined CFD and PBPK modeling approach as shown in the flow diagram in Fig. 1. CFD analyzes the volatilization from the surface of a pool of liquid leaking from a tank, the diffusion of gases generated by the volatilization to the surrounding area under the influence of wind, and calculates the time variation of the concentration of toxic gases in the air at the worker's position. In the PBPK model, the concentration data calculated by CFD are used as the toxic gas exposure concentration. The PBPK model calculates the absorption of toxic gases through respiration and the skin. The dermal absorption of liquid after exposure to the leaked liquid is also calculated, and the change over time in the blood concentration of the absorbed toxicant due to metabolism is calculated.

The effects of the toxic substances on the human body were evaluated based on the blood concentrations of the toxic substances. Details of the CFD and PBPK model analysis methods are described below.
CFD analysis method using R-flow:
Toxic gases are generated from the liquid surface of a pool formed by liquid leakage from a tank due to volatilization. The diffusion of the generated toxic gas to the surrounding area considering wind was calculated using a commercial CFD analysis, and the detailed concentration distribution of the toxic gas was calculated. In a previous study (Horiguchi and Numazawa, 2023), R-FLOW (R-FLOW Corp. Saitama, Japan) was used for fluid analysis to evaluate the impact of the leaked toxic gas, and R-FLOW was also used in this study. The finite volume method was used to discretize the gas flow in space and time to calculate the diffusion of toxic gases into the surrounding area. For the risk assessment of a liquid leakage accident, in addition to the calculation of gas diffusion, it is necessary to analyze volatilization from the surface of the liquid in a liquid pool. The analysis method for volatilization is shown below.
At the liquid surface in contact with the atmosphere, the volatilized gas concentration can be maintained at a saturated concentration. Therefore, as a boundary condition for the interface in contact with the liquid surface in CFD, the volatilized gas concentration is fixed at the saturated concentration, and the surrounding concentration distribution due to diffusion is analyzed over time. Even if the gas concentration near the liquid surface decreases due to surface renewal by wind, the gas concentration is maintained at the saturation concentration at the liquid surface due to volatilization from the surface. The volatilization rate from the liquid surface is calculated by the mass transfer resistance at the boundary layer and the concentration gradient between the top and bottom of the boundary layer, and the volatilization amount can be calculated by integrating the volatilization rate with time.
The 3D fluid analysis software R-FLOW used in this study does not have a function that specifies the saturation concentration at the gas-liquid interface, which is necessary when considering liquid volatilization. Therefore, a heat conduction analysis function with the same form of governing equations was used to calculate the volatilization and diffusion. The relationship between substance diffusion and heat conduction analogies used in this analysis is shown in Table 1.
Table 1. Analogy between material diffusion and heat conduction.

Based on the above analogy, a material diffusion analysis that considers volatilization can be performed by setting 1) ~ 4) below in the CFD software.
1) Replace the variable T (temperature) in the heat conduction equation with C (material concentration).
2) Set the constant c (specific heat) ρ (density) on the left side of the heat conduction equation to c=1/ρ so that c×ρ=1.
3) κ (thermal conductivity) with D (diffusion coefficient).
4) The concentration of volatile gases in the gas phase in contact with the liquid surface is set to the saturation concentration. Table 2 shows the gas properties used in the CFD analysis of this study.
Table 2. Physical properties of gases used in the analysis (temperature: 25°C, pressure 1013 hPa).

Based on these physical properties and the relationships in 2) and 3) above, the input values c and κ to R-FLOW were calculated as in the relationships (1) and (2).
c=1/ρ=1/1.2=0.833 (1)
κ=D=1.15e-5 (2)
The following four types of data are required as input information for CFD simulations of gas diffusion analysis considering volatilization.
Shape data: 3D shapes defined as the leakage area to be analyzed and its surrounding area were created. 3D shape data including structures such as tanks and buildings in the area were created using 3D computer aided design. The 3D shape model used in this study is shown in Fig. 2.
Range of leaked toxicant pool: For the liquid toxicant leak scenario, the range of the pool formed by the leak was specified. Toxic gases are assumed to be generated by volatilization from the liquid surface of the pool.
Wind velocity condition: To account for wind, the wind velocity entering the analysis area was entered as a boundary condition (see wind velocity arrows in Fig. 2). The simulation resulted in a velocity distribution of the airflow in the area.
Physical properties data: The density, viscosity, and diffusion coefficient of the gas are required. In this study, the values shown in Table 2 were used. The CFD analysis procedure involves a preliminary analysis of the wind flow in the analysis area, followed by an analysis of the evaporation and diffusion of toxic gas from the pool. CFD can output numerical values for wind speed, wind direction, and toxic gas concentration at any position and time. The calculation results can be displayed as 3D graphics to visualize the diffusion of the toxic gas. For risk assessment, scenarios such as the movement of the worker are assumed using such CFD analysis, and the concentration of toxic gases at the location where the worker stays is output as time-series data of exposure concentrations, which are used as input values for PBPK modeling. Because the PBPK model IndusChemFate, described below, used in this study does not support temporal changes in exposure concentrations, the temporal average of exposure concentrations during the exposure period was calculated and used as input data.
PBPK model: analysis method using IndusChemFate
The PBPK model software creates a mathematical model of the metabolism of chemical substances absorbed in the body and their circulation via blood flow using differential equations, and by connecting each organ and blood vessel, the changes of chemical substances in the body can be estimated quantitatively and dynamically. In this study, similar as previously reported for a gas leak risk assessment method (Horiguchi and Numazawa, 2023), we used “IndusChemFate” (Version 2.0) (http://cefic-lri.org/toolbox/induschemfate) as a PBPK model that has the ability to consider dermal absorption as well as inhalation by respiration as an absorption pathway.
Fig. 3 shows the 11 organs, blood flow, and absorption and excretion pathways considered in “IndusChemFate”. “IndusChemFate” can simultaneously consider the effects of exposure to liquids, which must be considered in the case of liquid leakage, as well as gas exposure that leads to percutaneous absorption.
Inhalation from the respiratory system and transdermal absorption can be considered gas absorption. The blood/gas partition coefficient for inhalation from the respiratory system and the octanol/water partition coefficient for dermal absorption are estimated by quantitative structure-activity relationships. Percutaneous absorption of the exposed fluid was calculated using a transdermal diffusion-based model that considers skin penetration (skin permeation coefficient).
As shown in Fig. 3, candidate organs for metabolic analysis by “IndusChemFate” include the intestine, lungs, and kidneys. In this study, only the metabolism of the liver was considered. Metabolism in organs can be calculated using the Michaelis-Menten equation (= Vmax and Km data) and modeled up to 4th order metabolism, but only one enzyme system per organ can be considered simultaneously. By varying the blood flow, size of each organ (e.g., blood residence time), and enzyme reaction rate parameters, it is possible to account for differences in age, race, and sex.
The physicochemical properties and metabolic data used in the PBPK model were taken from the internal organ database incorporated in “IndusChemFate” (Version 2.0), as previously reported (Horiguchi and Numazawa, 2023). Table S1 lists the values of physicochemical properties and metabolic data used in the analysis. “IndusChemFate” can estimate the blood concentrations of the parent compound and its metabolites as well as the concentrations in 11 organs, urine, and breath. In this study, only the blood concentration of ethanol was used for the risk assessment.
RESULTS
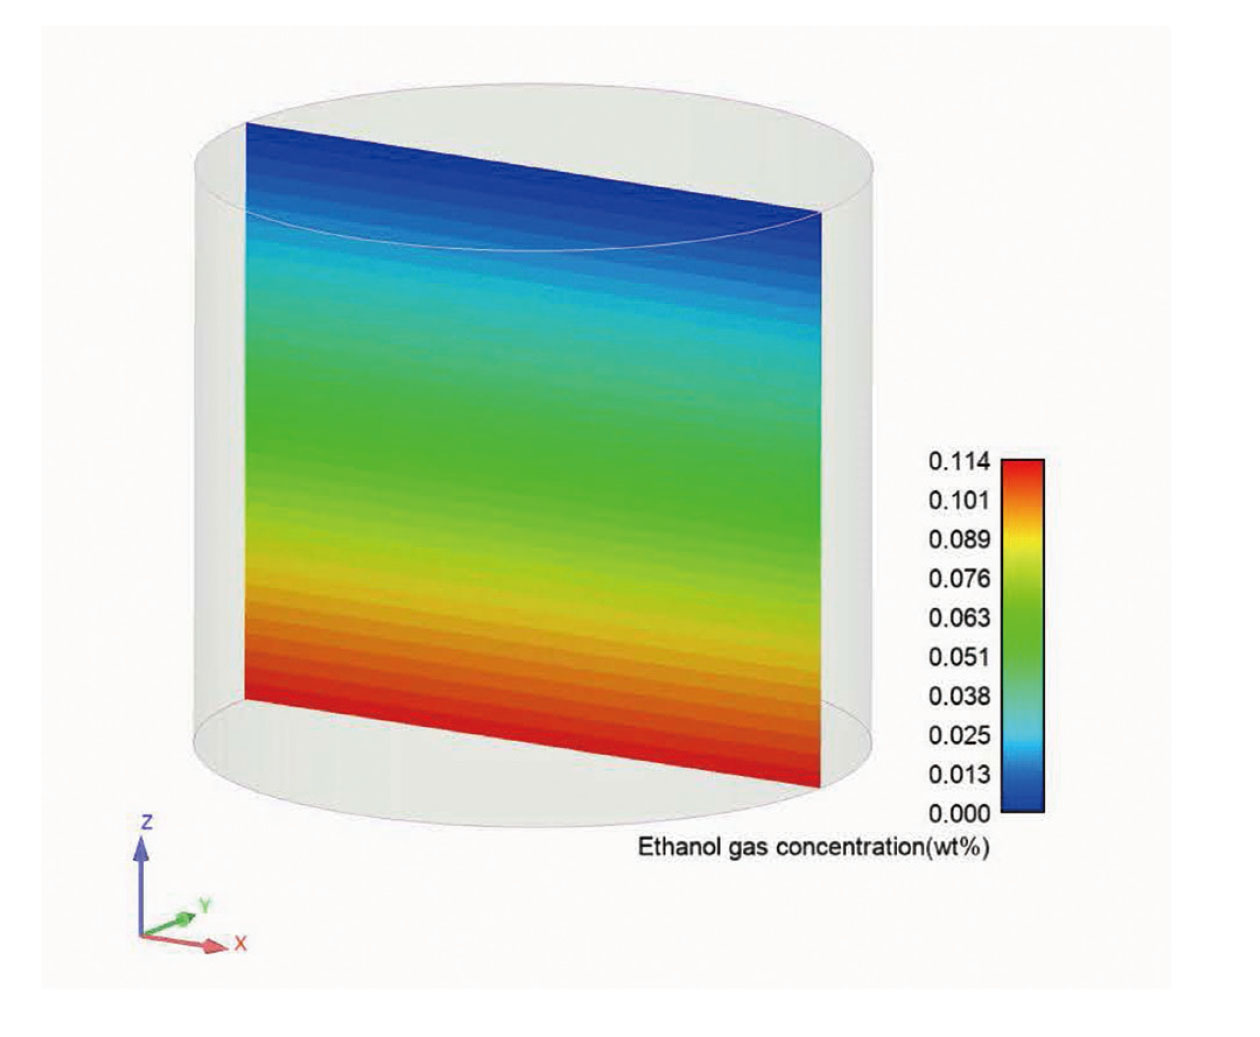
In this study, calculations using the relationship between mass diffusion and heat conduction analogy were performed in order to account for liquid volatilization. To confirm the validity of this analysis method, we compared the experimental results of the ethanol evaporation rate measurement conducted by Ito (2000) with the calculation results using this analysis method. Ito filled a cylindrical container of 40 mm diameter and 51 mm high with ethanol at a liquid depth of 16 mm, kept it at 25°C, opened the top lid, and measured the amount of ethanol that decreased due to evaporation over a 5-day period. The above settings 1) to 4) were performed on R-FLOW to reproduce the experiment by Ito.
Fig. 4 shows the ethanol gas concentration distribution (wt%) in the gas-phase portion of the vessel as calculated by R-FLOW. The calculated ethanol gas concentration at the ethanol liquid surface was set to 11.4 wt% and the saturation concentration to 25°C. It was confirmed that the area in contact with the liquid surface at the bottom had a saturation concentration of 11.4 wt% at 25°C, a reasonable result that decreased with a constant gradient to 0% in the upper release region. Fig. 5 shows a comparison between the experimental and CDF results for the ethanol evaporation rate (kg/sec) at 4, 8, and 12 hr after the start of volatilization. The experimental and calculated evaporation rates were in good agreement, confirming the validity of the calculations.

To validate the accuracy of pharmacokinetic analysis considering transdermal absorption by liquid adhesion, Jongeneelen and Berge (2011) compared the experimental data of Kramer et al. (2007) with the calculated values in the previous version (version 1.0) of “IndusChemFate”, and the validity of the calculations was confirmed. In this study, a new version of “IndusChemFate” (Version 2.0) was used, and the same comparison was made with the experimental data of Kramer et al. (2007). In the study reported by Kramer et al. (2007), 20 mL of 85% ethanol solution was applied to the skin of the hands and arms (2000 cm2) of 12 volunteers for 3 min, followed by a 5 min rest, which was repeated 10 times (total 80 min). Blood samples were taken before and 7 times after exposure (85, 90, 100, 110, 140, and 170 min after the start of the experiment) to measure blood ethanol concentrations. A comparison of the measured values (average of 12 people) with the calculated values of “IndusChemFate” (Version 2.0) is shown in Fig. 6. The peak blood concentration agreed with the experimental value of 380 μmol/L and the calculated value of 395 μmol/L, confirming the validity of the calculation using “IndusChemFate” (Version 2.0).

To confirm the application of the methodology developed in this study, an evaluation of the hazards to workers handling an accident was conducted assuming a liquid ethanol leak from a tank. The analysis considered the exposure of workers to the leaked ethanol liquid and the gas volatilized from the pool. A 100 m wide x 100 m long x 75 m high cube including the cylindrical ethanol tank where the leak occurred and the surrounding buildings was used as the analysis target, and a 3D geometry for CFD was created. Fig. 2 shows the area of the ethanol liquid leak, location of workers, and wind speed conditions for the scenario analyzed.
Ethanol liquid leaked into an area of 142 m2 between a cylindrical tank and an adjacent building, creating a liquid pool. Analysis was performed assuming the volatilization of ethanol from the liquid surface of the liquid pool to a saturated concentration (11.4%) of ethanol under normal temperature and pressure conditions (temperature: 25°C, pressure: 1013 hPa). Wind velocity was assumed to be 0.1 m/sec (wind force 0: calm), and changes in the volatile gas concentration distribution due to diffusion to the surroundings were calculated. The physical properties of the gases used in CFD are shown in Table 2. Fig. 7 shows the results of CFD calculations for ethanol concentrations of 100 ppm (blue) and 1000 ppm (red) at 300 sec and 2000 sec after the start of the leak, respectively. The ethanol gas generated by volatilization diffused downwind by the wind, and the area of high concentration changed over time.

Fig. 8 shows the calculated time variation of ethanol gas concentration at the work position (1 m above ground level). In CFD, the concentration is usually calculated in ppm, but unit conversion (mg/m3) is used for input to the PBPK model. After the leak, the ethanol gas concentration at the work position (1 m above ground level) reached almost 4800 mg/m3 in 400 sec due to volatilization from the liquid surface, and the exposure concentration at this point was maintained subsequently.

The risk assessment scenario assumed that a worker arrives at the treatment work area (work position in Fig. 2) 400 sec after an ethanol leak and stayed there for 1600 sec until 2000 sec after the leak. After 1600 sec of work, the worker evacuated to a safe place where there was no ethanol concentration in the air, washed the exposed ethanol, and changed their clothes. Simulations were performed assuming that gas exposure and liquid adhesion started instantaneously at the start of work and ended instantaneously after the work, and did not take into account exposure during pre- and post-work movements. The PBPK modeling software IndusChemFate (Version 2.0) used in this study cannot consider temporal changes in exposure concentrations, only constant concentrations can be specified. Therefore, in this study, the average concentration during 1600 sec of the worker's exposure time in the above scenario was obtained from the ethanol concentration calculation results in the work position shown in Fig. 8 and used as the exposure concentration in the PBPK model. Table 3 shows the average concentration (ppm) calculated by CFD and the value converted to mg/m3 for input into the PBPK model. The unit system of concentration is shown for the results of CFD (ppm) and for the input of the PBPK model (mg/m3).
Table 3. Exposure concentrations of toxic gas. The unit system of concentration is shown for the results of CFD (ppm) and for the input of the PBPK model (mg/m
3).

To evaluate the effects on workers of toxic liquid adhesion and toxic gas exposure generated by volatilization, the PBPK model “IndusChemFate” (Version 2.0) was used to calculate changes over time in blood concentrations of ethanol and its metabolites in the body.“IndusChemFate” (Version 2.0) has a built-in database of physiological and anatomical parameters of 10 types of human body data related to the gender, body shape, age, and physical activity of the subject being evaluated. In this study, as in previous report (Horiguchi and Numazawa, 2023), we used values from the database incorporated in “IndusChemFate” (Version 2.0). Table S2 and S3 shows a list of the values used in this study.
In this study, (male, standard body type, at rest) was selected as the standard worker for the analysis (Table S2). For ethanol metabolism, the following metabolic pathways were analyzed.
Primary metabolism Secondary metabolism
CH3 CH2 OH → CH3 CHO → CH3 COOH
“IndusChemFate” (Version 2.0) contains a built-in database of basic physical properties and pharmacokinetic parameters such as metabolism data. Table S1 shows the physical properties of ethanol and its metabolites automatically obtained from the database.
The pharmacokinetic parameter Vmax in IndusChemFate is expressed in μmol/kg tissue/hr. From the commonly reported values determined in vitro, scaling to in vivo hepatic drug clearance values should be performed using a factor of 0.04 mg/kg (assuming microsomal fraction of liver tissue = approximately 4% and average human liver weight = 2 kg). In an analysis that considers liquid adhesion, it is necessary to calculate the body surface area based on the area exposed to the toxic liquid. Table 4 shows the body surface area of each site for Japanese males as measured by Kurazumi et al. (1994).
Table 4. Body surface area of each region for a Japanese male. Average of 34 young men of standard build (
Kurazumi et al., 1994).
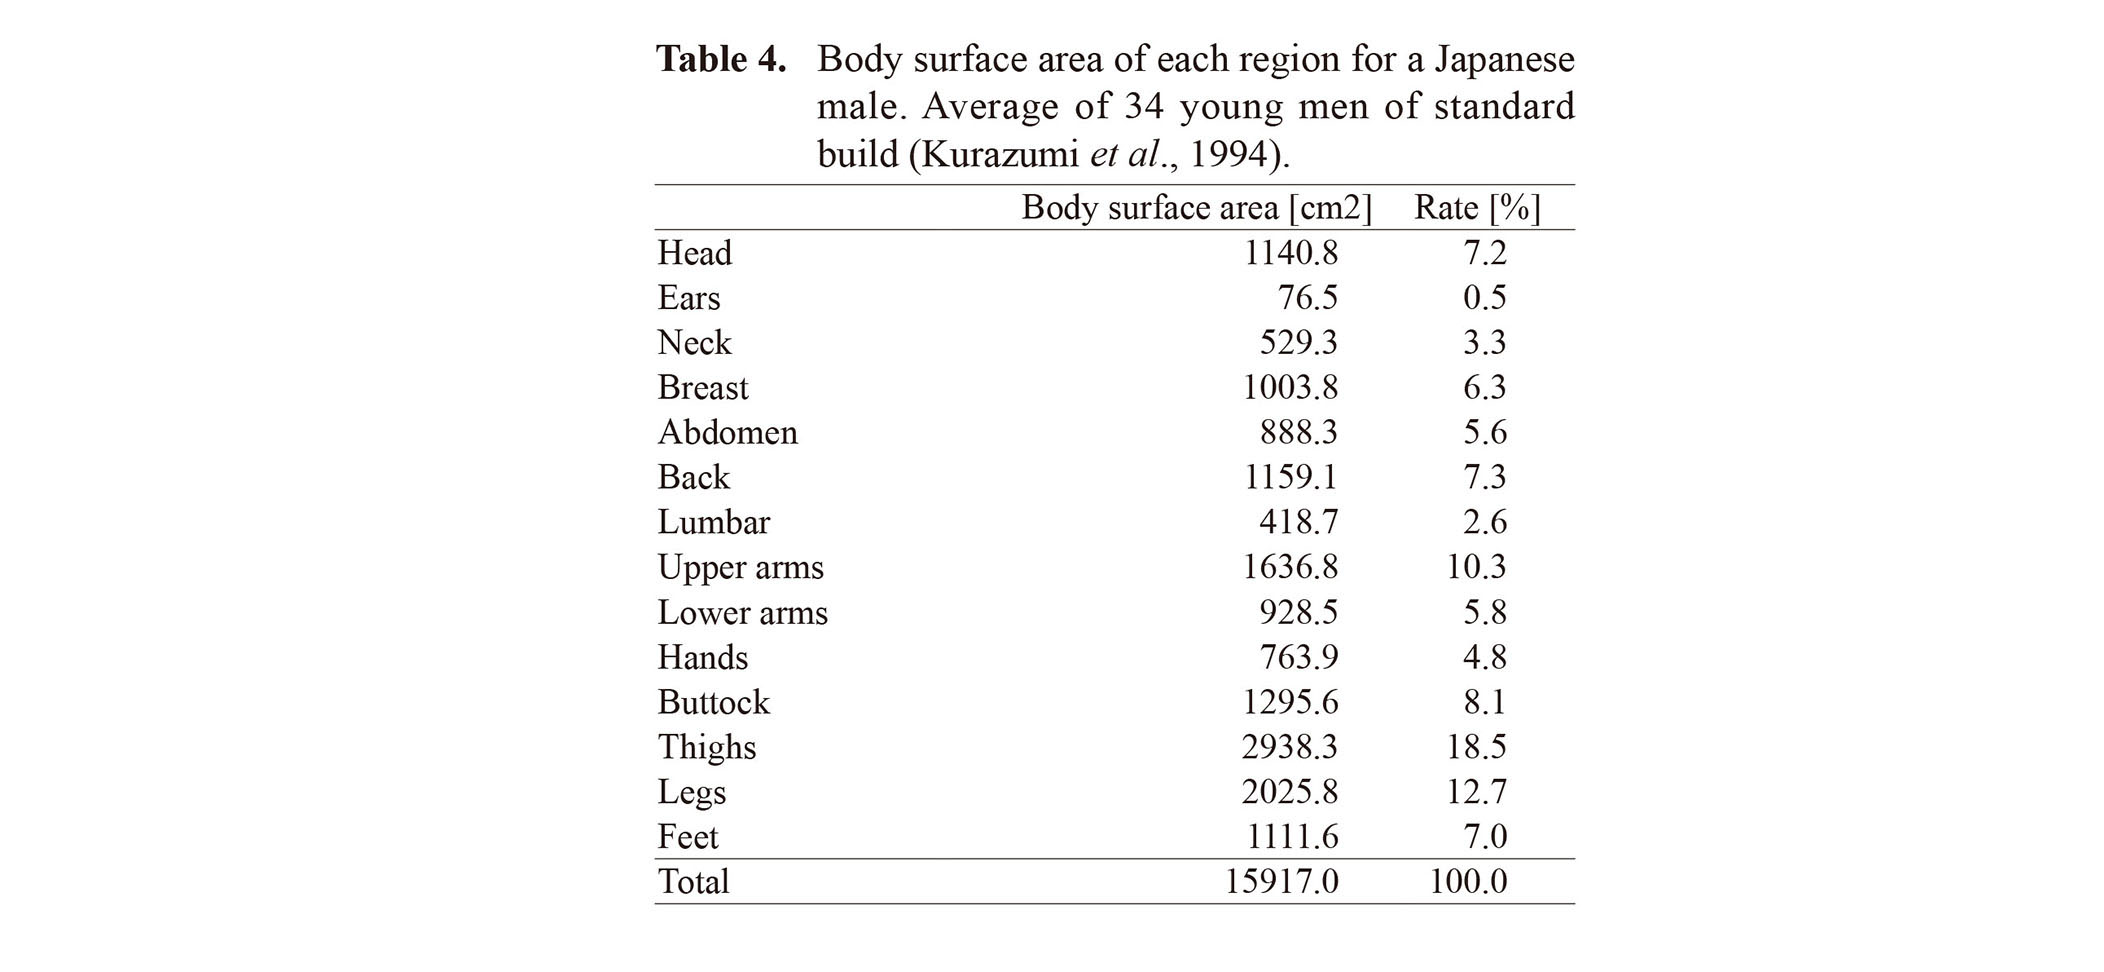
In this study, we simulated three cases related to the area covered with liquid: no liquid, liquid on one arm, and liquid on the lower half of the body. From the value of Table 4, the surface area of one arm is 1664.6 cm2, which is half that of the hands + upper arms + lower arms. For the lower body, the calculation was performed using the values buttock + thighs + legs + feet 7371.3 cm2.
The calculated blood concentrations of ethanol for the three cases of gas exposure (inhalation and transdermal absorption) and no liquid exposure; gas exposure and liquid exposure: one hand; gas exposure and liquid exposure: lower body, for 1600 sec of work and then up to 8 sec afterwards are shown in Fig. 9. The ethanol blood concentration in the worker's body increased with the onset of exposure, with a peak value of 1640 μmol/L after 1600 sec in the lower body liquid adhesion condition, where the liquid adhesion area was larger. In the case of one-handed liquid adhesion, the peak value was 1130 μmol/L, and in the case of gas exposure only, the peak value was 981 μmol/L.
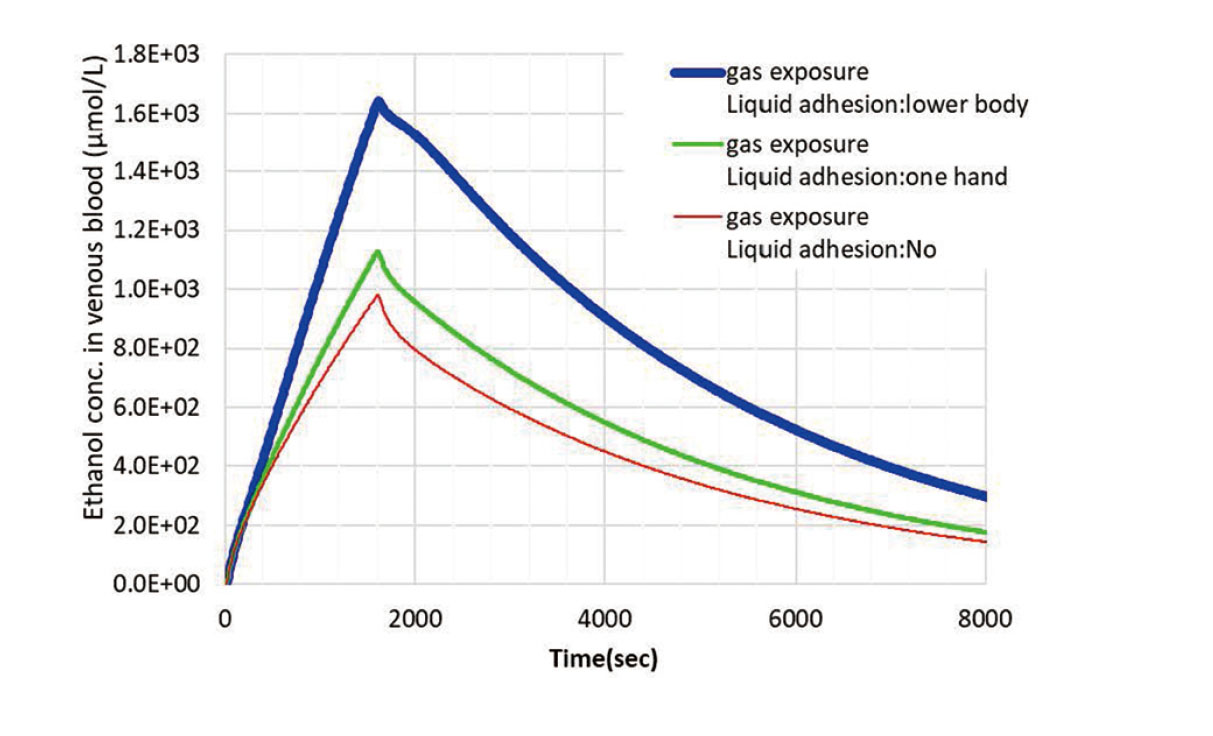
The acute toxic effects of ethanol on blood concentrations have been well studied (Vonghia et al., 2008). When blood ethanol concentrations exceed 10,900 µmol/L, acute toxic effects become apparent, such as increased talkativeness and decreased ability to perform cognitive and agility tasks. The highest blood ethanol concentration in the three cases in Fig. 9 was found for "Gas exposure and exposure: lower body" with a peak value of 1640 µmol/L, which was less than half the blood concentration of 10,900 µmol/L during the exhilaration period. Therefore, it can be confirmed that the effect of ethanol on the human body under the conditions of the present scenario is low and that the work can be performed safely.
DISCUSSION
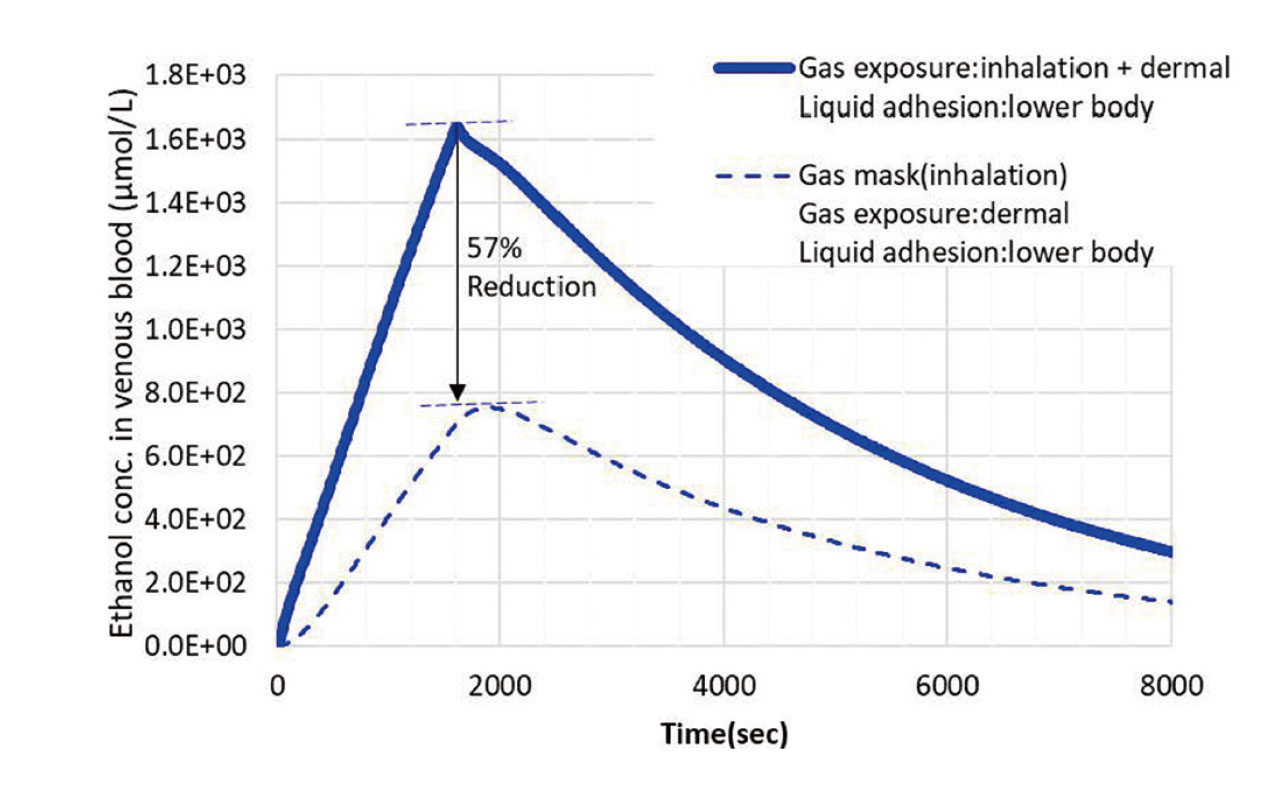
The PBPK tool used in this study, IndusChemFate (Version 2.0), can independently consider the absorption of hazardous substances through different routes, such as inhalation and dermal absorption. Using this analysis function, it is possible to separately evaluate the effectiveness of gas masks for inhalation and protective clothing for dermal absorption as protective equipment. To evaluate the effectiveness of gas masks, calculations were made for gas exposure and lower body exposure with and without gas masks. The analysis was conducted assuming that wearing a gas mask reduces the concentration of inhaled gases to 1/100.
As shown in Fig. 10, the peak blood concentration of ethanol was reduced by 57% when wearing a gas mask. These results suggest that evaluating the effectiveness of each protective equipment separately will allow for the selection of appropriate protective equipment and allowable working hours when working in toxic exposure environments.
The CFD and PBPK models were combined to evaluate the hazards to workers after a liquid ethanol leakage using blood concentrations of toxic substances. R-FLOW and “IndusChemFate” were used as general-purpose tools. These methods can be applied to any toxic gas if the physical properties and pharmacokinetic parameters are available, and it is relatively easy for anyone to apply it for the safety assessment of various chemicals during manufacturing, storage, and use. The results show that this method can be applied to gaseous leaks as well as liquid leaks.
By combining CFD and PBPK models, we developed a new risk assessment method to evaluate the risk of liquid leakage of toxic substances by analyzing changes in the blood concentration in the body and assessing the effects on the human body by blood concentration, rather than by exposure concentration thresholds as in the past. By using this method, various scenarios can be assessed, such as leakage conditions, weather, human movements, and the presence or absence of exposure to liquid, it is expected to enable the development and planning of safe and economically effective countermeasures, both in terms of hardware, such as alarm systems, and of the software, such as evacuation plans, without excesses or deficiencies.
Although the available metabolic rate parameters for toxicants in the PBPK model, which are important for this method, are currently limited, future enhancements are expected. This study uses two simulation software in completely different fields, fluid analysis and pharmacokinetic analysis. Currently, the two software packages use different unit systems for input and output data, which makes them difficult to use, and there is a lack of human resources who can handle the two software packages. Future human resource development and software development are expected.
Conflict of interest
The authors declare that there is no conflict of interest.
REFERENCES
- Bash, O., Liu, Y., Castier, M., Olewski, T., Vechot, L. and Sam Mannan, S. (2013): Modelling of LNG pool spreading on land with included vapour-liquid equilibrium and different boiling regimes. Chem. Eng. Trans., 31, 43-48.
- Bellegoni, M., Ovidi, F., Landucci, G., Tognotti, L. and Galletti, C. (2021): CFD analysis of the influence of a perimeter wall on the natural gas dispersion from an LNG pool. Process Saf. Environ. Prot., 148, 751-764.
- Bos, P.M., Ruijten, M.W., Gundert-Remy, U., Bull, S., Nielsen, E., Tissot, S.M., Wood, M.H., Cassel, G., Russel, D., Leffler, P., Zitting, A., Mahieu, K., Persson, L. and Vincent, J.M. (2010): Human risk assessment of single exposure in chemical incidents. National Institute for Public Health and the Environment. https://www.rivm.nl/bibliotheek/rapporten/320300001.pdf
- Cui, Y. and Wu, B. (2016): Chemical tank leakage risk assessment based on set pair analysis and LabVIEW. Open Fuels Energy Sci. J., 2016, 102-113.
- Department for Business Innovation & Skills UK. (2013): Review of enforcement in the chemicals industry (COMAH). Available at: https://assets.publishing.service.gov.uk/government/uploads/system/uploads/attachment_data/file/77153/bis-13-557-review-of-enforcement-in-chemicals-industry-comah.pdf
- Fernandez, M.B., Harper, M., Mahgerefteh, H. and Witlox, H.W. (2012): An integral model for pool spreading, vaporization and dissolution of hydrocarbon mixtures. IChemE, Hazards XXIII, Paper61, 466-472. https://www.icheme.org/media/9058/xxiii-paper-61.pdf
- Gopalaswami, N., Kakosimos, K., Zhang, B., Liu, Y., Mentzer, R. and Mannan, M.S. (2017): Experimental and numerical study of liquefied natural gas (LNG) pool spreading and vaporization on water. J. Hazard. Mater., 334, 244-255.
- He, L., Hang, J., Wang, X., Lin, B., Li, X. and Lan, G. (2017): Numerical investigations of flow and passive pollutant exposure in high-rise deep street canyons with various street aspect ratios and viaduct settings. Sci. Total Environ., 584-585, 189-206.
- Horiguchi, A. and Numazawa, S. (2023): Simulation-based risk assessment for the leakage of toxic substances in a chemical plant and the effects on the human body: ethanol as a working model. J. Toxicol. Sci., 48, 285-298.
- IndusChemFate. http://cefic-lri.org/toolbox/induschemfate/
- Ito, K. (2000): Numerical modeling of the volatile contaminant behavior in unsaturated and saturated zones. Oyo Tech. Rep., 20, 113-130.
- I, Y.P. and Cheng, T.L. (2008): The development of a 3D risk analysis method. J Hazard Mater., 153, 600-608.
- Jongeneelen, F.J. and Berge, W.F. (2011): A generic, cross-chemical predictive PBTK model with multiple entry routes running as application in MS Excel; design of the model and comparison of predictions with experimental results. Ann. Occup. Hyg., 55, 841-864.
- Kefalas, D.A., Christolis, M.N., Nivolianitou, Z. and Markatos, N.C. (2006): Consequence analysis of an open fire incident in a pesticide storage plant. J. Loss. Prevent. Proc., 19, 78-88.
- Kramer, A., Below, H., Bieber, N., Kampf, G., Toma, C.D., Huebner, N.O. and Assadian, O. (2007): Quantity of ethanol absorption after excessive hand disinfection using three commercially available hand rubs is minimal and below toxic levels for humans. BMC Infect. Dis., 7, 117.
- Kurazumi, Y., Horikoshi, T., Tsuchikawa, T. and Matsubara, N. (1994): Study on body surface area of Japanese. Jpn.J.Biometeor., 31, 5-29.
- Lim, H., Um, K. and Jung, S. (2017): A study on effective mitigation system for accidental toxic gas releases. J. Loss Prev. Process Ind., 49, 636-644.
- Liu, L.F., Ni, L., Jiang, J.E., Mebarki, A. and Zhang, W.X. (2018): Consequence analysis of derivative accidents due to reaction runaway. J. Loss Prev. Process Ind., 55, 471-479.
- Mizuta, Y., Sumino, M., Kunito, Y., Shiota, K., Izato, Y. and Miyake, A. (2020): Emergency evacuation model assuming leakage of toxic substances in a chemical plant. J. Loss. Prevent. Proc., 68, 104287.
- Nagaosa, R.S. (2014): A new numerical formulation of gas leakage and spread into a residential space in terms of hazard analysis. J. Hazard. Mater., 271, 266-274.
- Pandya, N., Marsden, E., Floquet, P. and Gabas, N. (2008): Toxic release dispersion modelling with PHAST: parametric sensitivity analysis. In: CISAP - 3rd International Conference on Safety & Environment in the Process Industry. https://oatao.univ-toulouse.fr/487/
- Qi, R., Ng, D., Cormier, B.R. and Mannan, M.S. (2010): Numerical simulations of LNG vapor dispersion in Brayton Fire Training Field tests with ANSYS CFX. J. Hazard. Mater., 183, 51-61.
- R-flow Co. Saitama, Japan. http://www.rflow.co.jp/product.html#RFLOW
- Vonghia, L., Leggio, L., Ferrulli, A., Bertini, M., Gasbarrini, G. and Addolorato, G.; Alcoholism Treatment Study Group. (2008): Acute alcohol intoxication. Eur. J. Intern. Med., 19, 561-567.
- Wood, M., Pichard, A., Gundert-Remy, U., de Rooij, C. and Tissot, S.M. (2006): The AETL methodology as a potential solution to current challenges associated with the development and use of acute exposure levels in Seveso II applications. J. Hazard. Mater., 133, 8-15.
;%0A%09%09%09newWindow.document.open();%0A%09%09%09newWindow.document.write('<img src=%22./Graphics/49_37-t1.jpg%22>');%0A%09%09%09newWindow.document.close();%0A%09%09)
;%0A%09%09%09newWindow.document.open();%0A%09%09%09newWindow.document.write('<img src=%22./Graphics/49_37-t2.jpg%22>');%0A%09%09%09newWindow.document.close();%0A%09%09)


;%0A%09%09%09newWindow.document.open();%0A%09%09%09newWindow.document.write('<img src=%22./Graphics/49_37-t3.jpg%22>');%0A%09%09%09newWindow.document.close();%0A%09%09)
;%0A%09%09%09newWindow.document.open();%0A%09%09%09newWindow.document.write('<img src=%22./Graphics/49_37-t4.jpg%22>');%0A%09%09%09newWindow.document.close();%0A%09%09)