Abstract
The octanol/water partition coefficient, P (logP), is a hydrophobicity index and is one of the determining factors of the pharmacokinetics of chemical compounds. LogP values obtained from in silico software, open chemistry databases, and in vitro liquid chromatography retention factors may vary. Some chemicals (boscalid, etoxazole, and permethrin) have up to four-order-magnitude differences in in silico/in vitro P values. This study aimed to evaluate the effects of logP values of these three compounds, along with bisphenol A, 1,2-dibromobenzene, tetrabromobisphenol A, trazodone, and triazolam, on the input parameters and output plasma/hepatic concentration–time profiles of simple physiologically based pharmacokinetic (PBPK) models. Although the blood-to-plasma concentration ratios (~0.9–0.6) were slightly affected by variations in logP values, logarithmic plasma unbound fraction values and liver-to-plasma partition coefficients (Kp,h) were, respectively, inversely and linearly correlated with logP values (Kp,h was stable at ~6.7 for logP > 4). LogP was among the input parameters for previously established machine learning systems; consequently, the resulting logarithmic intrinsic clearance values were correlated with logP values in the range 2–8. However, the bioavailability, absorption rate constants, and volumes of distribution were not affected. PBPK-modeled plasma and hepatic maximum concentrations and areas under the concentration–time curves after virtual oral doses were mostly within ~0.5- to ~2-fold ranges, except for substances with low in vitro logP values, e.g., etoxazole and permethrin. These results suggest that in silico logP values are generally suitable for pharmacokinetic modeling; nevertheless, caution is needed for compounds with low in vitro logP values of ~2.
INTRODUCTION
The quantitative evaluation of in vivo exposure to chemical substances is essential for appropriate risk management. However, toxicokinetic data are limited for many chemical substances. To overcome this limitation, physiologically based pharmacokinetic (PBPK) models, which simulate absorption, distribution, metabolism, and excretion processes based on physiological parameters, are widely used to predict the toxicokinetics and pharmacokinetics of chemicals in humans and animals (Jamei et al., 2009; Paini et al., 2019; Shebley et al., 2018; Zhao et al., 2011).
One of the key physicochemical properties that in part determines the predictive accuracy of this PBPK system is the octanol/water partition coefficient P (logP), which indicates the hydrophobicity of a chemical substance. LogP or the pH-dependent distribution coefficient D (logD) can be used to evaluate the toxicity and pharmacokinetics of orally administered substances because they affect both intestinal membrane permeability and organ transferability (Kamiya et al., 2021b). For example, the liver-to-plasma partition coefficient (Kp,h), which is essential for evaluating hepatic toxicity, is influenced by the logP value (Adachi et al., 2024; Li and Jusko, 2022; Poulin and Theil, 2002; Rodgers et al., 2005). However, when calculating logP values using software such as ChemDraw or ACD/Lab Percepta, the calculation algorithms are not identical, leading to potential differences in values depending on the software package used (Mannhold et al., 2009). The shake-flask method is the most accurate experimental technique for measuring logP (OECD, 1995); however, it is cumbersome. PubChem is an open chemistry database of the National Institutes of Health (NIH) that lists logP values as log Kow values under the logP section. As an alternative experimental technique, high-performance liquid chromatography (HPLC) allows for easier calculation of logP, although it is less accurate than the shake-flask method (OECD, 2022). Our recent report has shown discrepancies for some substances (a fungicide boscalid, an acaricide etoxazole and, an insecticide permethrin; Fig. 1) between in silico logP values calculated using software and experimental logP values determined by HPLC (Adachi et al., 2024). However, it remains unclear how variation in estimated chemical logP values affects the calculated internal exposure or toxicokinetic predictions of the simplified PBPK model.

We previously utilized physicochemical properties based on ChemDraw-derived logP values and pharmacokinetic parameters obtained from in vitro and in vivo experimental data and literature sources to reproduce the concentration profiles of chemicals in the plasma and liver using a simplified PBPK model (Adachi et al., 2022b; Adachi et al., 2022a; Kamiya et al., 2022a; Kamiya et al., 2022b; Kamiya et al., 2020; Adachi et al., 2023b; Adachi et al., 2023c). Additionally, using the published time-course data of plasma concentrations after oral administration of approximately 350 general chemical substances that we have collected so far as a training set, we developed a LightGBM-based machine learning model to predict pharmacokinetic parameters in humans and rats (Adachi et al., 2022b; Adachi et al., 2022a; Kamiya et al., 2022a; Kamiya et al., 2022b). This model predicts the four pharmacokinetic parameters required as input parameters for our PBPK model with physicochemical properties originally based on ChemDraw-derived logP values: the product of intestinal permeability and bioavailability (FaFg), the absorption rate constant (ka), the volume of distribution (V1), and the intrinsic clearance (CLh,int). Notably, the LightGBM-based machine learning model can predict these parameters using physicochemical descriptors derived from simplified molecular input line entry system (SMILES) representations of chemical compounds, even in the absence of in vivo data. This system enables the prediction of plasma and liver concentration profiles for general chemical substances that lack reference toxicokinetic data, providing a valuable tool for risk assessment and regulatory decision making (Adachi et al., 2023a).
In the current study, the impact was evaluated of variations in logP on various pharmacokinetic parameters and PBPK-modeled plasma concentration–time profiles. Five additional compounds were selected, including boscalid, etoxazole, and permethrin (Fig. 1), for which the experimentally determined logP values reported using HPLC and the in silico logP values calculated using ChemDraw and ACD/Percepta indicated that P values differed by factors of 1 to 10,000 (Adachi et al., 2024). The compounds with in silico P value differences from the experimental value exceeding 100-fold were boscalid, etoxazole, and permethrin, whereas those with variability from the experimental value were three industrial chemicals (bisphenol A, 1,2-dibromobenzene, and tetrabromobisphenol A) and two pharmaceuticals (trazodone and triazolam). Herein, we report that in silico logP values are generally well suited to pharmacokinetic modeling; however, some caution may be needed for compounds with low in vitro logP values of ~2.
MATERIALS AND METHODS
Physicochemical parameters
The logP values for the eight chemicals analyzed in this study were obtained by in silico estimation using ChemDraw (PerkinElmer, Waltham, PA, USA) and ACD/Percepta (Advanced Chemistry Development, Toronto, ON, Canada) and from an open chemistry database (PubChem, National Institutes of Health, NIH, USA). LogP values were also derived from in vitro retention factors experimentally determined by liquid chromatography, as described previously (Adachi et al., 2024). The acid dissociation constants were estimated using ACD/Percepta software. Correlations between the differently derived pharmacokinetic parameters were evaluated using Prism 10 (GraphPad Software, La Jolla, CA, USA).
Four sets of fu,p values of the eight compounds were estimated using Simcyp (Certara UK, Sheffield, UK) based on the four sets of logP values. Blood-to-plasma concentration ratios (Rb) of these compounds were calculated from the four sets fu,p values, as follows:

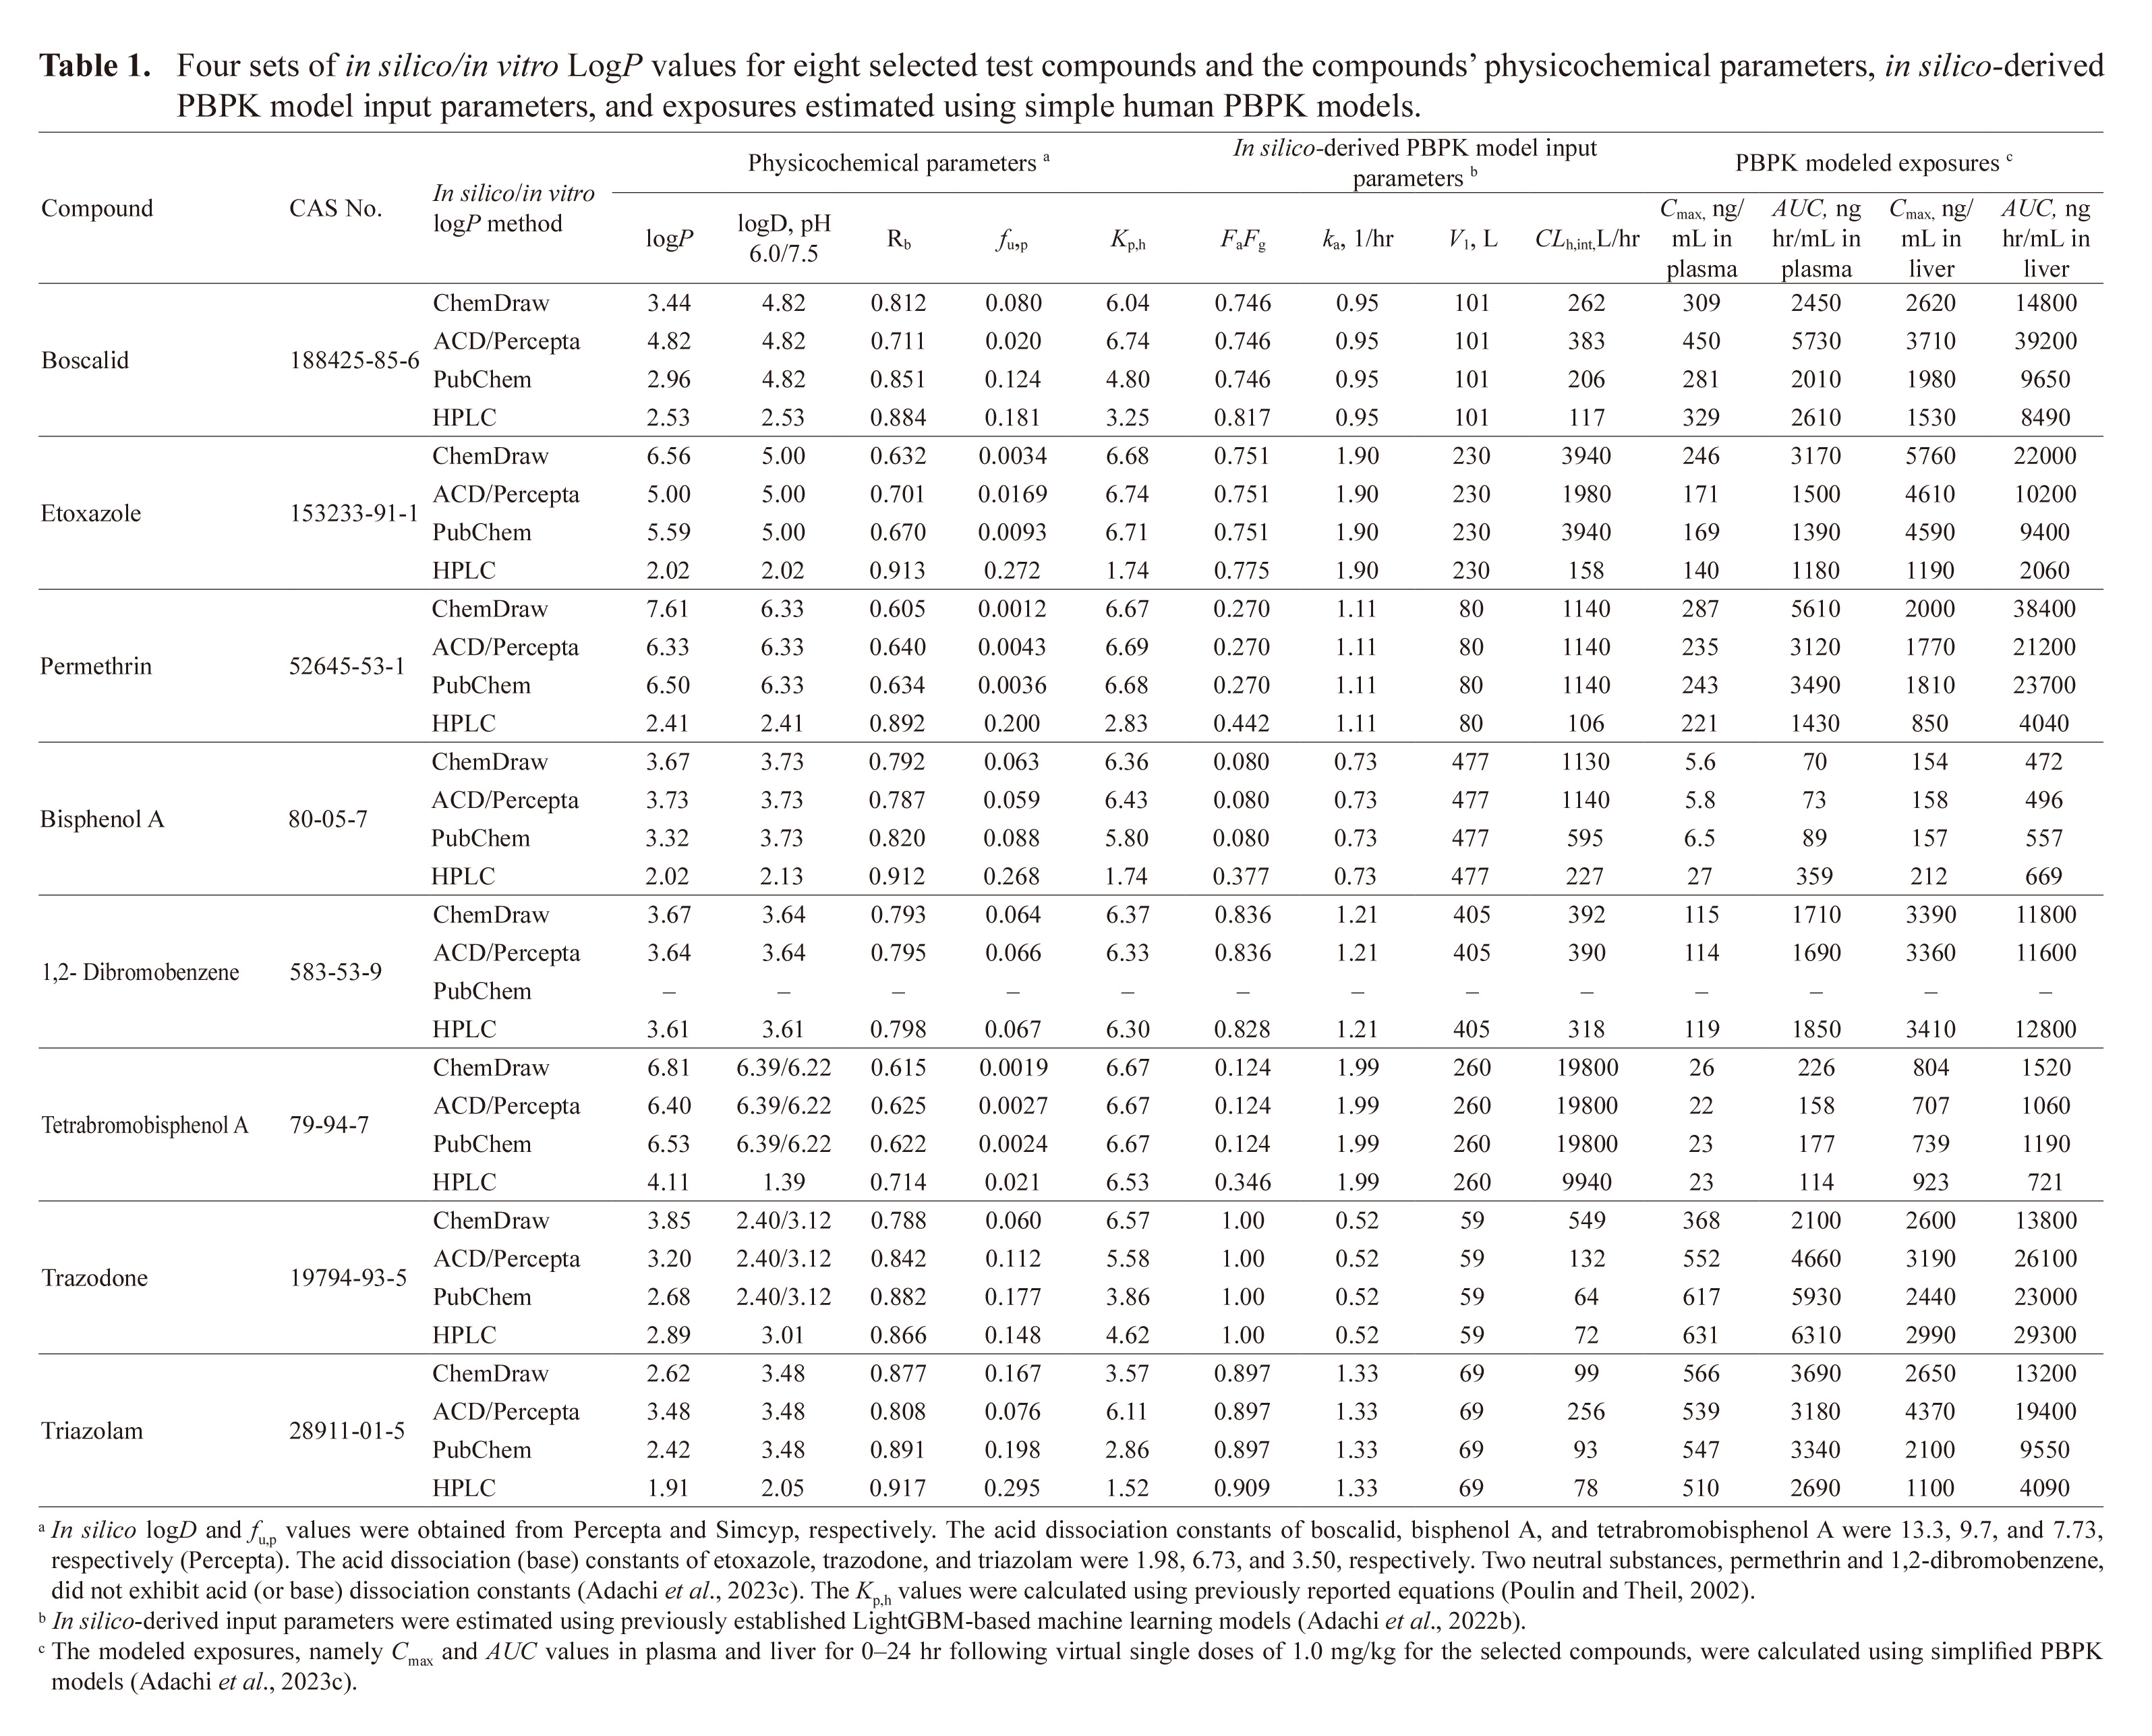
The liver to plasma concentration ratios (Kp,h) were calculated using the mathematical formula proposed by Poulin and Theil (Adachi et al., 2023d; Poulin and Theil, 2002). The four sets of physicochemical properties of the selected compounds are listed in Table 1, apart from the logP value for 1,2-dibromobenzene, which was missing from the PubChem database.
Table 1. Four sets of
in silico/in vitro Log
P values for eight selected test compounds and the compounds’ physicochemical parameters,
in silico-derived PBPK model input parameters, and exposures estimated using simple human PBPK models.
In silico-derived input parameters and virtual output exposures
The input parameters for our simplified human PBPK models, which incorporate chemical receptor (gut), metabolizing (liver), excreting (kidney), and central (main) compartments (Adachi et al., 2023c), were calculated using previously established LightGBM-based machine learning systems that utilize in silico chemical descriptors (Kamiya et al., 2022a; Kamiya et al., 2022b; Kamiya et al., 2021a), as shown in Table 1. Kidney-to-plasma concentration ratios (Kp,r) were set to the same values as Kp,h, as previously reported (Kamiya et al., 2022a). The liver and kidney volumes in humans (70 kg body weight) were 1.5 L and 0.28 L, respectively, and the liver and kidney blood flow rates (Qh/Qr) were both 96.6 L/hr (Kamiya et al., 2022a). A set of differential equations representing the simplified PBPK models (Kamiya et al., 2022b; Kamiya et al., 2021a) was solved to derive the plasma and hepatic maximum plasma concentrations (Cmax) and the areas under the concentration–time curves (AUC) from 0 to 24 hr after single virtual 1.0 mg/kg doses of the eight selected substances, because the current simple PBPK systems are linear models.
RESULTS
The logP values derived using the four different methods were primarily employed to estimate the physicochemical properties and Rb, fu,p, and Kp,h values of the eight model compounds selected in this study (Table 1). The pharmacokinetic values required as input parameters for human PBPK models were estimated based on the compounds’ chemical structures and the indicated logP and logD values (Table 1). Plasma and liver Cmax and AUC values of the eight compounds were modeled after virtual oral doses of 1.0 mg/kg. For these compounds, the effects of variations in logP values on the physicochemical properties, the pharmacokinetic parameters used as inputs for the PBPK models, and the virtual modeled exposures were evaluated and the relationships between these estimations and logP values were illustrated.
The relationships between Rb, fu,p, and Kp,h values and logP values derived using the four different methods are illustrated in Fig. 2. The blood-to-plasma concentration ratios (~0.9–0.6) of the eight substances were only slightly affected by the logP values (Fig. 2A), whereas the logarithmic plasma unbound fraction values were inversely correlated with logP values in the range 2–8 (Fig. 2B). The liver-to-plasma partition coefficients (Kp,h) of the selected substrates increased linearly with logP in the range 2–4, whereas, for logP values greater than 4, the Kp,h values were stable (at ~6.7) (Fig. 2C). The Rb, fu,p, and Kp,h values derived from the ChemDraw logP values were used as the reference (with a ratio of 1) to normalize the Rb, fu,p, and Kp,h values obtained from the other three sets of logP values. This was done to investigate the sensitivity of these parameters to the variability resulting from the different methods for obtaining logP (Fig. 2D-F). The normalized Rb and fu,p values of the individual compounds exhibited an almost linear relationship with their logP values (Figs. 2D, 2E). In contrast, the apparent linear relationship between Kp,h and logP values became saturated at logP values greater than 4 (Fig. 2F).

Among the PBPK model input parameters derived using previously established machine learning systems, logarithmic intrinsic clearance values were correlated with logP values in the range 2–8, as illustrated in Fig. 3, which shows the nonlinear regression curve (CLh,int = 10(0.54 × logP + 0.12), n = 31, r = 0.81, p < 0.01) and 95% confidence intervals derived from plots from all eight compounds. Partly because CLh,int values are dependent on logP as a computational descriptor, the estimated CLh,int values under the present conditions varied from a minimum of ~20% to a maximum of 150% compared with logP values from ChemDraw (Table 1). In contrast, the bioavailability, absorption rate constants, and volumes of distribution were not affected by variability in logP values, as shown in Table 1.

Figure 4 shows normalized Cmax and AUC values in plasma and liver calculated using Cmax and AUC values based on ChemDraw logP values as the reference (with a ratio of 1). Most of virtual output for plasma and hepatic maximum concentrations and areas under the concentration–time curves after oral doses (1.0 mg/kg) were within an approximately twofold range of the reference value; the exceptions were mainly substances with low in vitro logP values, i.e., bisphenol A, etoxazole and permethrin. There was a tendency for increased plasma and liver AUC values with logP. Variations in the normalized values ranged from 69% to 167% for plasma Cmax, 44% to 280% for plasma AUC, 75% to 164% for liver Cmax, and 43% to 260% for liver AUC.
DISCUSSION
In this study, first, the impact of logP values on the physicochemical properties Rb, fu,p, and Kp,h, calculated using established general formulas, was examined (Fig. 2). For fu,p and Kp,h values, variations in logP values had a major impact when logP values were less than 4. In particular, as logP increased above 4, the Kp,h value, which determines membrane permeation, i.e., hepatic uptake, reached a plateau. In contrast, Rb was not greatly affected by variation in logP. Second, the impact of logP on CLh,int was assessed, as estimated using machine learning models that utilize logP as one of many input parameters (Fig. 3). Finally, the combined influences of these factors on the Cmax and AUC values generated using the PBPK model were investigated (Fig. 4). The membrane permeation and hepatic clearance can interact during the calculation of Cmax and AUC, suggesting that with some exceptions, variations in Cmax and AUC generally fall within the 0.5- to 2-fold range.
For accurate determination, in vitro logP values were estimated from the retention factor of compounds in their fully molecular form, which are different from their ionic forms (OECD, 2022). We successfully determined the logP values of 120 chemicals estimated using four different mobile phase conditions (i.e., pH 2, 4, 7, and 10 for molecular forms), and these logP values correlated significantly with those calculated using the in silico packages ChemDraw and ACD/Percepta (r > 0.72) (Adachi et al., 2024). Although the logP values estimated experimentally and in silico were precisely correlated for substances that neighbored authentic reference compounds in the chemical space, some compounds that were more distant (i.e., differed in chemical structure) from the reference substances had lower logP values than those estimated in silico. Consequently, logD values derived from in vitro methods should be evaluated appropriately.
In conclusions, logP values are important determinants of the pharmacokinetics of chemicals in general. For the eight model substances analyzed, the PBPK-modeled plasma and hepatic maximum concentrations and areas under the concentration–time curves after virtual oral doses (1.0 mg/kg) were within approximately 0.5- to 2-fold ranges for all four methods of obtaining logP: the exceptions were substances with low in vitro logP values, e.g., etoxazole and permethrin. These results suggest that the in silico logP values of general chemicals obtained using simple and reliable estimation methods are generally suitable for use in pharmacokinetic modeling.
ACKNOWLEDGMENTS
This study was supported in part by the Japan Chemical Industry Association Long-Range Research Initiative Program and Japan Society for the Promotion of Science Grant-in-Aid for Scientific Research (23K14393). We thank Certara UK (Simcyp Division) for providing academic access to simulators. The authors thank Manato Hosoi, Hina Nakano, Norie Murayama, and Masato Kitajima for their assistance. We are also grateful to David Smallbones for copyediting a draft of this article.
Conflict of interest
The authors declare that there is no conflict of interest.
REFERENCES
- Adachi, K., Nakano, H., Sato, T., Shimizu, M. and Yamazaki, H. (2023a): Liver and Plasma Concentrations of Food Chemicals after Virtual Oral Doses Extrapolated Using in Silico Estimated Input Pharmacokinetic Parameters to Confirm Reported Liver Toxicity in Rats. Biol. Pharm. Bull., 46, 1133-1140.
- Adachi, K., Ohyama, K., Tanaka, Y., Nakano, H., Sato, T., Murayama, N., Shimizu, M., Saito, Y. and Yamazaki, H. (2023b): Plasma and Hepatic Exposures of Celecoxib and Diclofenac Prescribed Alone in Patients with Cytochrome P450 2C9*3 Modeled after Virtual Oral Administrations and Likely Associated with Adverse Drug Events Reported in a Japanese Database. Biol. Pharm. Bull., 46, 856-863.
- Adachi, K., Ohyama, K., Tanaka, Y., Sato, T., Murayama, N., Shimizu, M., Saito, Y. and Yamazaki, H. (2023c): High hepatic and plasma exposures of atorvastatin in subjects harboring impaired cytochrome P450 3A4*16 modeled after virtual administrations and possibly associated with statin intolerance found in the Japanese adverse drug event report database. Drug Metab. Pharmacokinet., 49, 100486.
- Adachi, K., Shimizu, M., Shono, F., Funatsu, K. and Yamazaki, H. (2024): Octanol/water partition coefficients estimated using retention times in reverse-phase liquid chromatography and calculated in silico as one of the determinant factors for pharmacokinetic parameter estimations of general chemical substances. J. Toxicol. Sci., 49, 127-137.
- Adachi, K., Shimizu, M. and Yamazaki, H. (2022a): Updated in silico prediction methods for fractions absorbed and absorption rate constants of 372 disparate chemicals for use in physiologically based pharmacokinetic models for estimating internal concentrations in rats. J. Toxicol. Sci., 47, 453-456.
- Adachi, K., Shimizu, M. and Yamazaki, H. (2022b): Updated in Silico Prediction Methods for Fractions Absorbed and Key Input Parameters of 355 Disparate Chemicals for Physiologically Based Pharmacokinetic Models for Time-Dependent Plasma Concentrations after Virtual Oral Doses in Humans. Biol. Pharm. Bull., 45, 1812-1817.
- Adachi, K., Utsumi, M., Sato, T., Nakano, H., Shimizu, M. and Yamazaki, H. (2023d): Modeled Rat Hepatic and Plasma Concentrations of Chemicals after Virtual Administrations Using Two Sets of in Silico Liver-to-Plasma Partition Coefficients. Biol. Pharm. Bull., 46, 1316-1323.
- Jamei, M., Marciniak, S., Feng, K., Barnett, A., Tucker, G. and Rostami-Hodjegan, A. (2009): The Simcyp population-based ADME simulator. Expert Opin. Drug Metab. Toxicol., 5, 211-223.
- Kamiya, Y., Handa, K., Miura, T., Ohori, J., Kato, A., Shimizu, M., Kitajima, M. and Yamazaki, H. (2022a): Machine Learning Prediction of the Three Main Input Parameters of a Simplified Physiologically Based Pharmacokinetic Model Subsequently Used to Generate Time-Dependent Plasma Concentration Data in Humans after Oral Doses of 212 Disparate Chemicals. Biol. Pharm. Bull., 45, 124-128.
- Kamiya, Y., Handa, K., Miura, T., Ohori, J., Shimizu, M., Kitajima, M., Shono, F., Funatsu, K. and Yamazaki, H. (2022b): Correction to “An Updated In Silico Prediction Method for Volumes of Systemic Circulation of 323 Disparate Chemicals for Use in Physiologically Based Pharmacokinetic Models to Estimate Plasma and Tissue Concentrations after Oral Doses in Rats”. Chem. Res. Toxicol., 35, 1433.
- Kamiya, Y., Handa, K., Miura, T., Yanagi, M., Shigeta, K., Hina, S., Shimizu, M., Kitajima, M., Shono, F., Funatsu, K. and Yamazaki, H. (2021a): In Silico Prediction of Input Parameters for Simplified Physiologically Based Pharmacokinetic Models for Estimating Plasma, Liver, and Kidney Exposures in Rats after Oral Doses of 246 Disparate Chemicals. Chem. Res. Toxicol., 34, 507-513.
- Kamiya, Y., Omura, A., Hayasaka, R., Saito, R., Sano, I., Handa, K., Ohori, J., Kitajima, M., Shono, F., Funatsu, K. and Yamazaki, H. (2021b): Prediction of permeability across intestinal cell monolayers for 219 disparate chemicals using in vitro experimental coefficients in a pH gradient system and in silico analyses by trivariate linear regressions and machine learning. Biochem. Pharmacol., 192, 114749.
- Kamiya, Y., Yanagi, M., Hina, S., Shigeta, K., Miura, T. and Yamazaki, H. (2020): Plasma, liver, and kidney exposures in rats after oral doses of industrial chemicals predicted using physiologically based pharmacokinetic models: A case study of perfluorooctane sulfonic acid. J. Toxicol. Sci., 45, 763-767.
- Li, X. and Jusko, W.J. (2022): Assessing Liver-to-Plasma Partition Coefficients and In Silico Calculation Methods: When Does the Hepatic Model Matter in PBPK? Drug Metab. Dispos., 50, 1501-1512.
- Mannhold, R., Poda, G.I., Ostermann, C. and Tetko, I.V. (2009): Calculation of molecular lipophilicity: state-of-the-art and comparison of log P methods on more than 96,000 compounds. J. Pharm. Sci., 98, 861-893.
- OECD. (1995): Test No. 107: Partition Coefficient (n-octanol/water): Shake Flask Method. OECD Publishing, Paris.
- OECD. (2022): Test No. 117: Partition Coefficient (n-octanol/water), HPLC Method. OECD Publishing, Paris.
- Paini, A., Leonard, J.A., Joossens, E., Bessems, J.G., Desalegn, A., Dorne, J.L., Gosling, J.P., Heringa, M.B., Klaric, M., Kliment, T., Kramer, N.I., Loizou, G., Louisse, J., Lumen, A., Madden, J.C., Patterson, E.A., Proença, S., Punt, A., Setzer, R.W., Suciu, N., Troutman, J., Yoon, M., Worth, A. and Tan, Y.M. (2019): Next generation physiologically based kinetic (NG-PBK) models in support of regulatory decision making. Comput. Toxicol., 9, 61-72.
- Poulin, P. and Theil, F.P. (2002): Prediction of pharmacokinetics prior to in vivo studies. 1. Mechanism-based prediction of volume of distribution. J. Pharm. Sci., 91, 129-156.
- Rodgers, T., Leahy, D. and Rowland, M. (2005): Physiologically based pharmacokinetic modeling 1: predicting the tissue distribution of moderate-to-strong bases. J. Pharm. Sci., 94, 1259-1276.
- Shebley, M., Sandhu, P., Emami Riedmaier, A., Jamei, M., Narayanan, R., Patel, A., Peters, S.A., Reddy, V.P., Zheng, M., de Zwart, L., Beneton, M., Bouzom, F., Chen, J., Chen, Y., Cleary, Y., Collins, C., Dickinson, G.L., Djebli, N., Einolf, H.J., Gardner, I., Huth, F., Kazmi, F., Khalil, F., Lin, J., Odinecs, A., Patel, C., Rong, H., Schuck, E., Sharma, P., Wu, S.P., Xu, Y., Yamazaki, S., Yoshida, K. and Rowland, M. (2018): Physiologically Based Pharmacokinetic Model Qualification and Reporting Procedures for Regulatory Submissions: A Consortium Perspective. Clin. Pharmacol. Ther., 104, 88-110.
- Zhao, P., Zhang, L., Grillo, J.A., Liu, Q., Bullock, J.M., Moon, Y.J., Song, P., Brar, S.S., Madabushi, R., Wu, T.C., Booth, B.P., Rahman, N.A., Reynolds, K.S., Gil Berglund, E., Lesko, L.J. and Huang, S.M. (2011): Applications of physiologically based pharmacokinetic (PBPK) modeling and simulation during regulatory review. Clin. Pharmacol. Ther., 89, 259-267.
;%0A%09%09%09newWindow.document.open();%0A%09%09%09newWindow.document.write('<img src=%22./Graphics/49_459-t1.jpg%22>');%0A%09%09%09newWindow.document.close();%0A%09%09)
