Abstract
The octanol/water partition coefficient P (logP) is a hydrophobicity index and is one of the determining factors for the pharmacokinetics of orally administered substances because it influences membrane permeability. To illustrate the wide-ranging variety of compounds in the chemical space, a two-dimensional data plot consisting of 25 blocks was previously proposed based on a substance’s in silico chemical descriptors. The logP values of approximately 200 diverse chemicals (test plus reference compounds covering all 25 blocks of the chemical space) were estimated experimentally using retention times in reverse-phase liquid chromatography; these values were compared with those of authentic reference compounds with established logP values (available for 17 of 60 reference substances in the Organization for Economic Co-operation and Development Test Guideline 117). The logP values of 140 of 165 chemicals successfully estimated using four different mobile phase conditions (pH 2, 4, 7, and 10 for molecular forms) correlated significantly with those calculated using the in silico packages ChemDraw and ACD/Percepta (r > 0.72). Although substances that neighbored authentic compounds in the chemical space had precisely correlated logP values estimated experimentally and in silico, some compounds that were more distant from authentic substances showed lower logP values than those estimated in silico. These results indicate that additional authentic reference materials with wider ranging chemical diversity and their logP values from reverse-phase liquid chromatography should be included in the international test guidance to promote simple and reliable estimation of octanol/water partition coefficients, which are important determinant factors for the pharmacokinetics of general chemicals.
INTRODUCTION
Thousands of human-made chemicals found in the environment currently have limited toxicokinetic data. Quantitative in vivo exposure assessment of chemical substances is essential for proper risk management. Among physicochemical properties, the octanol/water partition coefficient P (logP), which indicates a chemical’s hydrophobicity, is an important and principal factor in evaluating the toxico/pharmacokinetics of orally administered substances because it influences intestinal membrane permeability. These considerations inform the determination of priorities for chemical testing. Although the shake-flask method is a traditionally used and reliable approach for determining logP values (Amidon, 2003), it is time-consuming and costly; a simplified method for estimating the octanol/water partition coefficient that uses retention times in high-performance liquid chromatography (HPLC) has been proposed (OECD, 2022) .
The in vitro to in vivo extrapolation of high-throughput toxicokinetic screening data to predict toxicokinetics from rapid in vitro measurements and chemical structure-based properties has recently been recommended (Wambaugh et al., 2018). Physiologically based pharmacokinetic (PBPK) models are widely used to predict the toxicokinetics and pharmacokinetics of chemicals in humans and animals (Jamei et al., 2009; Zhao et al., 2011; Shebley et al., 2018; Paini et al., 2019). We found an inverse relationship between no-observable-effect levels and chemical absorbance rates after oral administration and an inverse relationship between lowest-observed-effect (LOEL) levels and PBPK-modeled hepatic AUC values (Kamiya et al., 2019; Kamiya et al., 2020).We also reported a significant inverse correlation between hepatic/plasma concentrations of food additives with logP > 1 and LOEL values ≤ 300 mg/kg/day (Adachi et al., 2023a).
To realistically predict occupational and environmental exposures, in silico methods to estimate and/or quantify the skin absorption of chemicals have been reported using multi-linear regression analysis to describe skin permeability in terms of logP and molecular weight (Evans et al., 2023). In a zebrafish toxicity screening model in vivo, the toxicity of chemicals was correlated with their hydrophobicity (i.e., logP) (Padilla et al., 2012), probably because neutral species of potentially toxic chemicals have been almost certainly taken up into cells according to their pH-dependent distribution coefficient (logD)-based membrane permeabilities (Köhler et al., 2023). Reevaluating logP values, which constitute a crucial input parameter for PBPK models, may further enhance the accuracy of predictions for both toxicity and pharmacokinetics (Adachi et al., 2023a; Adachi et al., 2023b; Li and Jusko, 2022; Shebley et al., 2018). We previously used machine learning to predict the pharmacokinetic parameters of chemical substances in humans and rats. We managed to progressively improve the prediction accuracy (Adachi et al., 2022a, 2022b; Kamiya et al., 2022; Kamiya et al., 2021; Kamiya et al., 2019) by using a previously proposed two-dimensional data plot consisting of 25 blocks to illustrate the similarity/differences of chemical structures in the chemical space; the coordinates of substances in this two-dimensional plot were determined using in silico chemical descriptors. The rates at which substances cross membranes are highly dependent on the logP values (Adachi et al., 2023b; Poulin and Theil, 2002; Rodgers et al., 2005). Our trivariate linear regression analysis basically found that the observed apparent influx and efflux permeability values of around 200 diverse substances determined by in vitro experiments significantly correlated with molecular weights and the in silico LogP and LogD coefficients (at apical pH 6.0 and basal pH 7.4 levels, respectively; 2021) (Kamiya et al., 2021). However, when calculating logP values using software, the calculation methods vary, and the values may differ when different software packages are used (Mannhold et al., 2009). Furthermore, for some compounds, experimentally estimated logP hydrophobicity information is available; however, the measured data are not always obtained under standardized conditions, e.g., the pH conditions may vary.
To validate the in silico logP values, logP values were experimentally measured using standard HPLC methods. The experimental logP values were compared with those derived using two different software packages to assess their correlation. In this study, the logP values of approximately 200 diverse substances covering all 25 blocks of the chemical space were estimated experimentally in terms of retention times in reverse-phase liquid chromatography; the correlations of experimental and in silico logP values for test substances with structures similar to an different to the authentic reference compounds were compared. The reference compounds and their established logP values are described in the recommendations of the Organization for Economic Co-operation and Development (OECD) Test Guideline 117 (OECD, 2022). Compounds located far from authentic reference substances in the chemical space generally showed lower logP values than those calculated in silico. We propose herein that additional authentic reference materials with a wider range of diversity in the chemical space should be included in the international test guidance to achieve simple and reliable estimation of logP values using reverse-phase liquid chromatography; such a broadening of the structural diversity of authentic reference materials should improve the accuracy of important determinant factors for the pharmacokinetics of general chemicals.
MATERIALS AND METHODS
Chemical source and diversity
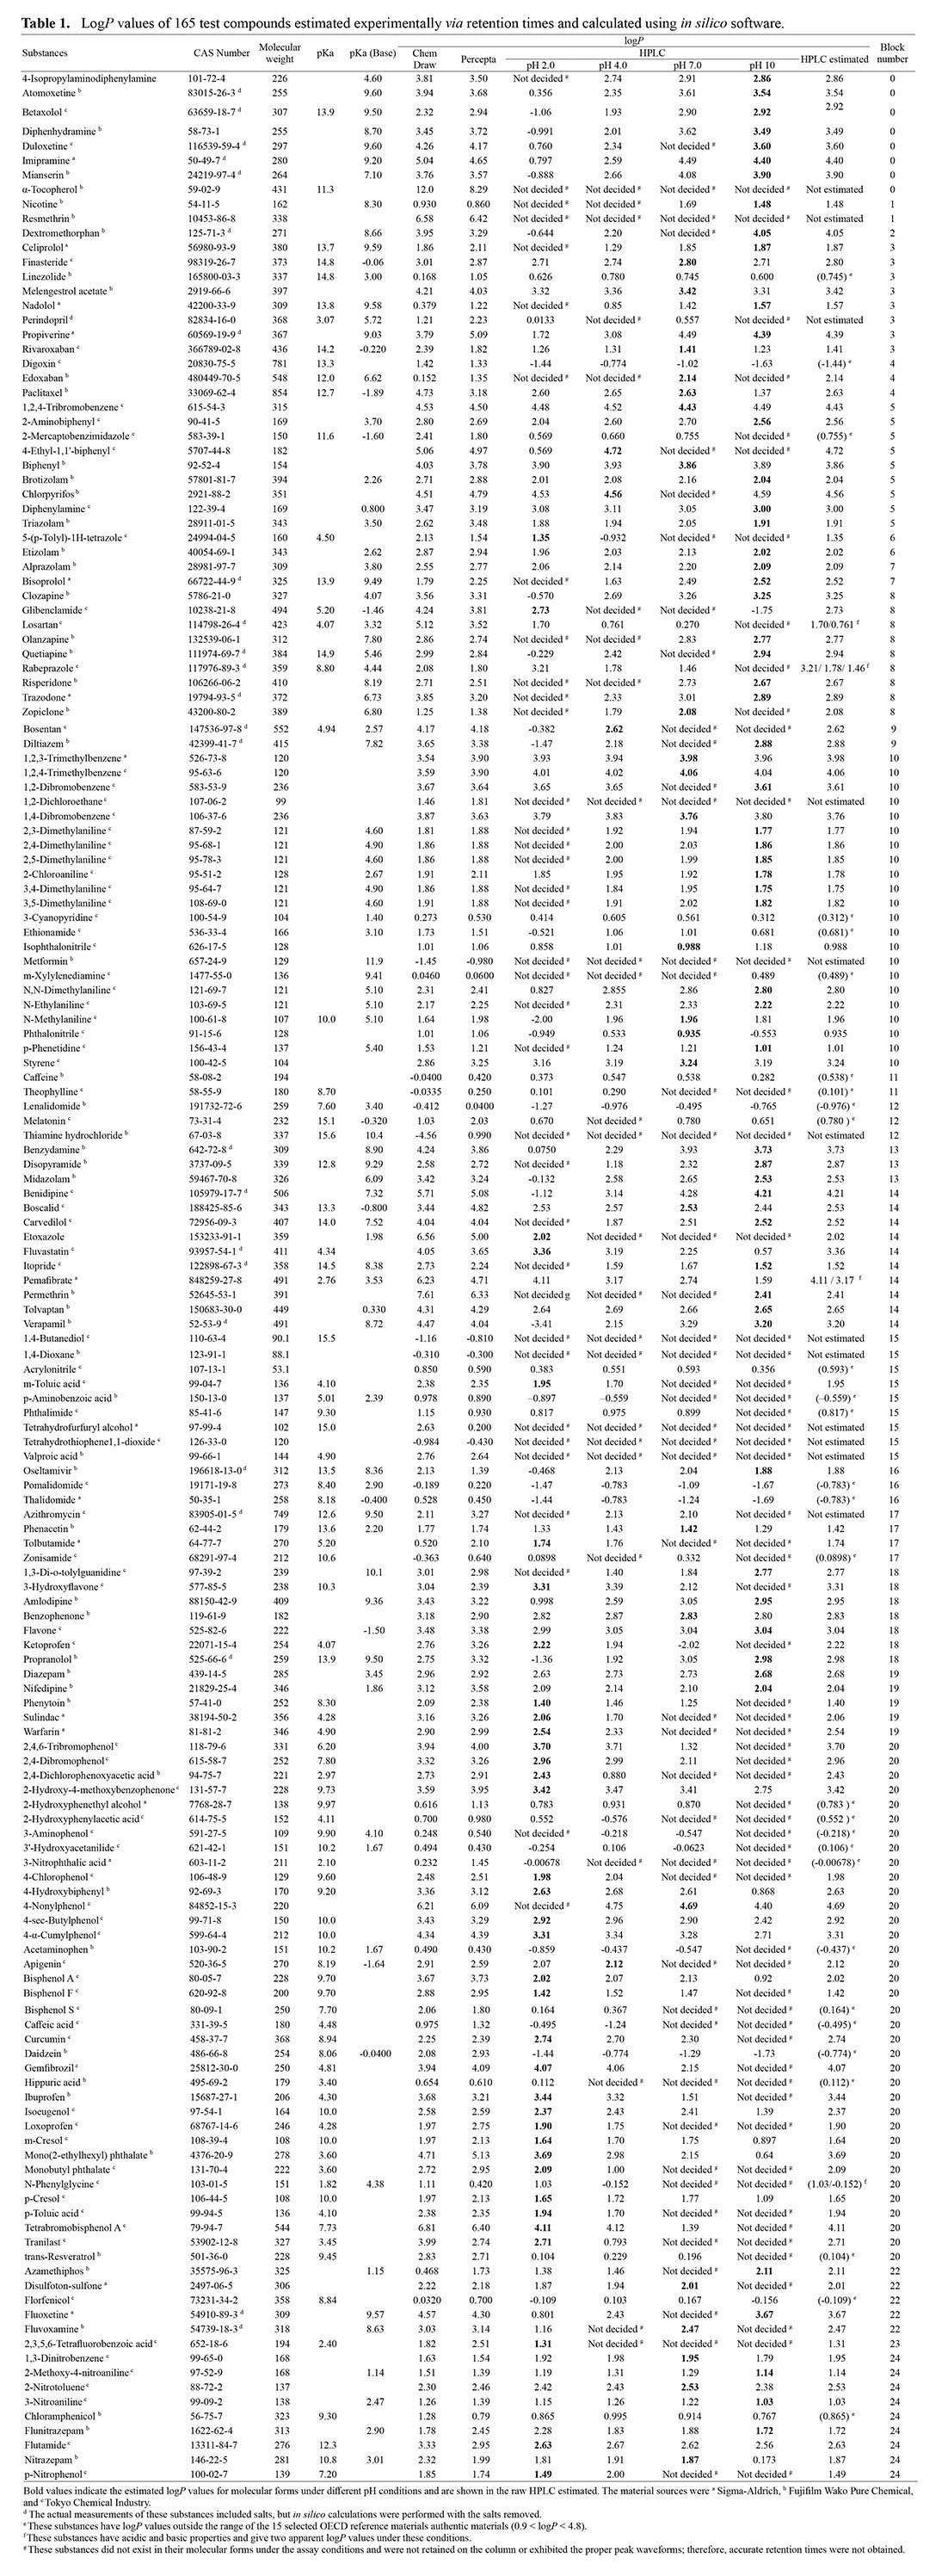
The commercial sources (Sigma-Aldrich, St. Louis, MO, USA; Fujifilm Wako Pure Chemical, Osaka, Japan; or Tokyo Chemical Industry, Tokyo, Japan) and CAS registry numbers of the 17 authentic reference substances and the 165 test chemicals used in this study are shown in Supplemental Tables 1 and Table 1, respectively. The classical acidic/basic dissociation constants [pKa or pKa (base)] of the test chemicals were estimated using ACD/Percepta software (Advanced Chemistry Development, Toronto, ON, Canada). A two-dimensional data plot consisting of 25 blocks was previously proposed to illustrate structural diversity in the chemical space (Kamiya et al., 2019), as described in Supplemental Materials and Methods. The coordinate values for the test compounds in the two-dimensional plots were calculated using the in silico chemical structure (in SMILES format) with the supplemental program gtm_predict, as provided.
Table 1. Log
P values of 165 test compounds estimated experimentally
via retention times and calculated using
in silico software.
 In silico and in vitro logP estimation
The in silico logP values of the chemicals were estimated separately using ChemDraw (PerkinElmer, Waltham, PA, USA) and ACD/Percepta software. The in vitro logP values of the test substances were estimated according to OECD Test Guideline No. 117 (OECD, 2022). This system is based on the retention times in reverse-phase liquid chromatography (data are corrected using values for non-retained thiourea); logP values of the test chemicals were compared with those of selected authentic compounds with established logP values in the range 0.9–4.8 (Supplemental Table S1) (OECD, 2022), as described in the Supplemental Materials and Methods. All chemicals were analyzed using four eluent systems consisting of 75% (v/v) methanol in 10 mM sodium phosphate (pH 2.0 and 7.0), sodium acetate (pH 4.0), and ammonium bicarbonate (pH 10) using conventional or alkaline-proof octadecylsilane (C18) columns at 210 nm.
RESULTS AND DISCUSSION
Figure 1 shows the locations in the chemical space of 60 OECD recommended reference substances and 165 test chemicals, the coordinates of which were determined using in silico chemical descriptors; the two-dimensional space was divided into 25 blocks as previously proposed. The OECD recommended reference materials for calibration were notably concentrated in blocks 5, 10, 15, and 20 (Fig. 1A). In contrast, approximately half of the test substances occupied blocks not occupied by any reference chemicals (Fig. 1B).
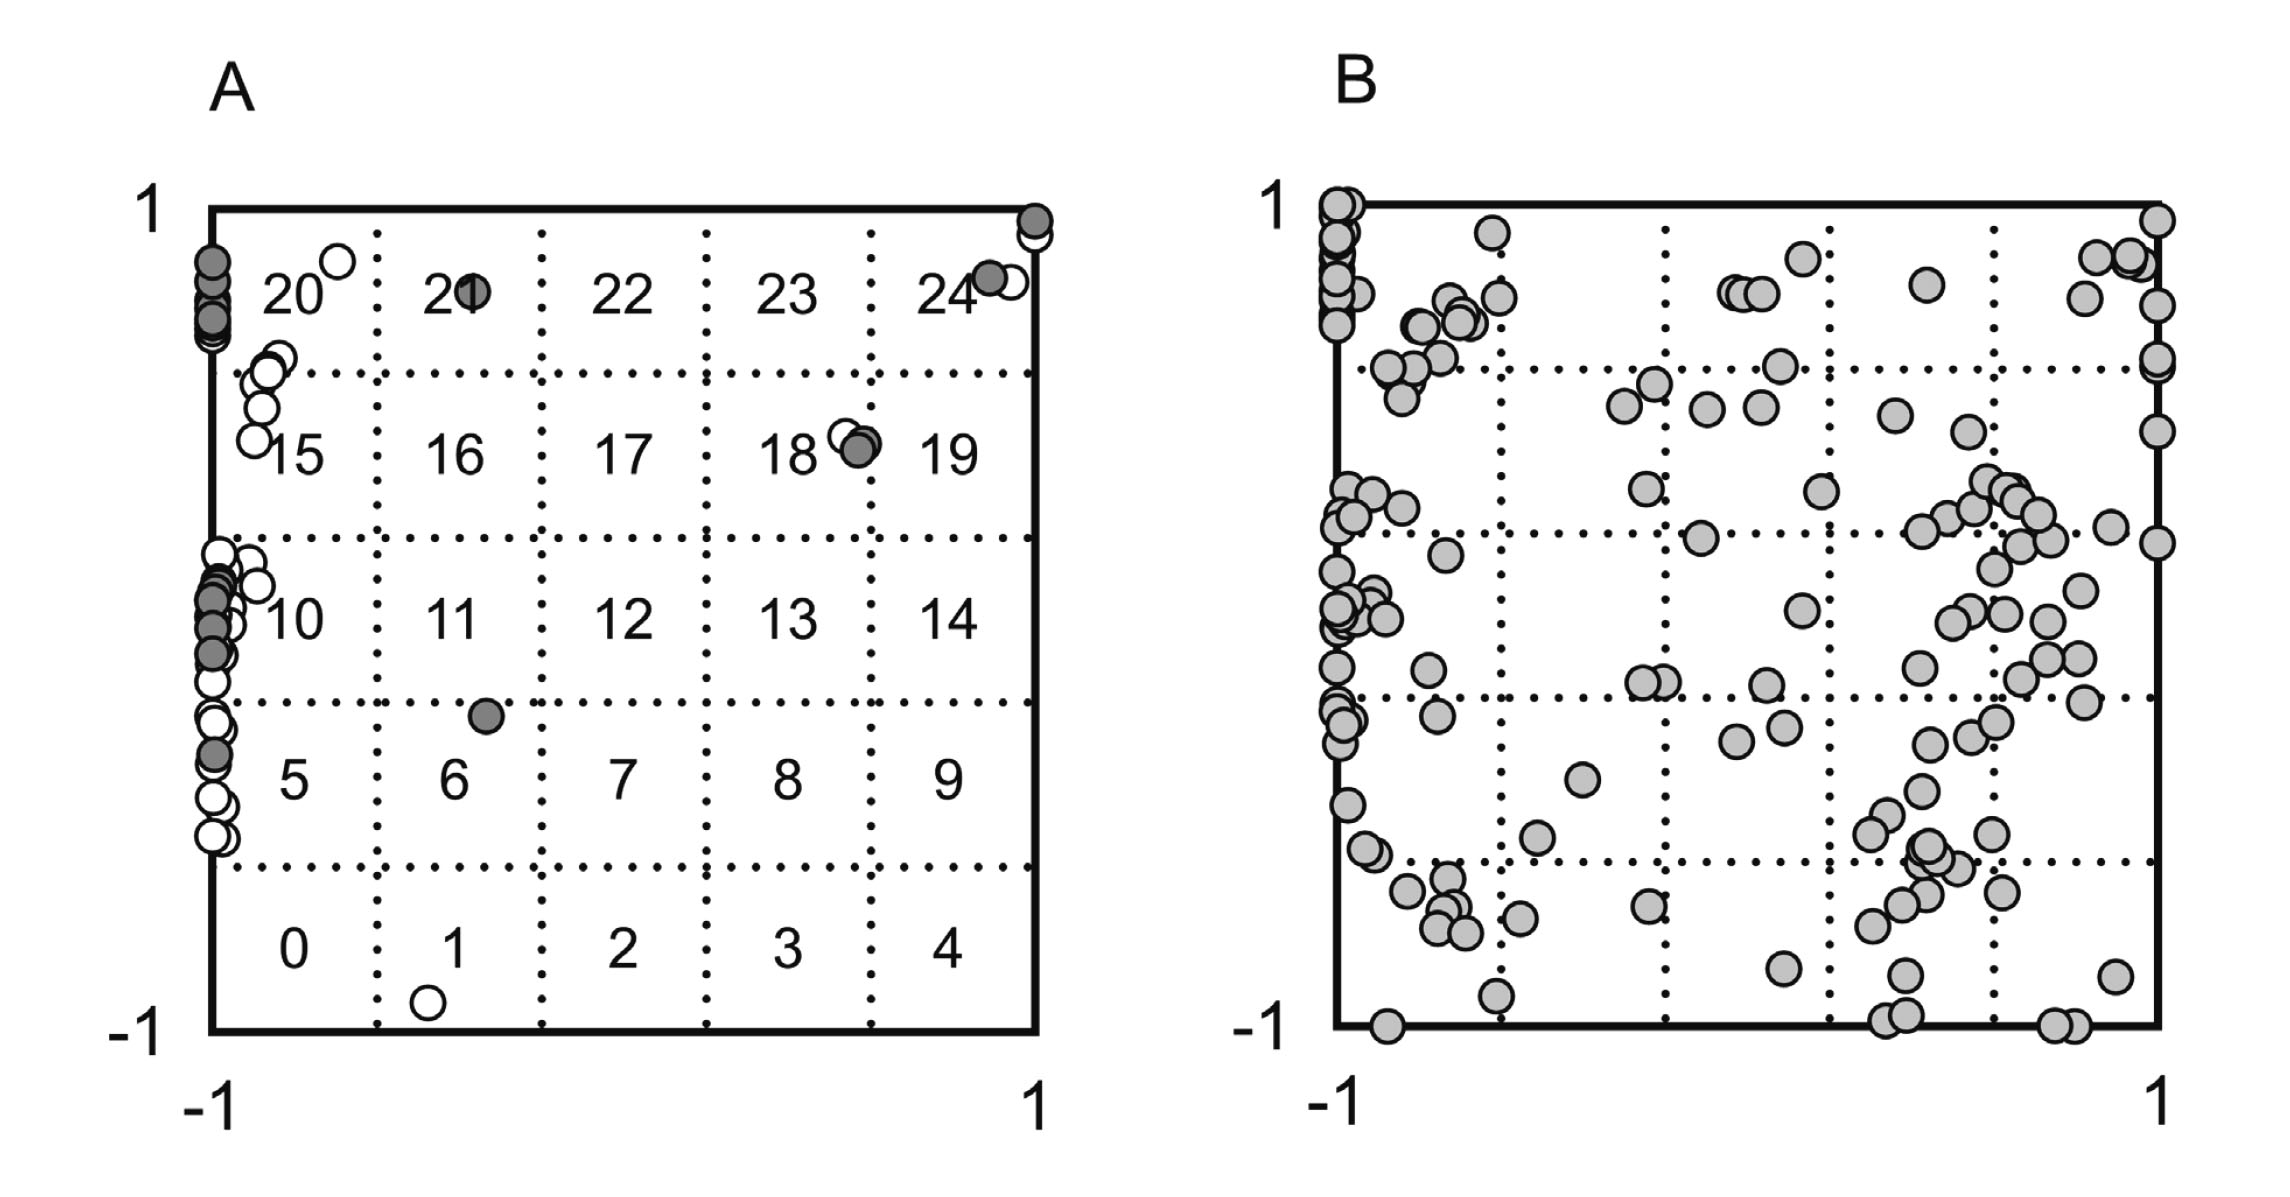
Table 1 shows the logP values of 165 chemical substances measured using HPLC at pH 2, 4, 7, and 10, along with the logP values assumed for their molecular forms, i.e., not ionized. In this study, the retention times of 11 of the 165 substances could not be accurately observed under the current HPLC conditions. Furthermore, 4 of the remaining 154 substances had both acidic and basic functional groups and yielded multiple logP values. Of the remaining 150 substances, the data for 30 chemicals fell outside the range of the 17 selected recommended reference substances (i.e., outside logP of 0.9–4.8). In our preliminary study, 2-butanone (methylethylketone, CAS 78-93-3, established logP of 0.3) did not succeed in obtaining any retention time under the present conditions.
Figure 2 shows, for the above 120 substances with logP values in the same range as the reference substances, the relationship between the logP values derived from ChemDraw or ACD/Percepta software and those successfully estimated empirically in this study. The correlation coefficients between the logP values experimentally estimated by HPLC and the in silico logP values derived using ChemDraw and ACD/Percepta were 0.72 (Fig. 2A) and 0.77 (Fig. 2B), respectively. However, the experimentally estimated logP values tended to be lower than the in silico logP values, although there was good agreement between the two sets of in silico logP values (r = 0.93, Fig. 2C). For the 20 of 30 substances that were excluded because their data fell outside the reference range (i.e., their values were in the range 0 < logP < 0.9), the correlation coefficients between the logP values experimentally estimated using HPLC and the two sets of in silico logP values were both below 0.1 (data not shown).

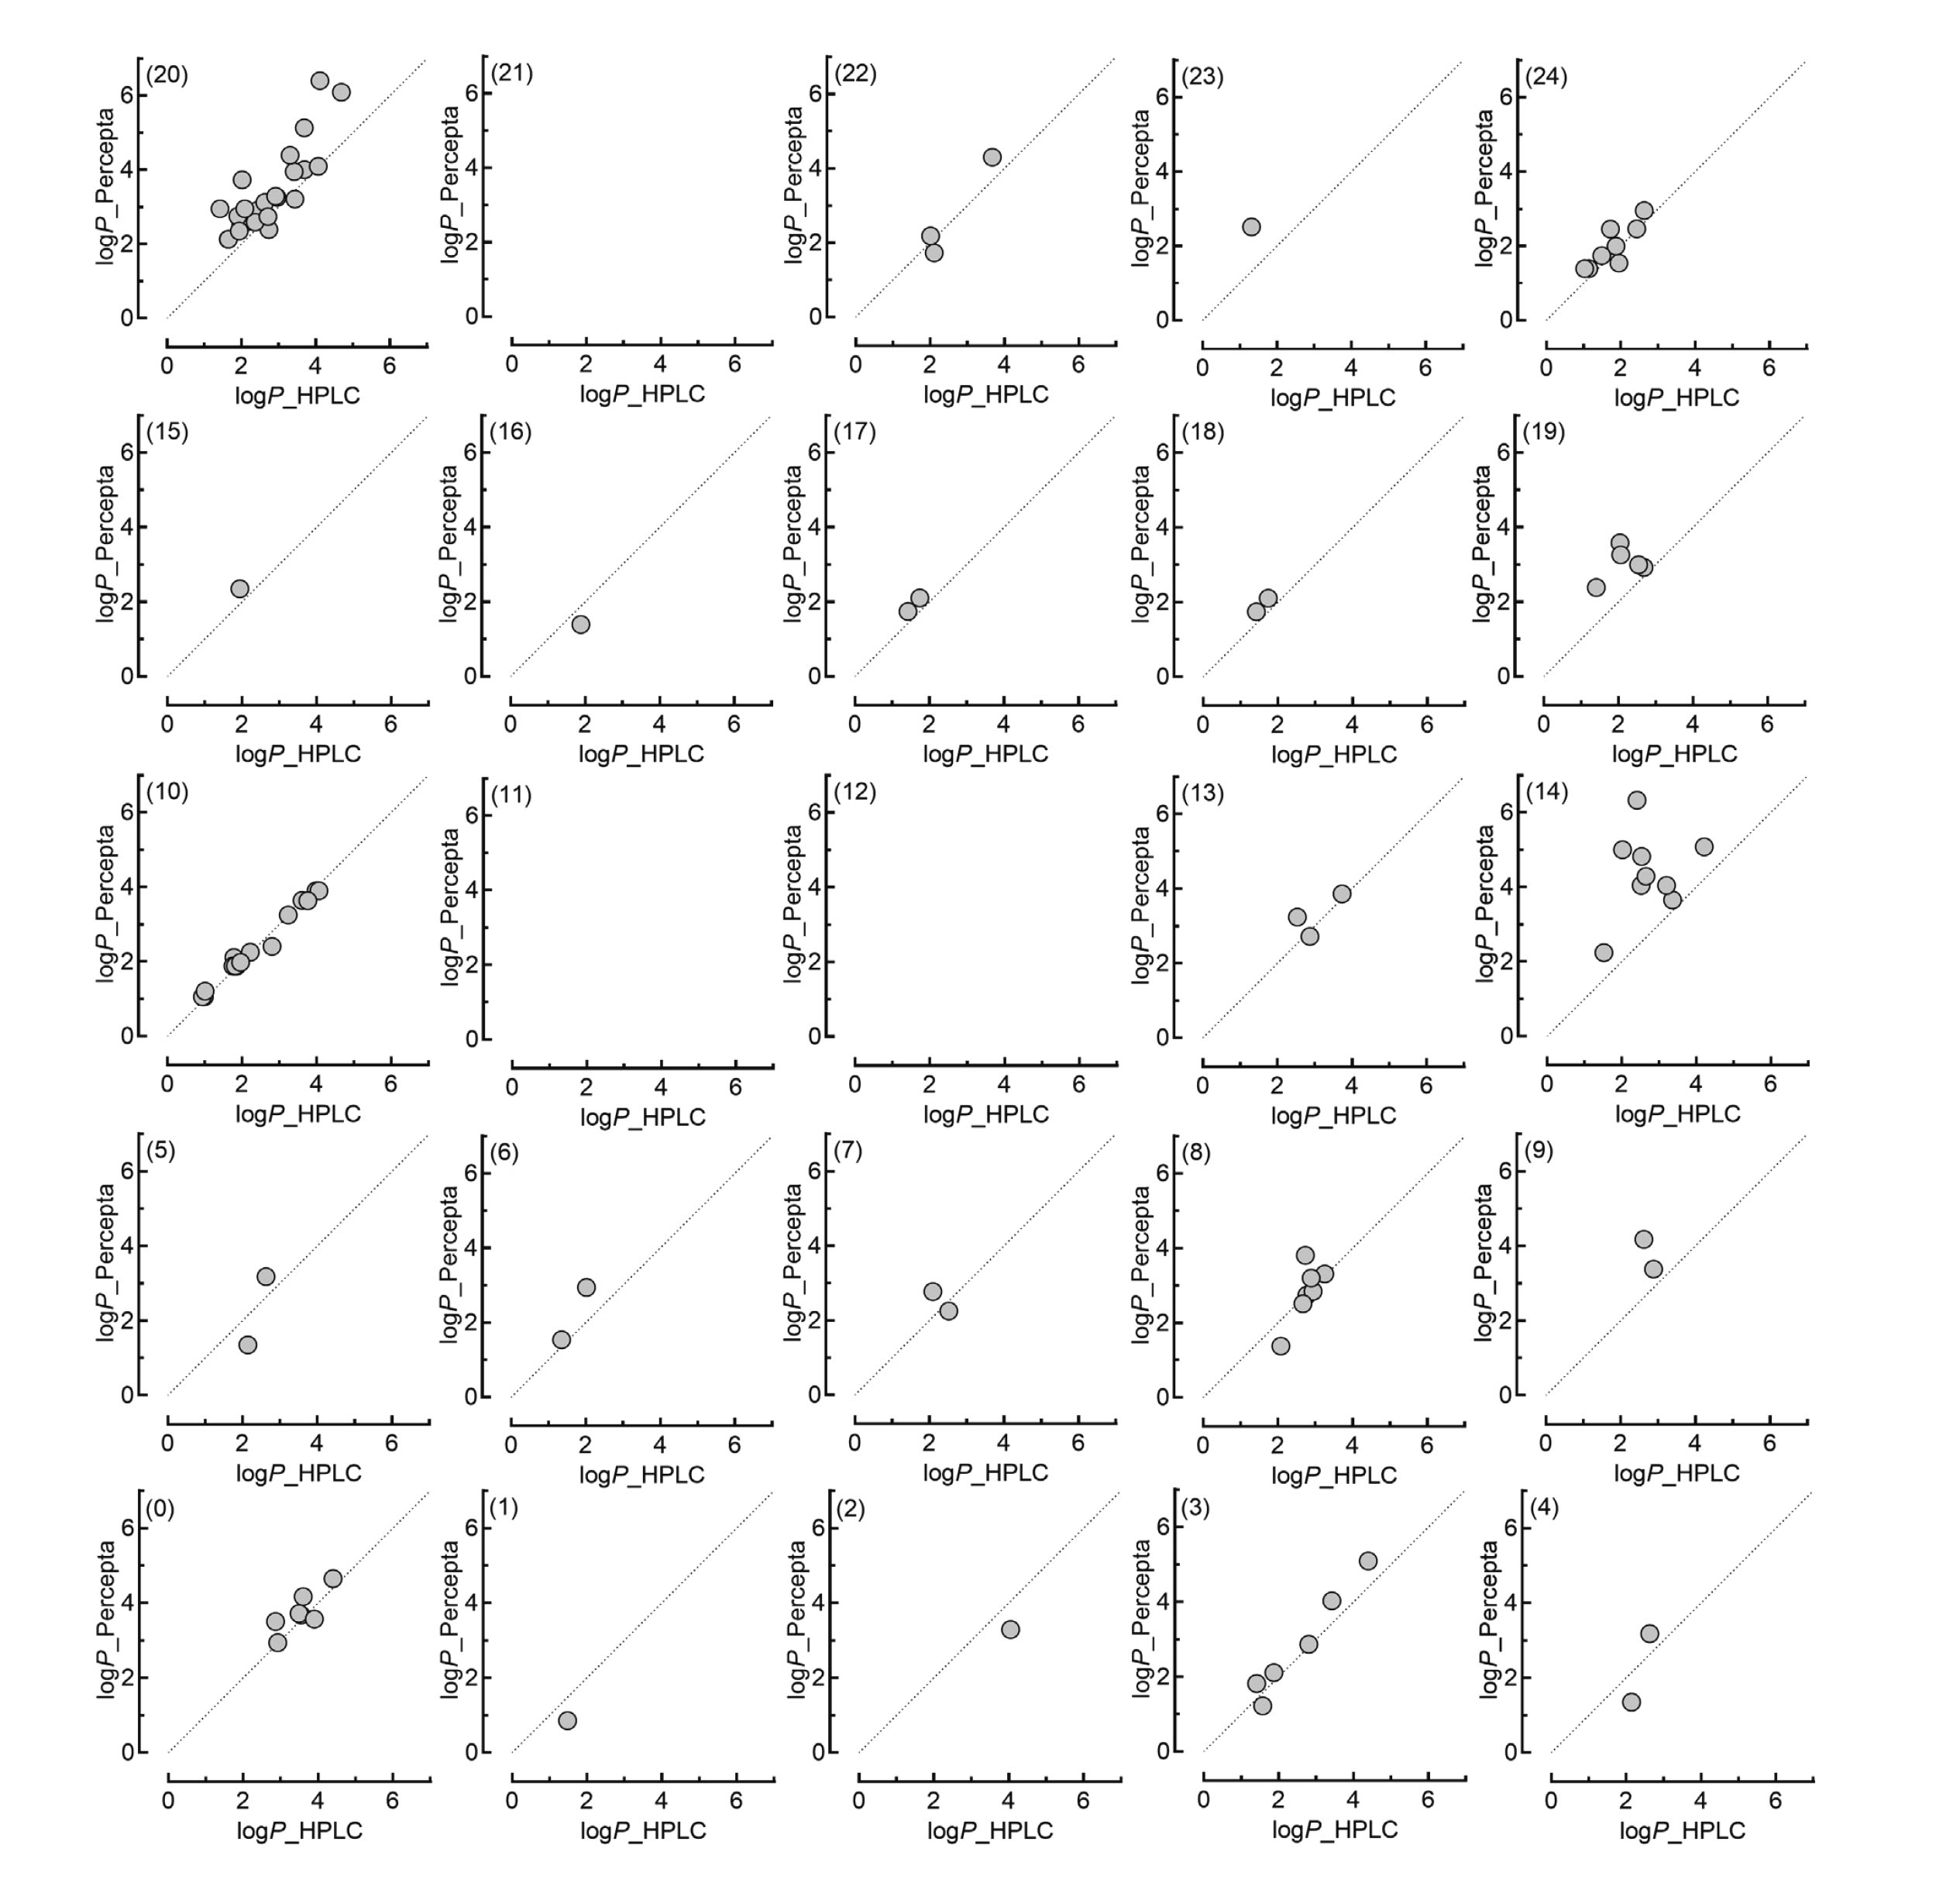
Figure 3 shows the individual correlations in the two-dimensional data plot consisting of 25 blocks between the experimentally estimated logP values of the 120 substances and the logP values derived using ACD/Percepta In the space covered by block 10 (Fig. 1A), where many reference materials were located, a good correlation was observed (Fig. 3). However, in the blocks not neighboring blocks that contained reference materials, there were lower correlations, like the case of block 14 (Fig. 3). It should be noted that some differences in the physical properties, especially hydrophobic interactions, between the reference substances and analytes might have affected the experimentally estimated logP values.
In this study, we focused on logP values, which constitute an important and principal factor for the in silico prediction of pharmacokinetic parameters of chemicals in humans. The limitations of this study include the use of only 17 of the 60 reference materials and the analysis of only 120 substances using HPLC. Little difference was observed between the logP values derived from ChemDraw and ACD/Percepta for more than 100 chemicals (Fig. 2C). It was inferred that the choice of using either ChemDraw- or ACD/Percepta-derived logP values would have minimal impact on in silico predictions of pharmacokinetic parameters for humans and animals. However, considering that noticeable errors can occasionally arise because of the particular characteristics of the two software packages (Mannhold et al., 2009), the use of HPLC remains crucial. Most of the recommended reference materials used in calibration curves are general chemical substances commercially available with simple structures and molecular weights of 200 or lower. To accurately evaluate logP values using HPLC, it might be necessary to have additional reliable reference candidates that reflect the diversity of properties of chemical substances with molecular weights greater than 200 and occupying a wider range of blocks in the chemical space (Fig. 1A). Within the surveyed range, there was a trend of divergence between the in silico and experimentally estimated logP values as the molecular weight of the measured substances increased. Therefore, it was inferred that reference materials with larger molecular weights are necessary for analyzing the logP values of substances such as food additives (Table 1). This would promote enhanced accuracy in predicting the pharmacokinetics and toxicity in animals and humans of a greater variety of chemical substances.
Conclusions
These results indicate that additional authentic reference materials with wider diversity in the chemical space should be included in international test guidance for reverse-phase liquid chromatography to achieve simple and reliable estimation of logP values as important determinant factors of the pharmacokinetics of general chemicals.
ACKNOWLEDGMENTS
This study was supported in part by the Japan Chemical Industry Association Long-Range Research Initiative Program, the Ministry of Economy, Trade and Industry Artificial Intelligence-based Substance Hazard Integrated Prediction System Project, Japan, and a Japan Society for the Promotion of Science Grant-in-Aid for Scientific Research (23K14393). The authors thank Tsubasa Sasaki, Atsuo Arai, Manato Hosoi, Hina Nakano, Norie Murayama, and Masato Kitajima for their assistance. We are also grateful to David Smallbones for copyediting a draft of this article.
Conflict of interest
The authors declare that there is no conflict of interest.
REFERENCES
- Adachi, K., Nakano, H., Sato, T., Shimizu, M. and Yamazaki, H. (2023a): Liver and Plasma Concentrations of Food Chemicals after Virtual Oral Doses Extrapolated Using in Silico Estimated Input Pharmacokinetic Parameters to Confirm Reported Liver Toxicity in Rats. Biol. Pharm. Bull., 46, 1133-1140.
- Adachi, K., Shimizu, M. and Yamazaki, H. (2022a): Updated in silico prediction methods for fractions absorbed and absorption rate constants of 372 disparate chemicals for use in physiologically based pharmacokinetic models for estimating internal concentrations in rats. J. Toxicol. Sci., 47, 453-456.
- Adachi, K., Shimizu, M. and Yamazaki, H. (2022b): Updated in Silico Prediction Methods for Fractions Absorbed and Key Input Parameters of 355 Disparate Chemicals for Physiologically Based Pharmacokinetic Models for Time-Dependent Plasma Concentrations after Virtual Oral Doses in Humans. Biol. Pharm. Bull., 45, 1812-1817.
- Adachi, K., Utsumi, M., Sato, T., Nakano, H., Shimizu, M. and Yamazaki, H. (2023b): Modeled Rat Hepatic and Plasma Concentrations of Chemicals after Virtual Administrations Using Two Sets of in Silico Liver-to-Plasma Partition Coefficients. Biol. Pharm. Bull., 46, 1316-1323.
- Amidon, G.L. (2003): Drug bioavailability: estimation of solubility, permeability, absorption and bioavailability. Wiley-VCH.
- Evans, M.V., Moxon, T.E., Lian, G., Deacon, B.N., Chen, T., Adams, L.D., Meade, A. and Wambaugh, J.F. (2023): A regression analysis using simple descriptors for multiple dermal datasets: going from individual membranes to the full skin. J. Appl. Toxicol., 43, 940-950.
- Jamei, M., Marciniak, S., Feng, K., Barnett, A., Tucker, G. and Rostami-Hodjegan, A. (2009): The Simcyp population-based ADME simulator. Expert Opin. Drug Metab. Toxicol., 5, 211-223.
- Kamiya, Y., Handa, K., Miura, T., Ohori, J., Kato, A., Shimizu, M., Kitajima, M. and Yamazaki, H. (2022): Machine Learning Prediction of the Three Main Input Parameters of a Simplified Physiologically Based Pharmacokinetic Model Subsequently Used to Generate Time-Dependent Plasma Concentration Data in Humans after Oral Doses of 212 Disparate Chemicals. Biol. Pharm. Bull., 45, 124-128.
- Kamiya, Y., Omura, A., Hayasaka, R., Saito, R., Sano, I., Handa, K., Ohori, J., Kitajima, M., Shono, F., Funatsu, K. and Yamazaki, H. (2021): Prediction of permeability across intestinal cell monolayers for 219 disparate chemicals using in vitro experimental coefficients in a pH gradient system and in silico analyses by trivariate linear regressions and machine learning. Biochem. Pharmacol., 192, 114749.
- Kamiya, Y., Otsuka, S., Miura, T., Takaku, H., Yamada, R., Nakazato, M., Nakamura, H., Mizuno, S., Shono, F., Funatsu, K. and Yamazaki, H. (2019): Plasma and Hepatic Concentrations of Chemicals after Virtual Oral Administrations Extrapolated Using Rat Plasma Data and Simple Physiologically Based Pharmacokinetic Models. Chem. Res. Toxicol., 32, 211-218.
- Kamiya, Y., Otsuka, S., Miura, T., Yoshizawa, M., Nakano, A., Iwasaki, M., Kobayashi, Y., Shimizu, M., Kitajima, M., Shono, F., Funatsu, K. and Yamazaki, H. (2020): Physiologically Based Pharmacokinetic Models Predicting Renal and Hepatic Concentrations of Industrial Chemicals after Virtual Oral Doses in Rats. Chem. Res. Toxicol., 33, 1736-1751.
- Köhler, H.R., Gräff, T., Schweizer, M., Blumhardt, J., Burkhardt, J., Ehmann, L., Hebel, J., Heid, C., Kundy, L., Kuttler, J., Malusova, M., Moroff, F.M., Schlösinger, A.F., Schulze-Berge, P., Panagopoulou, E.I., Damalas, D.E., Thomaidis, N.S., Triebskorn, R., Maletzki, D., Kühnen, U. and von der Ohe, P.C. (2023): LogD-based modelling and ΔlogD as a proxy for pH-dependent action of ionizable chemicals reveal the relevance of both neutral and ionic species for fish embryotoxicity and possess great potential for practical application in the regulation of chemicals. Water Res., 235, 119864.
- Li, X. and Jusko, W.J. (2022): Assessing Liver-to-Plasma Partition Coefficients and In Silico Calculation Methods: When Does the Hepatic Model Matter in PBPK? Drug Metab. Dispos., 50, 1501-1512.
- Mannhold, R., Poda, G.I., Ostermann, C. and Tetko, I.V. (2009): Calculation of molecular lipophilicity: state-of-the-art and comparison of log P methods on more than 96,000 compounds. J. Pharm. Sci., 98, 861-893.
- OECD. (2022): Test No. 117: Partition Coefficient (n-octanol/water), HPLC Method. OECD Publishing, Paris.
- Padilla, S., Corum, D., Padnos, B., Hunter, D.L., Beam, A., Houck, K.A., Sipes, N., Kleinstreuer, N., Knudsen, T., Dix, D.J. and Reif, D.M. (2012): Zebrafish developmental screening of the ToxCast™ Phase I chemical library. Reprod. Toxicol., 33, 174-187.
- Paini, A., Leonard, J.A., Joossens, E., Bessems, J.G., Desalegn, A., Dorne, J.L., Gosling, J.P., Heringa, M.B., Klaric, M., Kliment, T., Kramer, N.I., Loizou, G., Louisse, J., Lumen, A., Madden, J.C., Patterson, E.A., Proença, S., Punt, A., Setzer, R.W., Suciu, N., Troutman, J., Yoon, M., Worth, A. and Tan, Y.M. (2019): Next generation physiologically based kinetic (NG-PBK) models in support of regulatory decision making. Comput. Toxicol., 9, 61-72.
- Poulin, P. and Theil, F.P. (2002): Prediction of pharmacokinetics prior to in vivo studies. 1. Mechanism-based prediction of volume of distribution. J. Pharm. Sci., 91, 129-156.
- Rodgers, T., Leahy, D. and Rowland, M. (2005): Physiologically based pharmacokinetic modeling 1: predicting the tissue distribution of moderate-to-strong bases. J. Pharm. Sci., 94, 1259-1276.
- Shebley, M., Sandhu, P., Emami Riedmaier, A., Jamei, M., Narayanan, R., Patel, A., Peters, S.A., Reddy, V.P., Zheng, M., de Zwart, L., Beneton, M., Bouzom, F., Chen, J., Chen, Y., Cleary, Y., Collins, C., Dickinson, G.L., Djebli, N., Einolf, H.J., Gardner, I., Huth, F., Kazmi, F., Khalil, F., Lin, J., Odinecs, A., Patel, C., Rong, H., Schuck, E., Sharma, P., Wu, S.P., Xu, Y., Yamazaki, S., Yoshida, K. and Rowland, M. (2018): Physiologically Based Pharmacokinetic Model Qualification and Reporting Procedures for Regulatory Submissions: A Consortium Perspective. Clin. Pharmacol. Ther., 104, 88-110.
- Wambaugh, J.F., Hughes, M.F., Ring, C.L., MacMillan, D.K., Ford, J., Fennell, T.R., Black, S.R., Snyder, R.W., Sipes, N.S., Wetmore, B.A., Westerhout, J., Setzer, R.W., Pearce, R.G., Simmons, J.E. and Thomas, R.S. (2018): Evaluating In Vitro-In Vivo Extrapolation of Toxicokinetics. Toxicol. Sci., 163, 152-169.
- Zhao, P., Zhang, L., Grillo, J.A., Liu, Q., Bullock, J.M., Moon, Y.J., Song, P., Brar, S.S., Madabushi, R., Wu, T.C., Booth, B.P., Rahman, N.A., Reynolds, K.S., Gil Berglund, E., Lesko, L.J. and Huang, S.M. (2011): Applications of physiologically based pharmacokinetic (PBPK) modeling and simulation during regulatory review. Clin. Pharmacol. Ther., 89, 259-267.
;%0A%09%09%09newWindow.document.open();%0A%09%09%09newWindow.document.write('<img src=%22./Graphics/49_127-t1.jpg%22>');%0A%09%09%09newWindow.document.close();%0A%09%09)