Abstract
Quantitative structure permeation relationship (QSPR) models have gained prominence in recent years owing to their capacity to elucidate the influence of physicochemical properties on the dermal absorption of chemicals. These models facilitate the prediction of permeation coefficient (Kp) values, indicating the skin permeability of a chemical under infinite dose conditions. Conversely, obtaining dermal absorption rates (DAs) under finite dose conditions, which are crucial for skin product safety evaluation, remains a challenge when relying solely on Kp predictions from QSPR models. One proposed resolution involves using Kroes’ methodology, categorizing DAs based on Kp values; however, refinement becomes necessary owing to discreteness in the obtained values. We previously developed a mathematical model using Kp values obtained from in vitro dermal absorption tests to predict DAs. The present study introduces a new methodology, Integrating Mathematical Approaches (IMAS), which combines QSPR models and our mathematical model to predict DAs for risk assessments without conducting in vitro dermal absorption tests. Regarding 40 chemicals (76.1 ≤ MW ≤ 220; −1.4 ≤ Log Ko/w ≤ 3.1), IMAS showed that 65.0% (26/40) predictions of DA values were accurate to within twofold of the observed values in finite dose experiments. Compared to Kroes’ methodology, IMAS notably mitigated overestimation, particularly for hydrophilic chemicals with water solubility exceeding 57.0 mg/cm3. These findings highlight the value of IMAS as a tool for skin product risk assessments, particularly for hydrophilic compounds.
INTRODUCTION
Estimating human exposure levels is essential in systemic chemical risk assessments. In the context of cosmetics, where exposure primarily occurs through the skin, dermal absorption rates (%; DAs) must be considered (SCCS, 2023). The OECD-endorsed in vitro dermal absorption test using skin tissues serves as a key method and OECD test guideline for evaluating DAs (OECD, 2004).
In addition to the in vitro test, the regulatory body has indicated default DA values based on the relationship between dermal absorption and physicochemical properties. Notably, 10% is applied when the molecular weight (MW) exceeds 500 and the water/octanol partition coefficient (Log Ko/w) is outside the range −1 to 4; otherwise, a default of 100% is used (ECHA, 2017). Dermal absorption comprises partitioning into and diffusion within the skin, with Log Ko/w and MW significantly influencing each event (Potts and Guy, 1992; Ates et al., 2016). Default DA values are beneficial in scenarios where available information on the dermal absorption of target chemicals is limited.
Quantitative structure permeation relationship (QSPR) models have garnered attention for their capacity to predict dermal absorption based on physicochemical properties (Potts and Guy, 1992; Baba et al., 2015; Atobe et al., 2015; Zeng et al., 2021; Alves et al., 2015). These models primarily predict the permeability coefficient (Kp), which indicates the rate of chemical penetration through the skin. Recognizing Kp as a valuable parameter for estimating the potential biological uptake of target chemicals, several in silico tools supporting the risk assessment process now integrate QSPR models for Kp prediction (Table 1).
Table 1. QSPR models from
in silico tools.

Although Kp can be obtained under infinite dose conditions with negligible vehicle evaporation, vehicle evaporation cannot be ignored in practical use owing to low applied volumes of cosmetics; therefore, estimating DA using Kp under finite dose conditions remains a crucial issue. To address this, Kroes et al. (2007) proposed a methodology for classifying DAs into 10%, 40%, and 80% using Kp as a parameter. Kroes’ methodology calculated the maximum skin permeation rate (Jmax) based on Kp and saturated water solubility (Cwatsat), categorizing DAs according to Jmax. In this method, Kp is calculated using the Potts and Guys model, and only three physicochemical properties (MW, Log Ko/w, and Cwatsat) are required to obtain DA values. Although convenient, precision may be compromised due to the discrete values in Kroes’ methodology. Additionally, Buist et al. (2010) developed a mathematical model to predict DA using Kp but overlooked the limitation of target chemical exposure time due to vehicle evaporation, leading to overestimation (Buist et al., 2010; Eleftheriadou et al., 2019). To address this issue, we developed a mathematical model considering vehicle evaporation and Kp values, which were obtained from in vitro transdermal absorption studies under infinite dose conditions; the model exhibited high prediction accuracy (correlation coefficient > 0.9) with a limited number (seven) of chemical cases (Kunita et al., 2022). This outcome suggested that evaluating DA values may be possible without the need for in vitro dermal absorption tests, as our mathematical model and QSPR models could be applied to predict Kp values. Despite these promising results, the model’s applicability remains a challenge given the limited number of chemicals tested in previous research. Additionally, considering the variability in in vitro dermal absorption test results, SCCS recommends applying a mean + standard deviation value (msDA) to cosmetics risk assessments (SCCS, 2023). Given that our mathematical model is suitable for predicting mean DA (mDA), directly applying the predicted values to risk assessments is considered unfavorable.
In this study, aiming to enhance the risk assessments of skin-applied products, we introduced a novel methodology for predicting msDA with reliability by incorporating QSPR models with our mathematical model: Integrating Mathematical Approaches (IMAS). We selected suitable QSPR models for estimating Kp by comparing their predictive performance. Subsequently, we collected in vitro dermal absorption test data under finite dose conditions for 54 chemicals from existing literature. Additionally, we developed a method to predict msDA from predicted mDA by identifying the relationship between mDA and msDA. Finally, we compared the predictive performance IMAS and Kroes’ methodology to highlight the utility of IMAS in risk assessments.
MATERIALS AND METHODS
Dataset for QSPR models
For 227 chemicals, Kp values from in vitro dermal absorption tests performed under infinite dose conditions were collected from the literature (Kunita et al., 2022; Baba et al., 2015; Chen et al., 2013; Shen et al., 2014; Fini et al., 2012). In instances of multiple values for the same chemicals, an average Kp value was used. Log Ko/w and Cwatsat data were also collected from the literature (Hewitt et al., 2020) as well as the EPI SuiteTM database (Environmental Protection Agency, Washington, DC, USA), a suitable program for estimating physical/chemical properties. These data are summarized in Supplemental table.
Log Ko/w estimation
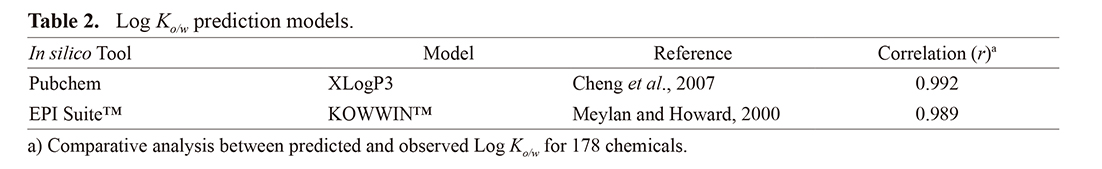
Using Pubchem (https://pubchem.ncbi.nlm.nih.gov/) and EPI SuiteTM, Log Ko/w values were predicted. Table 2 shows the Log Ko/w predictive models for each in silico tool. Predicted Log Ko/w values for 227 chemicals were derived from these models (Supplemental table).
Table 2. Log
Ko/w prediction models.
 DA collection
DA values from in vitro dermal absorption tests performed under finite dose conditions were collected from the literature (Kunita et al., 2022; Hewitt et al., 2020; Duracher et al., 2015; Iliopoulos et al., 2019; Franz, 1975). In addition to literature, the databases from the ECHA (https://echa.europa.eu/et/home), the SCCS opinion (https://health.ec.europa.eu/scientific-committees/scientific-committee-consumer-safety-sccs/sccs-opinions_en) and the Cosmetic Ingredient Review (CIR; https://online.personalcarecouncil.org/jsp/IngredInfoSearchResultPage.jsp) were reviewed to acquire information on DAs. To address potential underestimation due to excessive applied volume (Buist et al., 2009), the DA was conservatively corrected, adhering to OECD test guidelines recommending a sample application volume of ≤ 10 μL/cm2 (OECD, 2004). DA was corrected using the following equation:

The corrected DA data for the 54 chemicals are summarized in Table 3.
Table 3. Summary of observed and calculated data obtained using IMAS and Kroes’ methodology.
 Kp prediction using QSPR models
Derek Nexus (Lhasa Limited, Leeds, UK; http://www.lhasalimited.org/products/derek-nexus.htm) predicts toxicity based on a knowledge base, and ChemTunes.ToxGPS (Molecular Networks GmbH, Nurnberg, Germany; https://mn-am.com/products/chemtunestoxgps/) retrieves relevant information, including bioavailability, combining chemistry and toxicity searches. The Potts and Guys model and the DermwinTM model use MW and Log Ko/w to predict the Kp (Table 1); given their similarity, the Potts and Guys model, in addition to the ChemTunes model, was selected for Kp prediction. Kp calculations based on Potts and Guys model were performed using Derek Nexus. Additionally, Kp was predicted using ChemTunes.ToxGPS. SMILES obtained from Pubchem was applied to these in silico tools. Considering the impact of viable skin layers beneath the stratum corneum on the penetration rate of lipophilic chemicals, the predicted Kp values were corrected using the following equation (Cleek and Bunge, 1993):

mDA prediction under finite dose conditions
mDA can be predicted using the following equation (Kunita et al., 2022):

In our mathematical model of dermal absorption under finite dose conditions, we assumed two distinct phases based on vehicle evaporation (Fig. 1). The first phase considered the skin-applied sample and treated stratum corneum as a single compartment, where chemicals penetrate the skin until Teva, representing the time required for complete solvent evaporation. In the second phase, after Teva is surpassed, chemicals present on the skin surface cannot further penetrate owing to vehicle evaporation, whereas those in the stratum corneum migrate into the viable epidermis. In Eq. (3), A represents the applied area, L denotes skin thickness, V represents the sample volume, Vsc denotes stratum corneum volume, and K represents the partition coefficient. These parameters were set as follows: A = 1.0 cm2, L = 0.1 cm, V = 0.01 cm3, Vsc = 0.002 cm3, and Teva = 1.5 h. Additionally, the Vecchia and Bunge model was used to predict K according to the following equation (Vecchia and Bunge, 2002):


Classification of DA using Kroes’ methodology
Jmax was calculated using corrected Kp values, derived from Eq. (2), and Cwatsat (Kroes et al., 2007):

msDA classification based on calculated Jmax is shown in Eq. (6).

Statistical analysis
Pearson’s correlation coefficients, obtained using Microsoft Excel 365, were employed for analysis of relationships between predicted and observed values. Welch’s t test was used for comparing mean values between two groups, with statistical significance set at 5% (p < 0.05).
RESULTS
Estimation of Log Ko/w using in silico models
The prediction accuracies of Pubchem and EPI SuiteTM were compared using observed data for 178 chemicals (listed in Supplemental table). The relationship between the observed and predicted data for both models exhibited a coefficient surpassing 0.9 (Table 2). Chemical spaces of MW and Log Ko/w for the chemicals listed in Supplemental table and Table 3 are depicted in Fig. 2A. In cases lacking observed Log Ko/w values, compensatory data from Pubchem were used, showing a higher correlation coefficient compared with EPI SuiteTM (Table 2). For the 54 chemicals presented in Table 3, MW and Log Ko/w values overlapped with the chemical spaces listed in Supplemental table, with similar chemical spaces observed for MW and Log Ko/w. Among the 40 chemicals, MW ranged from 76.1 to 362.5 (Fig. 2B), and Log Ko/w ranged from −1.4 to 5.7 (Fig. 2C).
QSPR model selection
For 227 chemicals, Kp values were predicted using the Potts and Guys model and ChemTunes model. Comparison between predicted and observed values indicated higher correlation coefficients in the ChemTunes model (r = 0.78) than in the Potts and Guys model (r = 0.69) (Fig. 3A, B). The Potts and Guys model yielded 136 instances with fewer predicted values than observed values, whereas the ChemTunes model had 135 such instances. To further minimize the number of chemicals with predicted values lower than observed values, the higher value between the predicted Kp values from these two QSPR models was adopted (battery approach), reducing the number of chemicals with predicted values lower than observed values to 96. The relationships between battery approach, obtained Kp values, and observed data showed comparable correlations relative to the ChemTunes model (r = 0.76; Fig. 3C).
msDA prediction under finite dose conditions
mDA values for the 54 chemicals listed in Table 3 were predicted using Eq. (3) with two calculated parameters: K values from Eq. (4) and Kpcorr values obtained by applying Kp values from the battery approach to Eq. (2).
To predict msDA from mDA, their relationship was investigated for 48 of the 54 chemicals which had observed msDA values. Confirming a linear relationship between msDA/mDA and Log10 mDA, the following regression equation was derived:

Based on Eq. (7), the correction of mDA to msDA was considered applicable to risk assessments. Additionally, incorporating the SE into the intercept value in Eq. (7), aiming for conservative correction, yielded the following equations:

For the 6 remaining chemicals of 54 chemicals, observed msDA values were calculated by substituting observed mDA into Eq. (8). With respect to 54 chemicals, predicted msDA values were calculated by substituting predicted mDA into Eq. (8), and comparisons with observed values were conducted. Prediction of msDA was accurate to 50.0% (27/54) within twofold (Table 4). Four chemicals (isosorbide mononitrate, niacinamide, 3-O-ethyl-L-ascorbic acid and 2-amino-2-methylpropanol) exhibited twofold lower predicted msDA values compared with observed msDA values (Table 3). Hereafter, the methodology for predicting msDA, as described above, is termed IMAS.
Table 4. Predictive performance of IMAS and Kroes’ methodology for msDA.

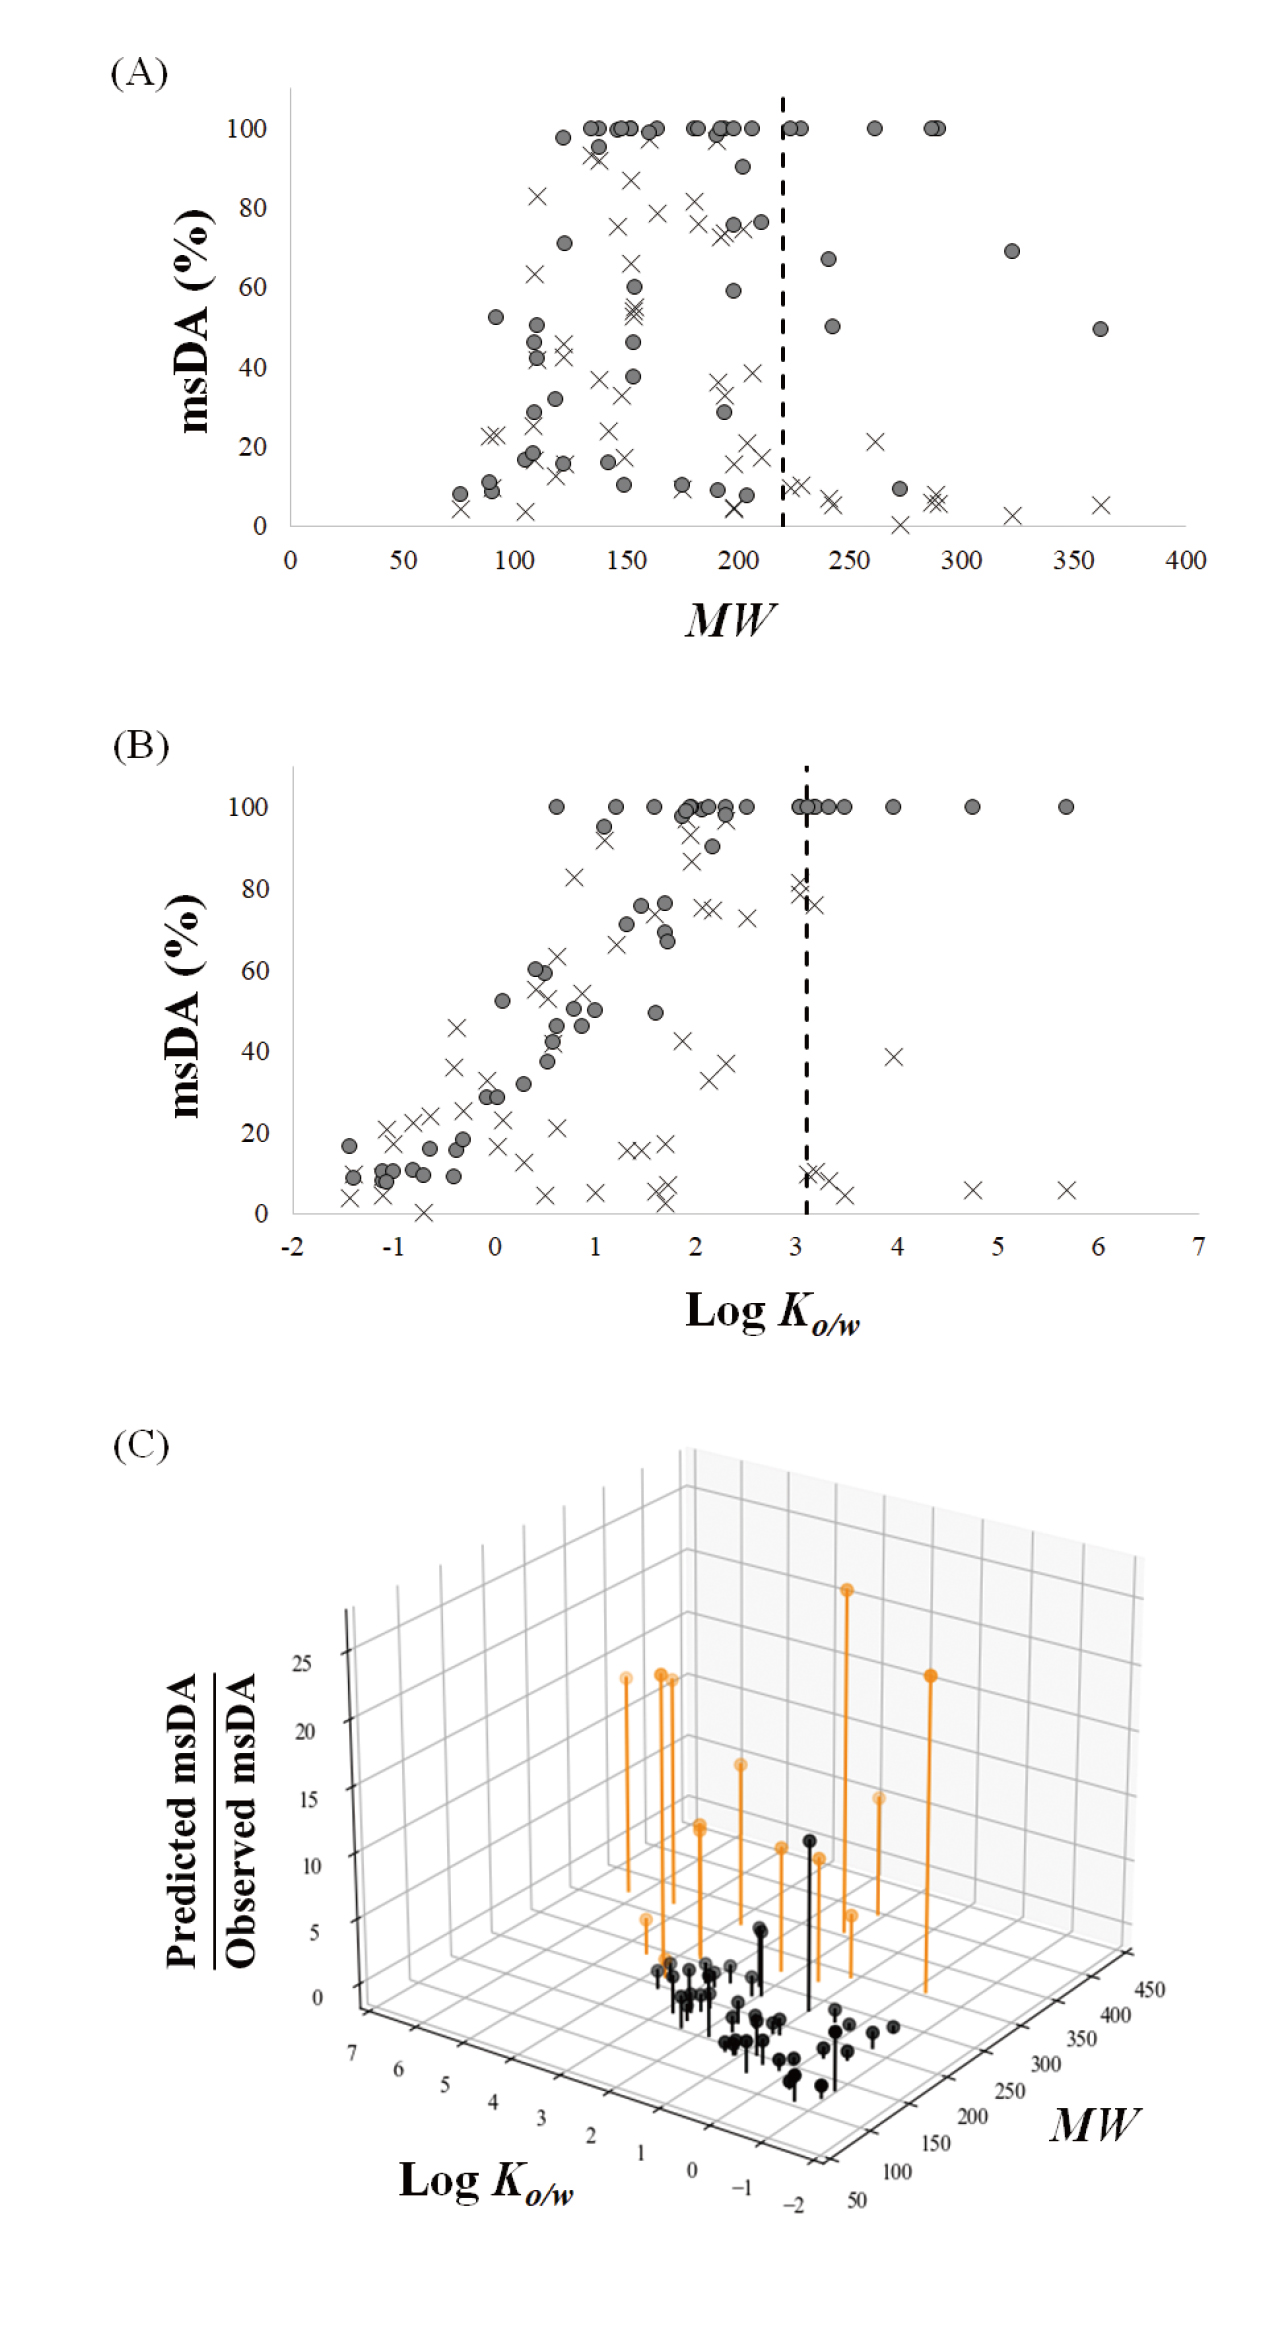
To clarify the predictive performance of IMAS, msDA values were compared with MW and/or Log Ko/w. Chemicals with MW or Log Ko/w values > 220 or > 3.1, respectively, tended to exhibit low observed and high predicted msDA values (Fig. 4A, B). Conversely, chemicals with MW ≤ 220 (Fig. 4A) and Log Ko/w ≤ 3.1 (Fig. 4B) showed well-estimated predicted msDA values relative to observed msDA values. Predicted msDA/observed msDA, as shown in Fig. 4C, is a ratio expressing the predictive performance for chemicals’ physicochemical properties (black indicates chemicals with MW ≤ 220 and Log Ko/w ≤ 3.1, whereas orange indicates those with MW > 220 or Log Ko/w > 3.1). Comparing predictive performance for physicochemical properties, most chemicals with MW ≤ 220 and Log Ko/w ≤ 3.1 showed robust predictivity based on the predicted msDA/observed msDA ratio. Following these results, when 14 chemicals from Table 3 with specific physicochemical properties (MW > 220 or Log Ko/w > 3.1) were excluded, 65.0% (26/40) of the predicted/observed msDA ratios were within twofold (Table 4).
Jmax was calculated for 54 chemicals using Kpcorr and Cwatsat, and the obtained values were classified into 10%, 40%, and 80% according to Kroes’ methodology, as shown in Eqs. (5) and (6). The results, listed in Table 3, revealed that 3, 22 and 29 chemicals were classified as 10%, 40% and 80%, respectively. When values calculated according to Kroes’ methodology were compared with observed msDA values, 46.3% (25/54) of the calculated/observed msDA ratios were within twofold. For 40 chemicals with MW or Log Ko/w values ≤ 220 and ≤ 3.1, prediction of msDA was accurate to 52.5% (21/40) within twofold, as shown in Table 4.
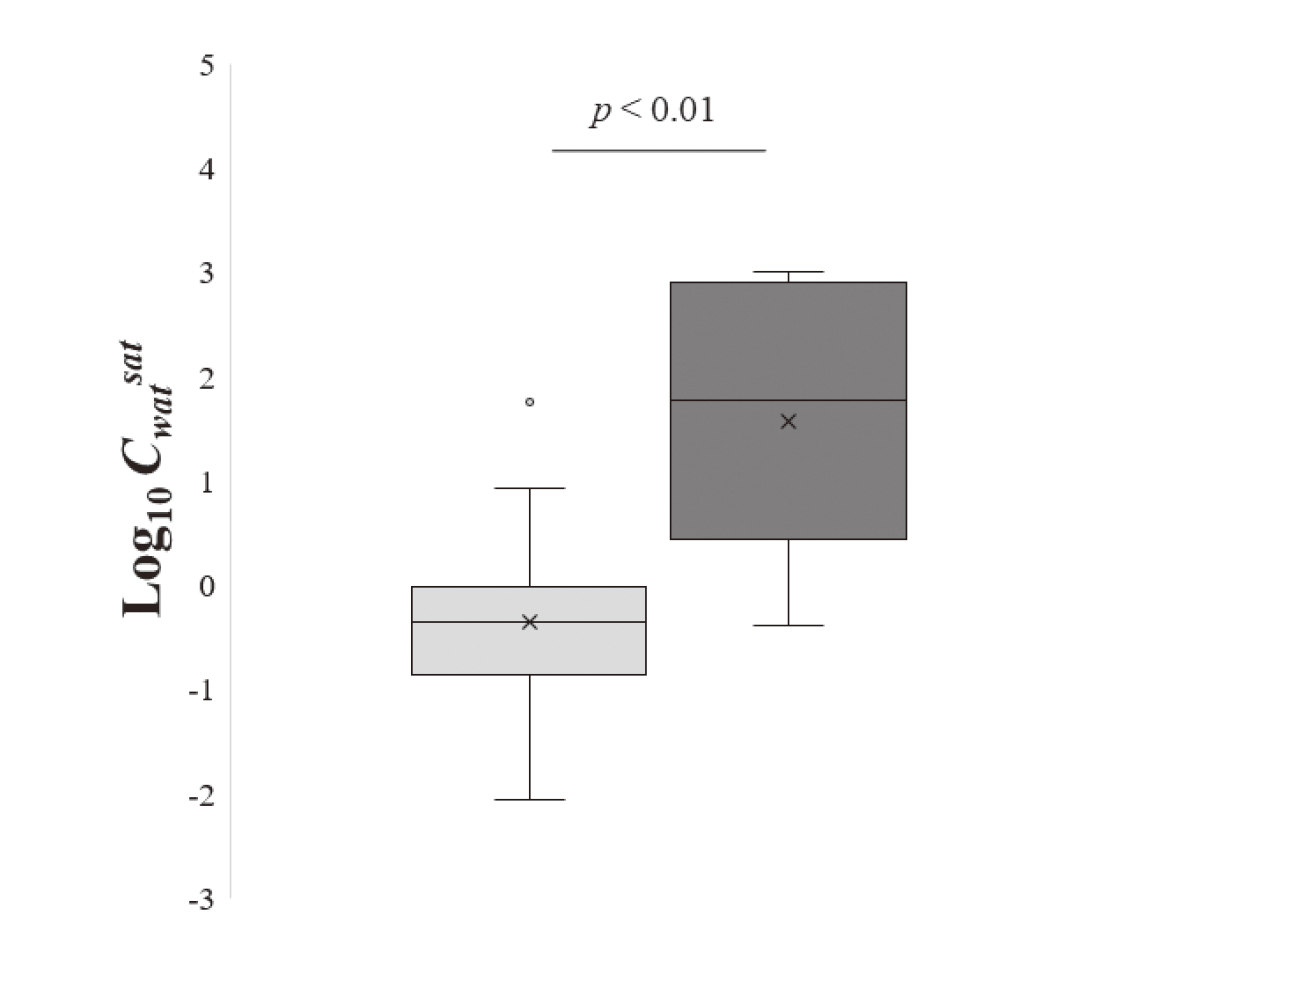
To clarify the differences in the predictive performance between IMAS and Kroes’ methodology, the Kroes’ methodology calculated values were then further assessed with a focus on chemical hydrophilicity. Certain water-soluble chemicals, including diethanolamine, kojic acid, and caffeine, were classified as 80% according to Kroes’ methodology (Table 3). However, their observed msDA values fell considerably below the 80% threshold. Given that Cwatsat influences the classification of msDA in Kroes’ methodology, as shown in Eq. (5), the msDA values from this methodology were re-evaluated based on Cwatsat. Upon comparing logarithmic Cwatsat values between the 40% and 80% groups for 40 chemicals with MW ≤ 220 and Log Ko/w ≤ 3.1, a significant difference emerged (Fig. 5). The maximum Cwatsat value in the 40% group was 57.0 mg/cm3 for isosorbide 5-mononitrate. Conversely, the 14 chemicals classified in the 80% group (diethanolamine, kojic acid, thioglycolic acid, 2-methylpentane-2, 4-diol, hydroquinone, resorcinol, 4-chlorobutyric acid, 3-O-ethyl-L-ascorbic acid, niacinamide, dihydroxyacetone, triethanolamine, 2-amino-2-methylpropanol, glycolic acid, N-acetyl-L-aspartic acid) exhibited Cwatsat values surpassing 57.0 mg/cm3. Compared between Kroes’ methodology–classified msDA values and the observed values, 78.6% (11/14) of the chemicals were classified as an overestimation, while only 21.4% (3/14) were classified as a good prediction. In contrast, IMAS showed that the predicted msDA values for 50.0% (7/14) of the chemicals were within twofold of the observed values (Table 4).
DISCUSSION
Our results showed that IMAS offers good predictive performance with an accuracy range of approximately twofold, and markedly mitigates the overestimation level of msDA for chemicals with high Cwatsat (> 57.0 mg/cm3) compared to Kroes’ methodology, suggesting that IMAS could be a valuable tool for predicting DAs for highly hydrophilic chemicals. To reliably predict DA, several mathematical models require at least partition (K) and diffusive (D) coefficients as parameters (Grégoire et al., 2021; Verma et al., 2023). However, few QSPR models provide reliable K and D predictions owing to limited datasets compared with Kp. The proposed IMAS methodology benefits from the application of well-studied QSPR models for predicting Kp.
Although it is assumed that lipophilic chemicals with Log Ko/w values of approximately 3–4 exhibit high skin permeability (Kroes et al., 2007; ECHA 2017), ECHA has indicated that chemicals with Cwatsat below 0.1 mg/cm3 tend to have lower dermal absorbability (ECHA, 2017). This phenomenon is attributed to the greater hydrophilicity of the viable epidermis and dermis compared with the stratum corneum, causing lipophilic chemicals to predominantly remain in the stratum corneum (Cleek and Bunge, 1993). Of eight chemicals with Log Ko/w > 3.1, 2-acetyl aminofluorene, benzyl salicylate, 4-bromophenyl isocyanate, triclosan and vitamin A had Cwatsat values < 0.1 mg/cm3 as well as low DA values. Conversely, IMAS showed convergence to approximately 100% in predicted msDA for these eight chemicals, revealing discrepancies between predicted and observed msDA values (Fig. 4B). Given that Log Ko/w is a crucial parameter in QSPR models (Potts and Guy, 1992; Baba et al., 2015; Zeng et al., 2021; Alves et al., 2015; Vecchia and Bunge, 2002), such models tend to show higher Kp and K values depending on Log Ko/w. Furthermore, our mathematical model assumes that the applied chemicals rapidly distribute into the stratum corneum without precipitation on the skin surface due to vehicle evaporation. Therefore, chemicals, especially those with low Cwatsat values, exhibited a higher msDA value when calculated using IMAS.
Upon comparing lipophilic chemicals (Log Ko/w > 3.1) with similar Log Ko/w and Cwatsat values, testosterone (MW = 288.43) exhibited lower msDA compared with benzophenone (MW = 188.22). Additionally, chemicals with large MWs (> 220) displayed overestimation of msDA when calculated using IMAS compared with observed values (Table 3). As mentioned in the Introduction section, MW influences the skin penetration rate, meaning that larger MW results in a longer duration to penetrate deep into the skin. In our model, the stratum corneum and applied formulation on the skin were regarded as a single compartment to simplify percutaneous absorption under finite dose conditions, and permeation through the stratum corneum based on the amount of distributed chemicals from the applied formulation was not considered (Fig. 1). Thus, model assumptions likely contributed to overestimation, particularly for chemicals with large MWs. Consequently, in the current context, we consider it appropriate to establish MW ≤ 220 and Log Ko/w ≤ 3.1 as the applicability domain of IMAS to mitigate overestimation.
IMAS underestimated the msDA of four chemicals by more than 2 times compared with the observed data. Isosorbide mononitrate, niacinamide, and 3-O-ethyl-L-ascorbic acid had cyclic structures with oxygen or nitrogen atoms. Parabens with a benzene ring are reported to have high permeability (Uchida et al., 2015). The benzene ring’s aliphatic nature makes it highly partitionable to the skin. Furthermore, the diffusivity of benzene rings in the skin is higher than chain-type structures with the same MW owing to the small molecular radius (Potts and Guy, 1992; Verma et al., 2023). Therefore, three chemicals which have cyclic structures are expected to have high permeability for the same reason as the benzene ring. However, oxygen and nitrogen atoms in cyclic structures likely decrease Log Ko/w values. Considering the importance of Log Ko/w in QSPR models, Kp values for the same three chemicals may be underestimated. Indeed, the ratio of observed to predicted Kp was 16 for isosorbide mononitrate. Supporting our hypothesis, kojic acid (Log Ko/w = −0.64) and caffeine (Log Ko/w = −0.09), containing oxygen or nitrogen atoms in cyclic structures, exhibited Kp values underestimated by approximately 3–4-fold. Additionally, water-soluble chemicals would become highly concentrated upon vehicle evaporation. Although the concentration gradient greatly influences skin permeability based on Fick’s law, our mathematical model could not consider the time-dependent concentration profile of target chemicals in the formulation. According to these reasons, the DAs of isosorbide mononitrate, niacinamide, 3-O-ethyl-L-ascorbic acid and 2-amino-2-methylpropanol might be underestimated by IMAS. To address the underestimation of msDA values, especially for water-soluble chemicals with cyclic structures, we propose applying an uncertainty factor of 2 to IMAS in risk assessments.
In the present study, we focused on the Potts and Guys model and ChemTunes model; however, changing QSPR models could enhance IMAS’s predictive performance. Additionally, following the read-across concept, applying toxicological information on analogs with similar physicochemical properties and structures to the target chemicals (ECHA, 2017) could help evaluate target chemicals’ msDA values.
In conclusion, we developed a novel methodology, IMAS that can predict msDA without conducting in vitro dermal absorption tests. Considering the dataset and results, 76.1 ≤ MW ≤ 220 and −1.4 ≤ Log Ko/w ≤ 3.1 serve as a guideline for IMAS’s applicability domain. Furthermore, regarding water-soluble chemicals (Cwatsat > 57.0 mg/cm3) classified as 80% msDA in Kroes’ methodology, IMAS can reliably predict msDA. Overall, our results suggest that IMAS can contribute to risk assessments for cosmetics and dermopharmaceutical products.
Conflict of interest
The authors declare that there is no conflict of interest.
REFERENCES
- Alves, V.M., Muratov, E., Fourches, D., Strickland, J., Kleinstreuer, N., Andrade, C.H. and Tropsha, A. (2015): Predicting chemically-induced skin reactions. Part II: QSAR models of skin permeability and the relationships between skin permeability and skin sensitization. Toxicol. Appl. Pharmacol., 284, 273-280.
- Ates, G., Steinmetz, F.P., Doktorova, T.Y., Madden, J.C. and Rogiers, V. (2016): Linking existing in vitro dermal absorption data to physicochemical properties: contribution to the design of a weight-of-evidence approach for the safety evaluation of cosmetic ingredients with low dermal bioavailability. Regul. Toxicol. Pharmacol., 76, 74-78.
- Atobe, T., Mori, M., Yamashita, F., Hashida, M. and Kouzuki, H. (2015): Artificial neural network analysis for predicting human percutaneous absorption taking account of vehicle properties. J. Toxicol. Sci., 40, 277-294.
- Baba, H., Takahara, J. and Mamitsuka, H. (2015): In silico predictions of human skin permeability using nonlinear quantitative structure–property relationship models. Pharm. Res., 32, 2360-2371.
- Buist, H.E., Schaafsma, G. and van de Sandt, J.J. (2009): Relative absorption and dermal loading of chemical substances: consequences for risk assessment. Regul. Toxicol. Pharmacol., 54, 221-228.
- Buist, H.E., van Burgsteden, J.A., Freidig, A.P., Maas, W.J. and van de Sandt, J.J. (2010): New in vitro dermal absorption database and the prediction of dermal absorption under finite conditions for risk assessment purposes. Regul. Toxicol. Pharmacol., 57, 200-209.
- Chen, L., Han, L. and Lian, G. (2013): Recent advances in predicting skin permeability of hydrophilic solutes. Adv. Drug Deliv. Rev., 65, 295-305.
- Cheng, T., Zhao, Y., Li, X., Lin, F., Xu, Y., Zhang, X., Li, Y., Wang, R. and Lai, L. (2007): Computation of octanol-water partition coefficients by guiding an additive model with knowledge. J. Chem. Inf. Model., 47, 2140-2148.
- Cleek, R.L. and Bunge, A.L. (1993): A new method for estimating dermal absorption from chemical exposure. 1. General approach. Pharm. Res., 10, 497-506.
- Cosmetic Ingredient Review. (1998): Final report on the safety assessment of glycolic acid, ammonium, calcium, potassium, and sodium glycolates, methyl, ethyl, propyl, and butyl glycolates, and lactic acid, ammonium, calcium, potassium, sodium, and TEA-lactates, methyl, ethyl, isopropyl, and butyl lactates, and lauryl, myristyl, and cetyl lactates. Int. J. Toxicol., 17 (Suppl. 1), 1-241.
- Cosmetic Ingredient Review. (2013): Safety Assessment of Triethanolamine and Triethanolamine-Containing Ingredients as Used in Cosmetics. Int. J. Toxicol., 32 (Suppl. 1), 59-83.
- Duracher, L., Visdal-Johnsen, L. and Mavon, A. (2015): In vitro and in vivo dermal absorption assessment of acetyl aspartic acid: a compartmental study. Int. J. Cosmet. Sci., 37 (Suppl 1), 34-40.
- ECHA. (2017): Guidance on Information Requirements and Chemical Safety Assessment: Chapter R.7c: Endpoint Specific Guidance. <https://echa.europa.eu/documents/10162/17224/information_requirements_r7c_en.pdf/e2e23a98-adb2-4573-b450-cc0dfa7988e5?t=1498476107907> (accessed 19. Dec. 2023)
- ECHA. (2017): Read-Across Assessment Framework (RAAF). <https://echa.europa.eu/documents/10162/13628/raaf_en.pdf/614e5d61-891d-4154-8a47-87efebd1851a> (accessed 19. Dec. 2023)
- Eleftheriadou, D., Luette, S. and Kneuer, C. (2019): In silico prediction of dermal absorption of pesticides - an evaluation of selected models against results from in vitro testing. SAR QSAR Environ. Res., 30, 561-585.
- Fini, A., Bassini, G., Monastero, A. and Cavallari, C. (2012): Diclofenac salts, VIII. Effect of the counterions on the permeation through porcine membrane from aqueous saturated solutions. Pharmaceutics, 4, 413-429.
- Franz, T.J. (1975): Percutaneous absorption on the relevance of in vitro data. J. Invest. Dermatol., 64, 190-195.
- Grégoire, S., Sorrell, I., Lange, D., Najjar, A., Schepky, A., Ellison, C., Troutman, J., Fabian, E., Duplan, H., Genies, C., Jacques-Jamin, C., Klaric, M. and Hewitt, N.J. (2021): Cosmetics Europe evaluation of 6 in silico skin penetration models. Comput. Toxicol., 19, 100177.
- Hewitt, N.J., Grégoire, S., Cubberley, R., Duplan, H., Eilstein, J., Ellison, C., Lester, C., Fabian, E., Fernandez, J., Géniès, C., Jacques-Jamin, C., Klaric, M., Rothe, H., Sorrell, I., Lange, D. and Schepky, A. (2020): Measurement of the penetration of 56 cosmetic relevant chemicals into and through human skin using a standardized protocol. J. Appl. Toxicol., 40, 403-415.
- Iliopoulos, F., Sil, B.C., Moore, D.J., Lucas, R.A. and Lane, M.E. (2019): 3-O-ethyl-l-ascorbic acid: characterisation and investigation of single solvent systems for delivery to the skin. Int. J. Pharm. X, 1, 100025.
- Kunita, R., Nishijima, T., Todo, H., Sugibayashi, K. and Sakaguchi, H. (2022): A mathematical approach using Strat-M® to predict the percutaneous absorption of chemicals under finite dose conditions. Pharmaceutics, 14, 1370.
- Kroes, R., Renwick, A.G., Feron, V., Galli, C.L., Gibney, M., Greim, H., Guy, R.H., Lhuguenot, J.C. and van de Sandt, J.J. (2007): Application of the threshold of toxicological concern (TTC) to the safety evaluation of cosmetic ingredients. Food Chem. Toxicol., 45, 2533-2562.
- Meylan, W.M. and Howard, P.H. (2000): Estimating log P with atom/fragments and water solubility with log P. Perspect. Drug Discov. Des., 19, 67-84.
- OECD. (2004): Organization for Economic Cooperation and Development. In Guidance Notes on Dermal Absorption; Series on Testing and Assessment Number 156; OECD Press: Paris, France, 2011.
- Potts, R.O. and Guy, R.H. (1992): Predicting skin permeability. Pharm. Res., 9, 663-669.
- SCCS. (2023): Scientific committee on consumer safety. SCCS/1647/22, the SCCS’s Notes of Guidance for the Testing of Cosmetic Ingredients and Their Safety Evaluation; 12th revision; Scientific Committee on Consumer Safety: Brussels, Belgium, 2023.
- SCCS. (2023): Opinion on Benzyl Salicylate (CAS No. 118-58-1, EC No. 204-262-9). SCCS/1656/23. <https://health.ec.europa.eu/system/files/2023-11/sccs_o_277.pdf> (accessed 19. Dec. 2023)
- SCCS. (2018): Opinion on Salicylic acid (CAS 69-72-7) Submission I. SCCS/1601/18. <https://health.ec.europa.eu/system/files/2021-08/sccs_o_223_0.pdf> (accessed 19. Dec. 2023)
- SCCS. (2022): Opinion on the safety of alpha-arbutin and beta-arbutin in cosmetic products. SCCS/1642/22. <https://health.ec.europa.eu/system/files/2023-02/sccs_o_264.pdf> (accessed 19. Dec. 2023)
- SCCS. (2021): REVISION of the scientific Opinion (SCCS/1576/16) on vitamin A (Retinol, Retinyl Acetate, Retinyl Palmitate). SCCS/1639/21. <https://health.ec.europa.eu/system/files/2023-08/sccs_o_261.pdf> (accessed 19. Dec. 2023)
- SCCS. (2012): Opinion on 2-Nitro-5-glyceryl methylaniline. SCCS/1477/12. <https://ec.europa.eu/health/scientific_committees/consumer_safety/docs/sccs_o_108.pdf> (accessed 19. Dec. 2023)
- SCCS. (2019): Opinion on Dihydroxyacetone - DHA (1,3-Dihydroxy-2-propanone) CAS No. 96-26-4. SCCS/1612/19. <https://health.ec.europa.eu/system/files/2021-11/sccs_o_234.pdf> (accessed 19. Dec. 2023)
- SCCS. (2019): Opinion on Methoxypropylamino Cyclohexenylidene Ethoxyethylcyanoacetate (S87) Submission II. SCCS/1605/19. <https://health.ec.europa.eu/system/files/2021-08/sccs_o_227_0.pdf> (accessed 19. Dec. 2023)
- SCCS. (2019): Opinion on Hydroxyisohexyl 3-cyclohexene carboxaldehyde (HICC). SCCP/1456/11. <https://ec.europa.eu/health/scientific_committees/consumer_safety/docs/sccs_o_074.pdf> (accessed 19. Dec. 2023)
- Shen, J., Kromidas, L., Schultz, T. and Bhatia, S. (2014): An in silico skin absorption model for fragrance materials. Food Chem. Toxicol., 74, 164-176.
- Uchida, T., Kadhum, W.R., Kanai, S., Todo, H., Oshizaka, T. and Sugibayashi, K. (2015): Prediction of skin permeation by chemical compounds using the artificial membrane, Strat-M™. Eur. J. Pharm. Sci., 67, 113-118.
- Vecchia, B.E. and Bunge, A.L. (2002): Partitioning of chemicals into skin: Results and predictions. Chapter 4 in Transdermal Drug Delivery, edited by Guy, R.H. and Hadgraft, J., Publisher Marcel Dekker.
- Verma, N., Gajula, K., Gupta, R. and Rai, B. (2023): Multiscale modeling of molecule transport through skin’s deeper layers. Comput. Toxicol., 26, 100267.
- Yang, C., Rathman, J.F., Bienfait, B., Burbank, M., Detroyer, A., Enoch, S.J., Firman, J.W., Gutsell, S., Hewitt, N.J., Hobocienski, B., Kenna, G., Madden, J.C., Magdziarz, T., Marusczyk, J., Mostrag-Szlichtyng, A., Krueger, C.T., Lester, C., Mahoney, C., Najjar, A., Ouedraogo, G., Przybylak, K.R., Ribeiro, J.V. and Cronin, M.T. (2023): The role of a molecular informatics platform to support next generation risk assessment. Comput. Toxicol., 26, 100272.
- Zeng, R., Deng, J., Dang, L. and Yu, X. (2021): Correlation between the structure and skin permeability of compounds. Sci. Rep., 11, 10076.
;%0A%09%09%09newWindow.document.open();%0A%09%09%09newWindow.document.write('<img src=%22./Graphics/49_219-t1.jpg%22>');%0A%09%09%09newWindow.document.close();%0A%09%09)
;%0A%09%09%09newWindow.document.open();%0A%09%09%09newWindow.document.write('<img src=%22./Graphics/49_219-t2.jpg%22>');%0A%09%09%09newWindow.document.close();%0A%09%09)
;%0A%09%09%09newWindow.document.open();%0A%09%09%09newWindow.document.write('<img src=%22./Graphics/49_219-t3.jpg%22>');%0A%09%09%09newWindow.document.close();%0A%09%09)


;%0A%09%09%09newWindow.document.open();%0A%09%09%09newWindow.document.write('<img src=%22./Graphics/49_219-t4.jpg%22>');%0A%09%09%09newWindow.document.close();%0A%09%09)