Abstract
The internalization mechanism of microplastics (MPs) into human cells has attracted considerable attention because these mechanisms are closely related to the physical and chemical properties of MPs. This study examined the response of human colon cells to autophagy, ER stress, and inflammation during the regulation on the internalization of polystyrene (PS)-MPs (0.4-0.6 μm size). To achieve this, changes in their key markers were analyzed in MPs-treated SNU-1826 cells after a cotreatment with uptake inhibitors or stimulators. The internalization of MPs was significantly higher in SNU-1826 cells than in other cells originated from differential tissues, such as the small intestine, kidneys, and nerves. On the other hand, the internalization of MPs into SNU-1826 cells was suppressed by cytochalasin D (CD) but not by pitstop (Pt). During this inhibition, the levels of the key parameters for autophagy (Light Chain 3-I/II (LC3-I/II) and Beclin1), ER stress (eukaryotic translation initiation factor 2 subunit alpha (EIF2α) and inositol-requiring kinase 1 alpha (IRE1α)), and inflammation (inducible nitric oxide synthase (iNOS), cyclooxygenase 2 (COX-2), tumor necrosis factor alpha (TNF-α), and interleukin (IL)-6) were suppressed in MPs+CD-treated SNU-1826 cells. In addition, the internalization of MPs into SNU-1826 cells was stimulated by a ZnSO4 treatment, not by CaCl2. These stimulation effects were reflected in the alteration of the critical parameters for autophagy, ER stress, and inflammation. Furthermore, the positive correlation was detected between MPs internalization and most parameters for cellular responses although their inhibition is stronger than stimulation. These results suggest that the internalization of MPs into SNU-1826 cells may be strongly associated with the changes in autophagy, ER stress, and inflammation during the regulation of CD and ZnSO4.
INTRODUCTION
The body of humans is exposed to microplastics (MPs) of various sizes and types through the ingestion of food or water, inhalation of air containing MPs, penetration of wounded skin, and other routes (Park et al., 2020). However, scientific evidence of the mechanisms of MPs internalization into specific cells and the subsequential cellular response to MPs has not been sufficiently provided until now because they have unique characteristics, abundances, diversity of size, cell permeability, and toxicological effects in cells derived from different tissues (Khan and Jia, 2023). In spite of that, several significant toxic and pathological effects of MPs have been detected in human cells. Among them, the most detected effect of MPs is the stimulation of ROS production for oxidative stress in various cells, including glioblastoma, cervical adenocarcinoma, mast cells, basophilic leukemia, epithelial cells, and fibroblasts (Schirinzi et al., 2017; Hwang et al., 2019; Dong et al., 2020; Poma et al., 2019). In addition, the significant promotion effects of MPs on the inflammatory response were identified in a few immune cells and epithelial cells (Prietl et al., 2014; Hwang et al., 2019; Xu et al., 2019; Li et al., 2023). Furthermore, an MP treatment induced the dysfunction of other cell metabolisms, including disruption of mitochondria membrane potential and epithelial layer, arrest of the cell cycle, autophagic and endoplasmic reticulum (ER)-stress-related metabolic changes and digestive toxicity (Lim et al., 2019; Xu et al., 2019; Wu et al., 2010; Dong et al., 2020; Yin et al., 2023). Therefore, further studies are needed to provide information on the differential response of human cells to MPs under various conditions.
MPs have been reported to enter human cells by disrupting the cell membrane integrity or are internalized without affecting the cell membrane integrity (Powell et al., 2007). During these processes, MPs interact with membrane transporters and use various molecular pathways associated with cellular metabolism (Xu et al., 2021). Among them, non-phagocytic cells generally use three pathways: clathrin and caveolae-mediated endocytosis, clathrin and caveolae-independent endocytosis, and micropinocytosis. Also, the adenosine triphosphate (ATP)-independent pathway and passive translocation have also been reported as rare pathways (Liu et al., 2021; Fiorentino et al., 2015). Especially, Caco-2 cells, human epithelial cells, internalize MPs through clathrin-mediated endocytosis and micropinocytosis (Xu et al., 2021). In addition, MPs with 50 nm and 500 nm are internalized into rat basophilic leukemia (RBL)-2H3 cells using clathrin and caveolae-mediated endocytosis (Liu et al., 2021). Many internalizing large particles (500 nm) were internalized by micropinocytosis as one of major pathways (Liu et al., 2021). However, the cell types used in the internalization study of MPs are very limited despite many studies for their mechanisms. Moreover, no studies have provided scientific evidence for the cellular response to them during the differential regulation of MPs internalization.
In this study, we investigated the cellular responses of SNU-1826 cells on the autophagy, ER stress, and inflammation to MPs internalization after treatment with suppressor or stimulator. Also, our study further analyzed the correlation between MPs internalization and parameters for cellular responses.
MATERIALS AND METHODS
Preparation of MPs
The dispersed MPs suspension used in this study was provided by Sigma–Aldrich Co. (St. Louis, MO, USA). The morphology and size of MPs were examined using SEM/EDX spectroscopy (JEOL Ltd., Tokyo, Japan), fluorescence microscope (Evos m5000, Thermo Fisher Scientific Inc., Waltham, MA, USA) and the Zetasizer Nano ZS90 (Malvern Instruments Inc., Malvern, UK). They comprised red color polystyrene (PS) materials and showed a mean diameter size and density of 0.4-0.6 μm and 1.04-1.06 g/cm3, respectively, at 25 mg/mL in water. In addition, these circular-shaped particles showed a specific number–distribution size (607.23 ± 8.27 d.nm) and zeta potential (−35.52 ± 1.18 mV) as described elsewhere (Park et al., 2021; Roh et al., 2024) (Fig. 1).
Cell culture and treatment with MPs
We used cell lines derived from four different tissues including small intestine, colon, kidney and neuron to analyze the effect of MPs on the autophagy, ER stress, and inflammation after internalization. The small intestine and colon tissue were chosen because they are the main routes through which orally administered MPs are absorbed into the body (Hirt and Body-Malapel, 2020; Wang et al., 2025). Also, the kidneys are the main organs that filter and excrete blood-derived MPs, and the nerves are the main target of neurotoxicity induced by MPs (Meng et al., 2022; Zheng et al., 2024). The following four types of cells were obtained from the American Type Culture Collection (Manassas, VA, USA) or Korean Cell Line Bank (Seoul, Korea): IEC-18 (an epithelial cell line isolated from the ileum of a patient's small intestine), SNU-1826 (human colon cells carcinoma), HEK-293 (immortalized human embryonic kidney cells), and SK-N-MC (human neuroblastoma). The cells were cultured in different media, including RPMI1640 (Welgene, Gyeongsan‐si, Korea) for SNU-1826 cells, Modified Eagle's Medium (MEM, Welgene) for HEK-293 cells, Dulbecco Modified Eagle's Medium (DMEM, Welgene) for SK-N-MC and IEC18 cells supplemented with 10% fetal bovine serum (FBS, Welgene), L‐glutamine, penicillin, and streptomycin (Thermo Fisher Scientific Inc.), in a humidified incubator containing 5% CO2 and 95% fresh air at 37°C.
The internalization rate of MPs into each cell line was measured by growing the cells to more than 80-90% confluence in a six-well plate and treated with 0.001 wt.% MPs for 12 hr and 24 hr. Subsequently, MPs remaining in the culture medium were removed and washed three times with a 1 × PBS solution. Finally, the distribution of MPs within each cell was observed under a fluorescence microscope (Evos m5000, Thermo Fisher Scientific Inc.), and their number was counted in two fields of view (67,500 mm2) per well.
The optimal conditions of two inhibitors including cytochalasin D (CD) and pitstop 2 (Pt2) were determined based on the results of previous studies (Mortensen and Larsson, 2003; Willox et al., 2014). The optimal inhibiting conditions for MP internalization were established by treating the 80-90% confluent cells with 1 μM cytochalasin D (CD) for 1 hr or 20 μM pitstop 2 (Pt2) for 30 min, followed by 0.001 wt.% MPs for 12 hr or 24 hr. Subsequently, MPs remaining in the culture medium were removed and washed three times with 1 × PBS solution. Finally, the distribution of MPs within each cell was observed under a fluorescence microscope (Evos m5000, Thermo Fisher Scientific Inc.). Their number was counted in two fields of view (67,500 mm2) in each well. In addition, total cells of each well were harvested and used for further analysis.
The optimal conditions of two stimulators including ZnSO4 and CaCl2 were determined based on the results of previous study and our preliminary data (Wu et al., 2010) (Supplement Fig. S1). The optimal stimulating conditions of MPs internalization were established by briefly treating the 80-90% confluent cells were briefly treated with 0.5, 5, or 50 μM ZnSO4 or 5, 50, or 500 μM CaCl2 for 1 hr, followed by 0.001 wt.% MPs for 12 hr or 24 hr. Subsequently, MPs remaining in the culture medium were removed and washed three times with 1 × PBS solution. Total cells from each well were then harvested and used for further analysis.
To measure the intracellular uptake of MP, the red color for MPs in each well washed with 1× PBS solution was observed under a fluorescence microscope (Evos m5000, Thermo Fisher Scientific Inc.) at 400 × magnification compared to well of Vehicle group. The number of uptaken MPs was counted in two fields of view (67,500 mm2) in each group.
Quantitative reverse transcription polymerase chain reaction (RT-qPCR) analysis
The mRNA levels of tumor necrosis factor alpha (TNF)‐α and interleukin (IL)‐6 genes were measured by RT‐qPCR as described elsewhere (Lee et al., 2020). Briefly, the total RNA molecules were purified from the cultured cells using RNAzol (Tel‐Test Inc., Friendswood, TX, USA). After quantifying the RNA using a NanoDrop system (Shimadzu Biotech, Kyoto, Japan), the complement DNA (cDNA) was synthesized using a mixture of the total RNA (5 μg), oligo‐dT primer (Invitrogen, Carlsbad, CA, USA), deoxynucleotide triphosphate (dNTP), and reverse transcriptase (Superscript II, Invitrogen) in a reaction carried out at 42°C for 50 min, followed by enzyme inactivation at 70°C for 15 min. qPCR was conducted with a cDNA template and 2 × Power SYBR Green (Toyobo Co., Osaka, Japan) using the following cycles: 15 sec at 95°C, 30 sec at 55°C, and 60 sec at 70°C. Target regions of TNF-α and IL-6 genes were amplified using specific primers (Table 1). The fluorescence intensity was monitored during amplification, and the threshold cycle (Ct) value was determined as the cycle number at which the fluorescence exceeded the set threshold during the exponential phase. Relative expression levels of TNF-α and IL-6 were calculated using the 2^(-ΔΔCt) method (Livak and Schmittgen, 2001; Lu et al., 2024), with β-actin serving as the internal reference gene.
Table 1. Primer sequences for RT-qPCR analysis.
| Primer name |
Sequence (from 5’ to 3’) |
| TNF-α |
|
Forward
Reverse |
CCTGTAGCCCACGTCGTAGC
TTGACCTCAGCGCTGACTTG |
| IL-6 |
|
Forward
Reverse |
TTGGGACTGATGTTGTTGACA
TCATCGCTGTTGATACAATCAGA |
| β-actin |
|
Forward
Reverse |
TGGAATCCTGTGGCATCCATGAAAC
TAAAACGCAGCTCAGTAACAGTCCG |
Western blot analysis
For the Western blot assay, the total protein of cells in each treated group was extracted using the Pro‐Prep Protein Extraction Solution (iNtRON Biotechnology, Seongnam, Korea), followed by quantification using a SMARTTM BCA Protein Assay Kit (Thermo Fisher Scientific Inc.). Equal amounts of total proteins (30 μg) were loaded and separated by 4-20% sodium dodecyl sulfate–polyacrylamide gel electrophoresis (SDS‐PAGE) for 2 hr. The resolved proteins were transferred to nitrocellulose membranes for 2 hr at 40 V. Each membrane was incubated separately overnight at 4°C with the following primary antibodies, diluted to 1:1,000: anti‐ Light Chain 3-I/II (LC3-I/II) antibody (Cell Signaling Technology, Danvers, MA, USA), anti‐Beclin1 antibody (Cell Signaling Technology), anti‐eukaryotic translation initiation factor 2 subunit alpha (EIF2α) antibody (Cell Signaling Technology), anti‐p‐EIF2α antibody (Cell Signaling Technology), anti‐ inositol-requiring kinase 1 alpha (IRE1α) antibody (Novus Biologicals, Centennial, CO, USA), anti-inducible nitric oxide synthase (iNOS) (Cell Signaling Technology), anti-cyclooxygenase 2 (COX-2) (Cell Signaling Technology), and anti‐β‐actin antibody (Cell Signaling Technology). To ensure loading the same amount of protein in each lane, β-actin was used as an endogenous control for normalization. The antibody-bound membranes were washed with washing buffer (137 mM NaCl, 2.7 mM KCl, 10 mM Na2HPO4, and 0.05% Tween 20) and incubated with 1:2,000 diluted horseradish peroxidase (HRP)‐conjugated goat anti‐rabbit IgG (Invitrogen) at room temperature for 1 hr. Finally, the membrane blots were developed using Amersham ECL Select Western Blotting detection reagent (GE Healthcare, Little Chalfont, UK). The chemiluminescence signals originating from the specific bands were detected using a FluorChemi®FC2 (Alpha Innotech Co., San Leandro, CA, USA).
Transmission Electron Microscopy (TEM) Analysis
TEM analysis of SNU-1826 cells was performed according to the method described in a previous study (Kim et al., 2019). SNU-1826 cells were fixed in a 2.5% glutaraldehyde solution, washed with 1× PBS, and dehydrated using a graded series of ethanol concentrations. They were then post-fixed with 1% osmium tetroxide (OsO4) for 1-2 hr at room temperature and embedded in Epon 812 resin (Polysciences, Hirschberg an der Bergstrasse, Germany). Ultra-thin cell sections (70 nm thick) were placed on a holey formvar-carbon coated grid, followed by negative staining with uranyl acetate and lead citrate. The cellular morphology was analyzed using a TEM (Hitachi, Tokyo, Japan).
Statistical significance and correlation analysis
The statistical significance was evaluated using a one‐way analysis of variance (ANOVA) (SPSS for Windows, Release 10.10, Standard Version, Chicago, IL, USA) followed by a Tukey's post hoc t‐test for multiple comparisons. The correlogram data were processed using R version 4.3.3. A correlogram was drawn using the package corrplot from R. The correlation between the concentrations of internalized MPs number and other parameters was performed using Pearson's bivariate correlation coefficient in R. The results are represented as a scatterplot for the two variables. All values are reported as the mean ± SD. A p-value < 0.05 was considered significant.
RESULTS
Selection of SNU-1826 cells with high internalization pattern of MPs
First, we investigated whether there was a difference in the internalization ability of MPs between four cells originated from different tissues. To achieve this, average number of internalized MPs was counted in IEC18 (epithelial), SNU-1926 (colon), HEK-293 (kidney), and SK-N-MC (neuroblastoma) cells after MPs treatment for two different times. After treatment for 12 hr, the average number of internalized MPs was higher in IEC18 and SNU-1826 cells than in HEK-293 and SK-N-MC cells. These patterns of MPs were also maintained in the 24 hr-treated group (Fig. 2A and Supplement Fig. S2). Also, the internalizing pattern of MPs into each cell differs between the four cell lines. MPs were intensively concentrated in a few specific regions of the cytoplasm of HEK-293 and IEC18 cells, but they were spread throughout the cytoplasm of SNU-1826 and SK-N-MC cells (Fig. 2A). On the other hand, a time-dependent pattern was detected in SNU-1826, HEK-293, and SK-N-MC cells, while IEC18 cells were constantly maintained. HEK-293 cells showed the highest increase rate of MP internalization from 12 hr to 24 hr. In particular, the total number of internalized MPs was greatest in SNU-1826 cells among four analyzed cells, even though SK-N-MC cells showed the lowest level (Fig. 2B). These internalizations of MPs in SNU-1826 cells were successfully reflected on the TEM images (Fig. 2C). Therefore, these results show that the rate of MP internalization may differ between cells with different tissue origins. Furthermore, our data suggest that SNU-1826 cells are suitable for studying the cellular response during regulating MPs internalization.

The appropriate inhibitor that suppresses the internalization of MPs into SNU-1826 cells was determined by counting the average number of internalized MPs in SNU-1826 cells pretreated with CD, inhibitor of actin polymerization or Pt2, clathrin inhibitor after MPs treatment. The number of internalized MPs decreased significantly in the CD+MP-treated SNU-1826 cells for 12 hr and 24 hr, while the Pt2+MPs-treated group remained at a level similar to that of the Vehicle-treated group (Fig. 3). These results suggest that the internalization of MPs into SNU-1826 cells can be mediated by actin-dependent uptake mechanisms, and CD can be considered an inhibitor of this internalization.
Response of SNU-1826 cells on the autophagy, ER stress, and inflammation during the suppression of MPs internalization
Next, we investigated whether the inhibition of MPs internalization caused by actin polymerization inhibitors is accompanied by changes in autophagy, ER stress, and inflammation. To achieve this, changes in the levels of their key parameters were analyzed in CD+MP-treated SNU-1826 cells. First, the expression levels of the LC3-I/II and Beclin1 proteins as markers for autophagy were higher in the Vehicle+MP-treated group compared to the No-treated group. On the other hand, these levels were reduced remarkably after CD pretreatment (Fig. 4). In addition, significant changes were detected in the EIF2α and IRE1α expression levels, but they showed opposite patterns. The decreased levels of EIF2α phosphorylation in the Vehicle+MP-treated group were enhanced in the CD+MPs-treated group, while the increased level of IRE1α expression was recovered in the same group (Fig. 5). Furthermore, the expression levels of iNOS and COX-2 proteins and the transcription levels of TNF-α and IL-6, were remarkably recovered in the CD+MPs-treated group compared to the Vehicle+MP-treated group (Figs. 6 and 7). These results show that the inhibition of MP internalization caused by actin polymerization inhibitors may be associated with the significant recovery of MPs effects on the autophagy, ER stress, and inflammation in SNU-1826 cells.

To identify an appropriate stimulator that promotes the internalization of MPs into SNU-1826 cells, average number of internalized MPs was counted in ZnSO4 or CaCl2-pretreated SNU-1826 cells after the MP treatment. Among them, only ZnSO4 showed significant stimulation effects in the internalization of MPs into SNU-1826 cells, but CaCl2 did not induce any response. In addition, ZnSO4 showed time- and dose-dependent effects (Fig. 8A and B). The highest internalization pattern of MPs was observed in the ZnSO4+HiMPs-treated group for 48 hr (Fig. 8A). Therefore, these results suggest that ZnSO4 may be considered an optimal stimulator for MPs internalization into SNU-1826 cells.
Response of SNU-1826 cells on the autophagy, ER stress, and inflammation during the stimulation of MPs internalization
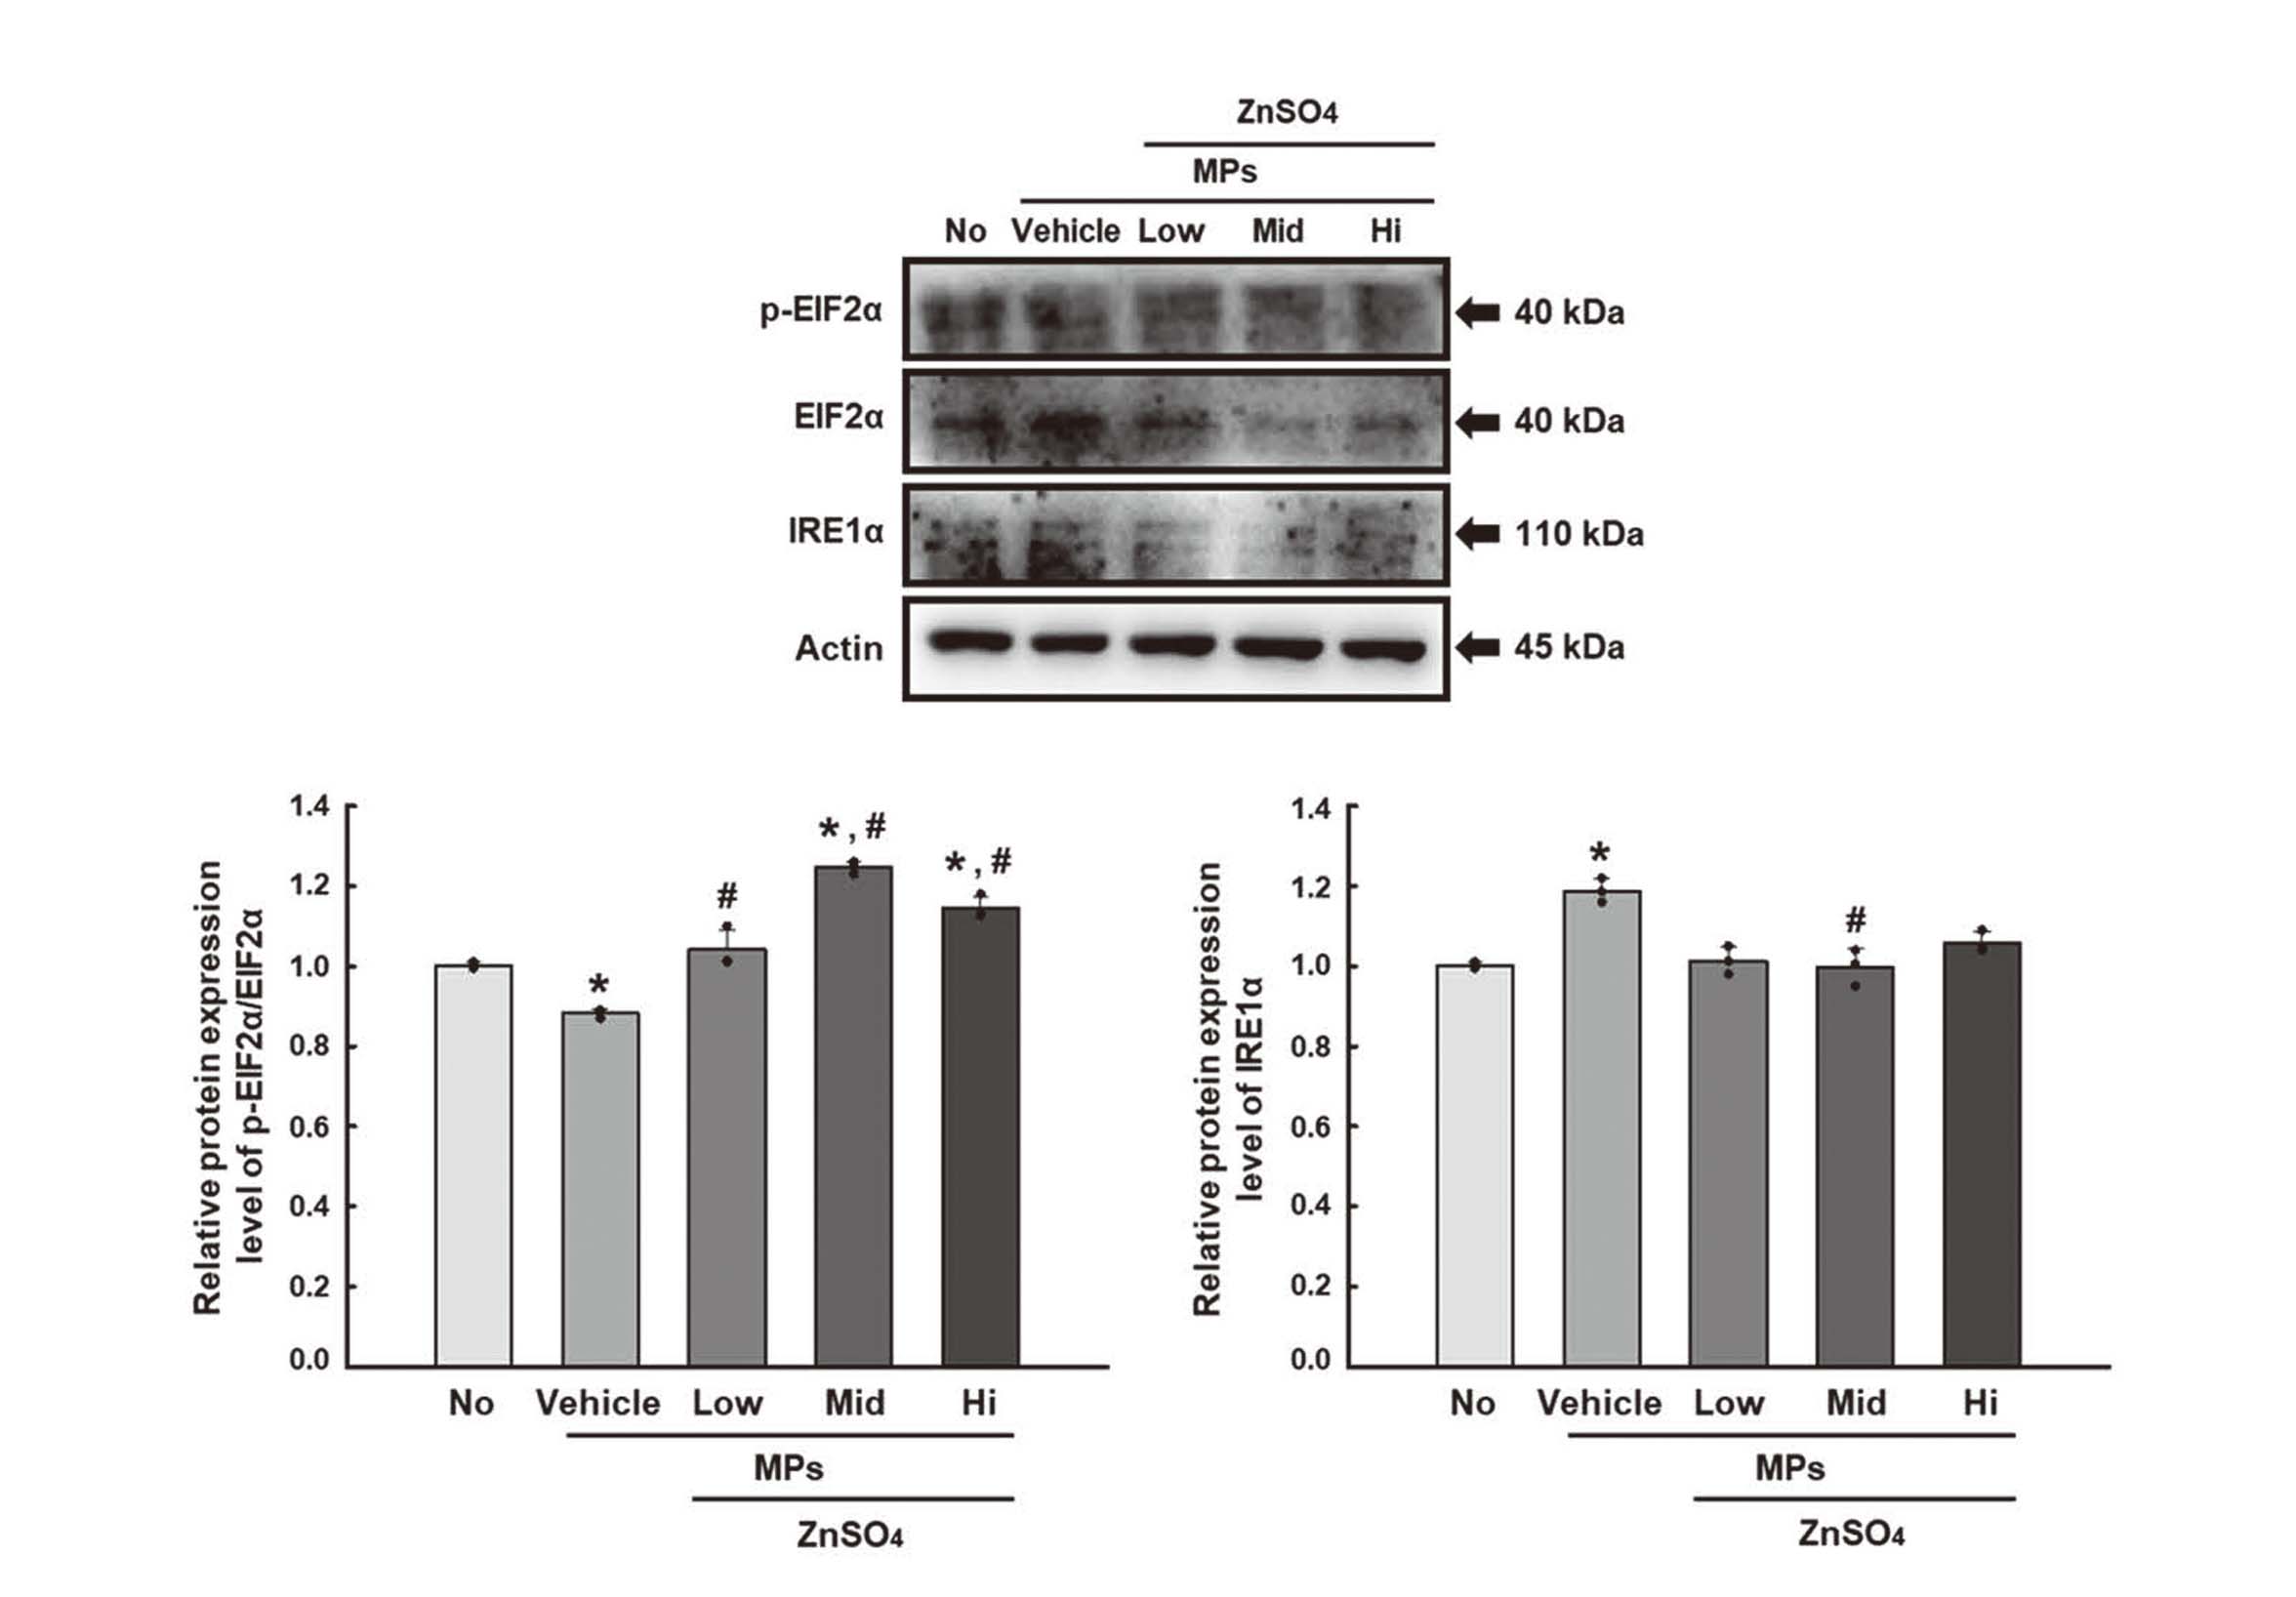
Next, this study investigated whether stimulation of MPs internalization caused by ZnSO4 is accompanied by changes in autophagy, ER stress, and inflammation. The changes in the levels of their key parameters were analyzed in ZnSO4+MP-treated SNU-1826 cells. The expression levels of the LC3-I/II and Beclin1 proteins were significantly higher in the ZnSO4+MPs-treated SNU-1826 cells in a dose-dependent manner compared to the Vehicle+MPs-treated group (Fig. 9). The upregulation of Beclin1 was higher than that of LC3-I/II after ZnSO4 treatment. In addition, significant alterations were detected in the parameters for ER stress. The phosphorylation of EIF2α was increased in ZnSO4+MPs-treated SNU-1826 cells, while the level of IRE1α expression decreased in the same group (Fig. 10). Furthermore, the levels of iNOS and COX-2 expression were also higher in the ZnSO4+MPs-treated SNU-1826 cells than in the Vehicle+MPs-treated group (Fig. 11). The iNOS and COX-2 results were partially reflected in the transcription levels of TNF-α and IL-6 (Fig. 12). These results suggest that the MP internalization caused by the ZnSO4 treatment may be associated with autophagy, ER stress, and inflammation in SNU-1826 cells. Also, our results show that the effects of MPs internalization on the cellular responses can be recovered by ZnSO4 treatment.


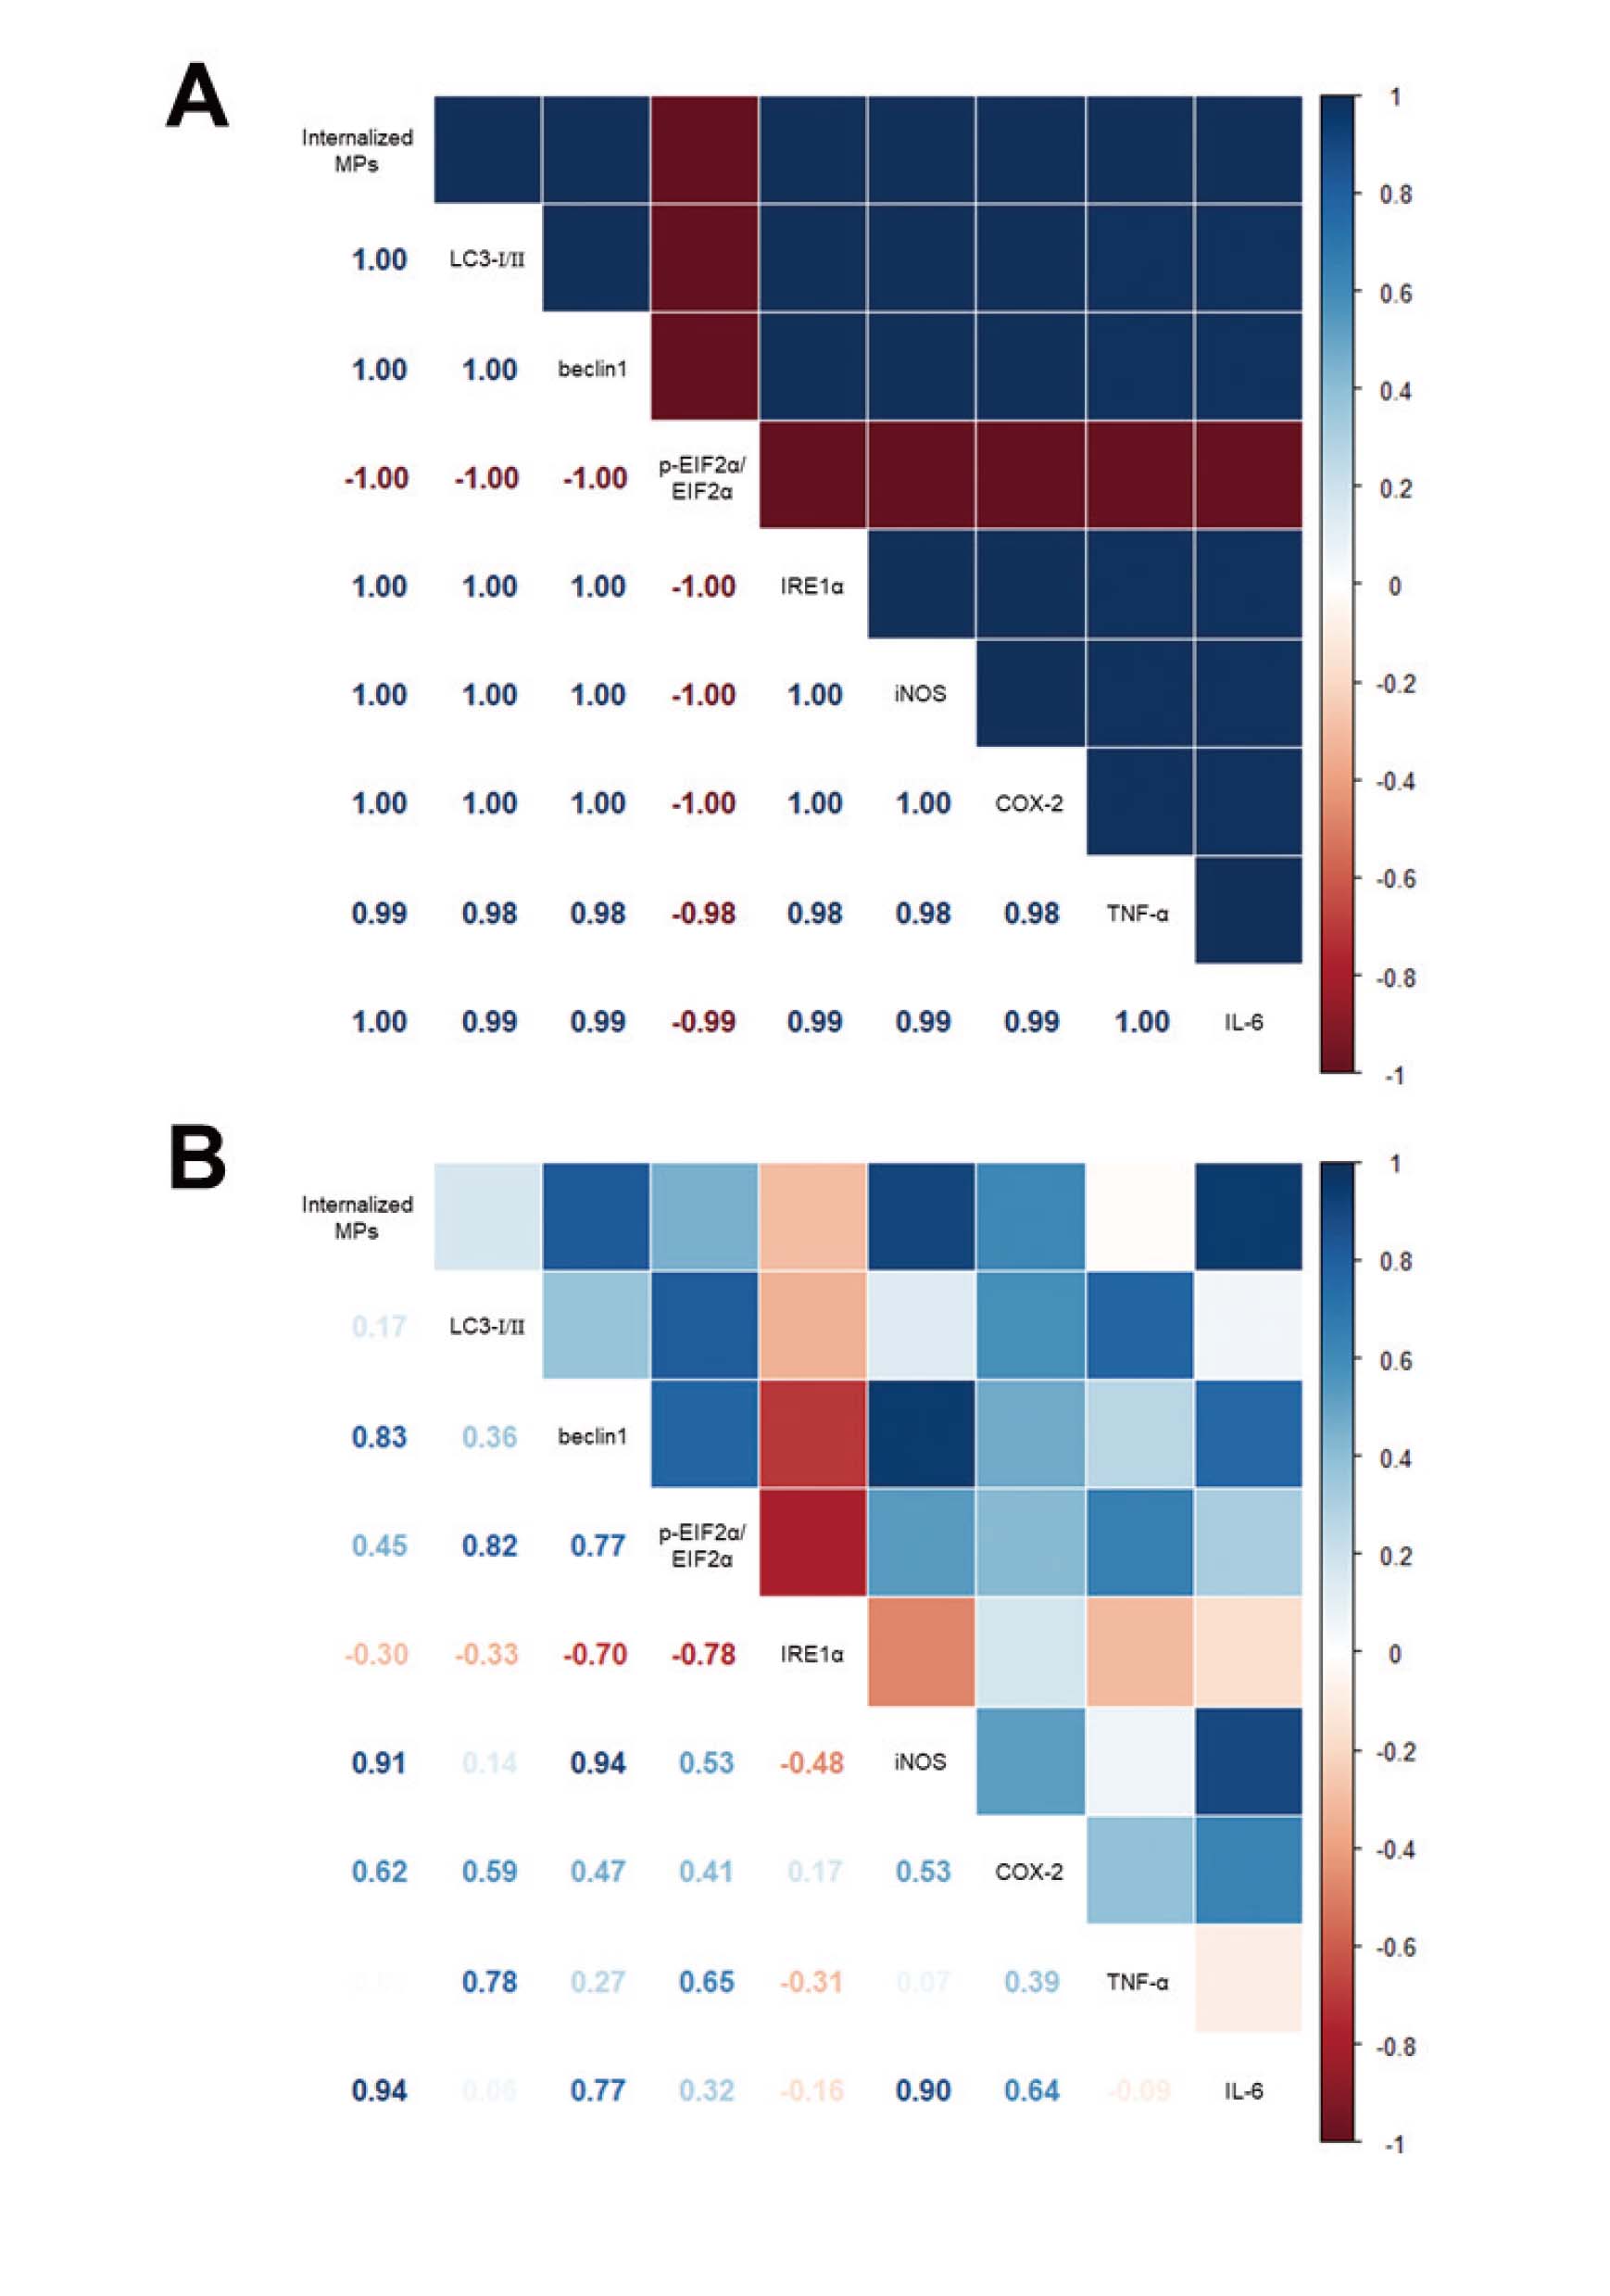
Finally, we tried to determine how the MPs internalization and cellular response of SNU-1826 cells correlate. To achieve this, all data were analyzed using Pearson’s bivariate correlation coefficient. As shown in Fig. 13A, most parameters for the cellular responses have a strong relationship with the internalized number of MPs after the CD treatment, an endocytosis inhibitor, even though one parameter, the p-EIF2α/EIF2α levels, showed a negative correlation. Especially, their coefficient was mostly close to 1. In addition, a similar positive relationship was detected between the stimulator treatment for MPs internalization and the key parameters for the cellular responses. Most parameters except IRE1α were positively correlated with internalized number of MPs (Fig. 13B). However, these positive correlations were stronger in CD inhibitor than ZnSO4 stimulator. These results show that regulating MP internalization may be closely linked to the key parameters of autophagy, ER stress, and inflammation. In addition, MP internalization regulated by CD inhibitors is related more closely to the cellular responses than the ZnSO4 stimulator.
DISCUSSION
As conflicting research results on the cellular responses to MPs in several human cells are continuously reported, various studies providing scientific evidence are required to solve this issue (Yong et al., 2020). Recent studies have focused on the cell responses of MPs of various sizes under complex conditions rather than a simple treatment with MPs because MPs have more serious effects under pathological conditions (Khan and Jia, 2023). Therefore, this study examined the cellular responses of SNU-1826 cells during the inhibition and stimulation of MPs internalization. The analyses of their responses were concentrated on ER stress, autophagy, and inflammation, as described elsewhere (Wang et al., 2021). These results provide novel evidence that the internalization of MPs into SNU-1826 cells can be inhibited or stimulated by the CD and ZnSO4 treatment. These regulations may be tightly linked to ER stress, autophagy, and inflammation, but the correlation between MPs internalizations and cellular response was greater in the CD-treated group than in the ZnSO4 treated group.
The internalization of MPs has been analyzed in various human cells even though their analytical targets varied in each cell. MPs with 40-100 nm size were internalized into epithelial cells derived from different tissues, including human umbilical vein endothelial cells (HUVECs), intestine (Caco-2), gastrin (GES-1), and oviduct (BOEC) (Xu et al., 2021; Lu et al., 2022; Qin et al., 2022; Liu et al., 2021; Fiorentino et al., 2015). In addition, human liver cells (HL7702) and embryonic kidney cells (HEK293) took up small MPs from 0.1 to 3.54 μm size, while MPs, 100-1,000 nm in size, were internalized into pluripotent stem cells (Sokmen et al., 2020; Chen et al., 2022; Jeong et al., 2022). Other cells, including fibroblasts, mononuclear cells, red blood cells, mast cells, and gastric adenocarcinoma cells, were internalized by various size MPs through endocytosis and phagocytosis (Hwang et al., 2020; Forte et al., 2016). In this study, MPs, 500 nm in size, were significantly internalized into IEC-18, SNU-1826, HEK-293, and SK-N-MC cells. On the other hand, the highest efficacy was detected in SNU-1826 cells, followed by IEC-18, HEK-293, and SK-N-MC cells. The results showing the internalization of MPs into epithelial cells and kidney cells were similar to those of previous studies, even though the size of MPs was different. Furthermore, the results of the present study provide the first evidence of the internalization of MPs into SNU-1826 and SK-N-MC cells. However, in our study, the analyzing the response of cells by treating a high concentration of MPs once can be considered as a limitation because different cells have different doubling times, metabolic rates, growth factors and cell cycle progression (Schmitz et al., 2019).
Mammalian cells can internalize a large or polarized particle through the cell membranes, which can also use the internalization of MPs without affecting cell membrane integrity (Powell et al., 2007). Until now, several machines for MP internalization have been investigated in non-phagocytic cells. ATP-independent pathway and passive translocation were first reported as an internalization mechanism of MPs, 43.67 nm size (Fiorentino et al., 2015). Micropinocytosis and clathrin-mediated endocytosis in Caco-2 cells were investigated as the main routes for internalizing some modified MPs with 100 nm size (Xu et al., 2021). In addition, similar mechanisms were detected in basophilic leukemia (RBL-2H3) cells after treatment with 50 nm and 500 nm MPs, even though they interacted with lysosomes and were released through lysosomal-mediated exocytosis (Liu et al., 2021). MPs 44 and 100 nm in size were internalized into AGS cells via clathrin-mediated endocytosis and accumulated into the cytoplasm of these cells (Forte et al., 2016). On the other hand, endocytosis and phagocytosis were used to internalize MPs into various types of cells, including HDFs, PBMCs, and HMC-1 (Hwang et al., 2020). In this study, we focused on inhibiting and stimulating the mechanism for MPs internalization into SNU-1826 cells. Two endocytosis inhibitors, CD and Pt2, were selected to suppress the internalization of MPs based on the results of previous studies (Rennick et al., 2021). The significant suppressive effects in CD-treated SNU-1826 cells show the first evidence that MPs internalization of these cells may be associated with actin polymerization. Nevertheless, there is little research on chemical compounds that promote endocytosis in human cells. Based on previous studies, ZnSO4 and CaCl2 had been considered as candidates that stimulate the internalization of MPs. ZnSO4 stimulated the endocytosis of prion proteins at 500 μM in Neuro-2a (N2a) cells, while the extracellular Ca2+ concentration promotes all types of endocytosis (Pauly and Harris, 1998; Zhu et al., 2009; Yamashita et al., 2010). Notably, Zn2+ has been shown to stimulate the endocytosis of the ZIP4 zinc transporter, leading to its internalization from the plasma membrane (Kim et al., 2004). This finding suggests that Zn2+ is capable of regulating vesicular trafficking and membrane dynamics. Given this evidence, the increased MP uptake observed in our study may be attributed to Zn2+-induced enhancement of endocytic activity. In the present study, ZnSO4, not CaCl2, stimulated MP internalization into SNU-1826 cells. CaCl2 treatment did not lead to a similar increase in MP internalization, indicating that Zn2+-mediated effects are not merely due to general ionic strength changes but may involve specific Zn2+-dependent signaling pathways (Azriel-Tamir et al., 2004). This distinction highlights the potential role of Zn2+ in modulating MP uptake through mechanisms such as receptor-mediated endocytosis or changes in membrane fluidity. These results are partially consistent with previous results showing that ZnSO4 stimulates the internalization of large particles into cells. In addition, these results provide novel evidence that ZnSO4 can stimulate the internalization of MPs into SNU-1826 cells through endocytosis.
This study focused on three mechanisms (autophagy, ER stress, and inflammation) to investigate the cellular responses during the regulation of MPs internalization because they are closely related to the cellular responses under harmful conditions. As shown in our results, these responses were reflected in the responses of SNU-1826 cells to the suppression and stimulation of MPs internalization. The molecular links between ER stress-induced unfolded protein response (UPR), autophagy, and cytokine-induced inflammation were detected in several inflammatory diseases and various pathological conditions (Chipurupalli et al., 2021). During these conditions, ER functions can be affected by various factors. The results revealed UPR activation by the accumulation of misfolded/unfolded proteins (Schröder and Kaufman, 2005). The excessive ER stress-induced UPR first triggers autophagy, the major lysosomal degradation pathway, to eliminate these abnormal proteins and damaged ER through the formation and maturation of autophagosomes (Mizushima et al., 2008; Glick et al., 2010). In addition, ER stress-induced UPR signaling is coupled with the activation of pro-inflammatory pathways through the transcriptional regulation of NF-κB and induces the expression of inflammatory cytokines (Zhang and Kaufman, 2008; Garg et al., 2012). Furthermore, the links between ER stress-induced UPR, autophagy, and cytokine-induced inflammation were analyzed in several cells treated with MPs. PS-MPs also cause ER stress, inflammation, and autophagy in human kidney proximal tubular epithelial cells (HK-2 cells) (Wang et al., 2021). Moreover, the MP treatment induced each response in human cells, even though the types of cells and MPs differ. The significant elevation of ER stress was induced in PS-MPs exposure BEAS-2B cells, goat mammary epithelial cells (GMECs), kidney tubular cells, fibroblasts, and Caco-2 cells. (Wu et al., 2024; Wang et al., 2024a; Wang et al., 2024b; Yan et al., 2023; Jeon et al., 2023; Yan et al., 2023). The inflammatory responses, including cytokines secretions, were observed in some immune cells and a few epithelial cells after the MP treatment. Autophagy coupled with enhanced lysosomal activity and expression levels of several markers was detected in cytokine-induced killer (CIK) cells and HUVECs treated with PS-MPs of various sizes (Lu et al., 2024; Lu et al., 2022). These results suggest that the molecular links between ER stress, autophagy, and cytokine-induced inflammation can be considered important analysis factors in studying the responses to MPs in human colon cells.
In conclusion, in this study, the three cellular responses with linkages at the molecular level were analyzed in SNU-1826 cells after the suppression or stimulation of MPs internalization to investigate the response of human colon cells during the regulation of MPs internalization. These results suggest that CD and ZnSO4 can be considered excellent inhibitors and promoters of MPs internalization into SNU-1826 cells as well as the alternative regulation of MP internalization can be reflected in ER stress, autophagy, and inflammation of SNU-1826 cells although their correlation was greater in inhibitor- than stimulator-treated condition. Nevertheless, additional studies for signaling pathway analyses, including ER stress, autophagy, and inflammation in colon tissue of animal models treated with MPs, will be needed to clarify the mechanism between the regulation of MPs and ER stress-induced cellular responses in in vivo systems.
ACKNOWLEDGMENTS
The authors wish to thank Professor Young Suk Jung of the College of Pharmacy at Pusan National University for the discussion on the endocytosis mechanism of MPs.
Funding
This study was supported by the BK21 FOUR Program through the National Research Foundation of Korea (NRF) funded by the Ministry of Education, Korea (F25YY8109033).
Conflict of interest
The authors declare that there is no conflict of interest.
REFERENCES
- Azriel-Tamir, H., Sharir, H., Schwartz, B. and Hershfinkel, M. (2004): Extracellular zinc triggers ERK-dependent activation of Na+/H+ exchange in colonocytes mediated by the zinc-sensing receptor. J. Biol. Chem., 279, 51804-51816.
- Chen, Y.C., Chen, K.F., Lin, K.A., Chen, J.K., Jiang, X.Y. and Lin, C.H. (2022): The nephrotoxic potential of polystyrene microplastics at realistic environmental concentrations. J. Hazard. Mater., 427, 127871.
- Chipurupalli, S., Samavedam, U. and Robinson, N. (2021): Crosstalk between ER stress, autophagy and inflammation. Front. Med. (Lausanne), 8, 758311.
- Dong, C.D., Chen, C.W., Chen, Y.C., Chen, H.H., Lee, J.S. and Lin, C.H. (2020): Polystyrene microplastic particles: in vitro pulmonary toxicity assessment. J. Hazard. Mater., 385, 121575.
- Fiorentino, I., Gualtieri, R., Barbato, V., Mollo, V., Braun, S., Angrisani, A., Turano, M., Furia, M., Netti, P.A., Guarnieri, D., Fusco, S. and Talevi, R. (2015): Energy independent uptake and release of polystyrene nanoparticles in primary mammalian cell cultures. Exp. Cell Res., 330, 240-247.
- Forte, M., Iachetta, G., Tussellino, M., Carotenuto, R., Prisco, M., et al. (2016): Polystyrene nanoparticles internalization in human gastric adenocarcinoma cells. Toxicol. In Vitro, 31, 126-136.
- Garg, A.D., Kaczmarek, A., Krysko, O., Vandenabeele, P., Krysko, D.V. and Agostinis, P. (2012): ER stress-induced inflammation: does it aid or impede disease progression? Trends Mol. Med., 18, 589-598.
- Glick, D., Barth, S. and Macleod, K.F. (2010): Autophagy: cellular and molecular mechanisms. J. Pathol., 221, 3-12.
- Hirt, N. and Body-Malapel, M. (2020): Immunotoxicity and intestinal effects of nano- and microplastics: a review of the literature. Part. Fibre Toxicol., 17, 57.
- Hwang, J., Choi, D., Han, S., Choi, J. and Hong, J. (2019): An assessment of the toxicity of polypropylene microplastics in human derived cells. Sci. Total Environ., 684, 657-669.
- Hwang, J., Choi, D., Han, S., Jung, S.Y., Choi, J. and Hong, J. (2020): Potential toxicity of polystyrene microplastic particles. Sci. Rep., 10, 7391.
- Jeon, M.S., Kim, J.W., Han, Y.B., Jeong, M.H., Kim, H.R., Sik Kim, H., Park, Y.J. and Chung, K.H. (2023): Polystyrene microplastic particles induce autophagic cell death in BEAS-2B human bronchial epithelial cells. Environ. Toxicol., 38, 359-367.
- Jeong, H., Kim, W., Choi, D., Heo, J., Han, U., et al. (2022): Potential threats of nanoplastic accumulation in human induced pluripotent stem cells. Chem. Eng. J., 427, 131841.
- Khan, A. and Jia, Z. (2023): Recent insights into uptake, toxicity, and molecular targets of microplastics and nanoplastics relevant to human health impacts. iScience, 26, 106061.
- Kim, B.E., Wang, F., Dufner-Beattie, J., Andrews, G.K., Eide, D.J. and Petris, M.J. (2004): Zn2+-stimulated endocytosis of the mZIP4 zinc transporter regulates its location at the plasma membrane. J. Biol. Chem., 279, 4523-4530.
- Kim, J.E., Park, J.W., Kang, M.J., Choi, H.J., Bae, S.J., Choi, Y., Lee, Y.J., Seo, S., Hong, J.T. and Hwang, D.Y. (2019): Laxative effect of spicatoside A by cholinergic regulation of enteric nerve in loperamide-induced constipation: ICR mice model. Molecules, 24, 896.
- Lee, M.R., Kim, J.E., Park, J.W., Kang, M.J., Choi, H.J., Bae, S.J., Choi, Y.W., Kim, K.M., Hong, J.T. and Hwang, D.Y. (2020): Fermented mulberry (Morus alba) leaves suppress high fat diet-induced hepatic steatosis through amelioration of the inflammatory response and autophagy pathway. BMC Complement. Med. Ther., 20, 283.
- Li, J., Yin, K., Hou, L., Zhang, Y., Lu, H., Ma, C. and Xing, M. (2023): Polystyrene microplastics mediate inflammatory responses in the chicken thymus by Nrf2/NF-κB pathway and trigger autophagy and apoptosis. Environ. Toxicol. Pharmacol., 100, 104136.
- Lim, S.L., Ng, C.T., Zou, L., Lu, Y., Chen, J., Bay, B.H., Shen, H.M. and Ong, C.N. (2019): Targeted metabolomics reveals differential biological effects of nanoplastics and nanoZnO in human lung cells. Nanotoxicology, 13, 1117-1132.
- Liu, L., Xu, K., Zhang, B., Ye, Y., Zhang, Q. and Jiang, W. (2021): Cellular internalization and release of polystyrene microplastics and nanoplastics. Sci. Total Environ., 779, 146523.
- Livak, K.J. and Schmittgen, T.D. (2001): Analysis of relative gene expression data using real-time quantitative PCR and the 2(-Delta Delta C(T)). Method. Methods, 25, 402-408.
- Lu, H., Hou, L., Zhang, Y., Guo, T., Wang, Y. and Xing, M. (2024): Polystyrene microplastics mediate cell cycle arrest, apoptosis, and autophagy in the G2/M phase through ROS in grass carp kidney cells. Environ. Toxicol., 39, 1923-1935.
- Lu, Y.Y., Li, H., Ren, H., Zhang, X., Huang, F., Zhang, D., Huang, Q. and Zhang, X. (2022): Size-dependent effects of polystyrene nanoplastics on autophagy response in human umbilical vein endothelial cells. J. Hazard. Mater., 421, 126770.
- Meng, X., Zhang, J., Wang, W., Gonzalez-Gil, G., Vrouwenvelder, J.S. and Li, Z. (2022): Effects of nano- and microplastics on kidney: physicochemical properties, bioaccumulation, oxidative stress and immunoreaction. Chemosphere, 288, 132631.
- Mizushima, N., Levine, B., Cuervo, A.M. and Klionsky, D.J. (2008): Autophagy fights disease through cellular self-digestion. Nature, 451, 1069-1075.
- Mortensen, K. and Larsson, L.I. (2003): Effects of cytochalasin D on the actin cytoskeleton: association of neoformed actin aggregates with proteins involved in signaling and endocytosis. Cell. Mol. Life Sci., 60, 1007-1012.
- Park, J.W., Lee, S.J., Hwang, D.Y. and Seo, S. (2020): Recent purification technologies and human health risk assessment of microplastics. Materials (Basel), 13, 5196.
- Park, J.W., Lee, S.J., Hwang, D.Y. and Seo, S. (2021): Removal of microplastics via tannic acid-mediated coagulation and in vitro impact assessment. RSC Adv., 11, 3556-3566.
- Pauly, P.C. and Harris, D.A. (1998): Copper stimulates endocytosis of the prion protein. J. Biol. Chem., 273, 33107-33110.
- Poma, A., Vecchiotti, G., Colafarina, S., Zarivi, O., Aloisi, M., Arrizza, L., Chichiriccò, G. and Di Carlo, P. (2019): In vitro genotoxicity of polystyrene nanoparticles on the human fibroblast Hs27 cell line. Nanomaterials (Basel), 9, 1299.
- Powell, J. J., Thoree, V. and Pele, L. C. (2007). Dietary microparticles and their impact on tolerance and immune responsiveness of the gastrointestinal tract. Br. J. Nutr., 98 Suppl 1 (Suppl 1), S59-S63.
- Prietl, B., Meindl, C., Roblegg, E., Pieber, T.R., Lanzer, G. and Fröhlich, E. (2014): Nano-sized and micro-sized polystyrene particles affect phagocyte function. Cell Biol. Toxicol., 30, 1-16.
- Qin, J., Xia, P.F., Yuan, X.Z. and Wang, S.G. (2022): Chlorine disinfection elevates the toxicity of polystyrene microplastics to human cells by inducing mitochondria-dependent apoptosis. J. Hazard. Mater., 425, 127842.
- Rennick, J.J., Johnston, A.P. and Parton, R.G. (2021): Key principles and methods for studying the endocytosis of biological and nanoparticle therapeutics. Nat. Nanotechnol., 16, 266-276.
- Roh, Y., Kim, J., Song, H., Seol, A., Kim, T., Park, E., Park, K., Lim, S., Wang, S., Jung, Y., Kim, H., Lim, Y. and Hwang, D. (2024): Impact of the oral administration of polystyrene microplastics on hepatic lipid, glucose, and amino acid metabolism in C57BL/6Korl and C57BL/6-Lepem1hwl/Korl mice. Int. J. Mol. Sci., 25, 4964.
- Schirinzi, G.F., Pérez-Pomeda, I., Sanchís, J., Rossini, C., Farré, M. and Barceló, D. (2017): Cytotoxic effects of commonly used nanomaterials and microplastics on cerebral and epithelial human cells. Environ. Res., 159, 579-587.
- Schmitz, J., Noll, T. and Grünberger, A. (2019): Heterogeneity studies of mammalian cells for bioproduction: from tools to application. Trends Biotechnol., 37, 645-660.
- Schröder, M. and Kaufman, R.J. (2005): ER stress and the unfolded protein response. Mutat. Res., 569, 29-63.
- Sökmen, T.Ö., Sulukan, E., Türkoğlu, M., Baran, A., Özkaraca, M. and Ceyhun, S.B. (2020): Polystyrene nanoplastics (20 nm) are able to bioaccumulate and cause oxidative DNA damages in the brain tissue of zebrafish embryo (Danio rerio). Neurotoxicology, 77, 51-59.
- Wang, Y.F., Wang, X.Y., Chen, B.J., Yang, Y.P., Li, H. and Wang, F. (2025): Impact of microplastics on the human digestive system: from basic to clinical. World J. Gastroenterol., 31, 100470.
- Wang, Y.L., Huang, C.C., Zheng, C.M., Liu, W.C., Lee, Y.H. and Chiu, H.W. (2024b): Polystyrene microplastic-induced extracellular vesicles cause kidney-related effects in the crosstalk between tubular cells and fibroblasts. Ecotoxicol. Environ. Saf., 273, 116098.
- Wang, Y.L., Lee, Y.H., Hsu, Y.H., Chiu, I.J., Huang, C.C., Huang, C.C., Chia, Z.C., Lee, C.P., Lin, Y.F. and Chiu, H.W. (2021): The kidney-related effects of polystyrene microplastics on human kidney proximal tubular epithelial cells HK-2 and male C57BL/6 mice. Environ. Health Perspect., 129, 57003.
- Wang, Z., Liu, S., Cheng, Z., Xu, G., Li, F., Bu, Q., Zhang, L., Song, Y. and An, X. (2024a): Endoplasmic reticulum stress exacerbates microplastics-induced toxicity in animal cells. Food Res. Int., 175, 113818.
- Willox, A.K., Sahraoui, Y.M. and Royle, S.J. (2014): Non-specificity of Pitstop 2 in clathrin-mediated endocytosis. Biol. Open, 3, 326-331.
- Wu, Q., Liu, C., Liu, D., Wang, Y., Qi, H., Liu, X., Zhang, Y., Chen, H., Zeng, Y. and Li, J. (2024): Polystyrene nanoplastics-induced lung apoptosis and ferroptosis via ROS-dependent endoplasmic reticulum stress. Sci. Total Environ., 912, 169260.
- Wu, X.S., McNeil, B.D., Xu, J., Fan, J., Xue, L., Melicoff, E., Adachi, R., Bai, L. and Wu, L.G. (2010): Ca2+ and calmodulin initiate all forms of endocytosis during depolarization at a nerve terminal. Nat. Neurosci., 13, 649.
- Xu, M., Halimu, G., Zhang, Q., Song, Y., Fu, X., Li, Y., Li, Y. and Zhang, H. (2019): Internalization and toxicity: A preliminary study of effects of nanoplastic particles on human lung epithelial cell. Sci. Total Environ., 694, 133794.
- Xu, D., Ma, Y., Han, X. and Chen, Y. (2021): Systematic toxicity evaluation of polystyrene nanoplastics on mice and molecular mechanism investigation about their internalization into Caco-2 cells. J. Hazard. Mater., 417, 126092.
- Yamashita, T., Eguchi, K., Saitoh, N., von Gersdorff, H. and Takahashi, T. (2010): Developmental shift to a mechanism of synaptic vesicle endocytosis requiring nanodomain Ca2+. Nat. Neurosci., 13, 838-844.
- Yan, L., Yu, Z., Lin, P., Qiu, S., He, L., Wu, Z., Ma, L., Gu, Y., He, L., Dai, Z., Zhou, C., Hong, P. and Li, C. (2023): Polystyrene nanoplastics promote the apoptosis in Caco-2 cells induced by okadaic acid more than microplastics. Ecotoxicol. Environ. Saf., 249, 114375.
- Yin, K., Wang, D., Zhang, Y., Lu, H., Wang, Y. and Xing, M. (2023): Dose-effect of polystyrene microplastics on digestive toxicity in chickens (Gallus gallus): multi-omics reveals critical role of gut-liver axis. J. Adv. Res., 52, 3-18.
- Yong, C.Q., Valiyaveettil, S. and Tang, B.L. (2020): Toxicity of microplastics and nanoplastics in mammalian systems. Int. J. Environ. Res. Public Health, 17, 1509.
- Zhang, K. and Kaufman, R.J. (2008): From endoplasmic-reticulum stress to the inflammatory response. Nature, 454, 455-462.
- Zheng, Y., Xu, S., Liu, J. and Liu, Z. (2024): The effects of micro- and nanoplastics on the central nervous system: A new threat to humanity? Toxicol, 504, 153799.
- Zhu, Y., Xu, J. and Heinemann, S.F. (2009): Synaptic vesicle exocytosis-endocytosis at central synapses: fine-tuning at differential patterns of neuronal activity. Commun. Integr. Biol., 2, 418-419.


