ORIGINAL ARTICLES
Body Motion and Rowing Performance: Association between Hip Angle and Rowing Performance: A Pilot Study
2020 Volume 69 Issue 3 Pages 66-75

Details
2020 Volume 69 Issue 3 Pages 66-75
The importance of aerobic fitness in rowing has been widely studied, and it is accepted that aerobic fitness is a key factor in rowing performance. In contrast, the impact of rowing efficacy, especially rowing form, on rowing performance has not yet been fully elucidated. The present study aimed to investigate this subject via the analysis of hip kinematics and the association of this variable with 2000 m ergometer rowing test performance. Eleven adult male rowers underwent a 2000 m rowing test on an ergometer and the exhaled gas was analyzed. The hip joint angle, the pelvic rotation, and the knee joint angle were measured at the catch position throughout the test. Peak VO2 was strongly associated with the time taken to complete the test (ρ=–0.96, P<0.01), thereby confirming the importance of aerobic capacity in rowing performance. The variance of the hip joint angle of each rower was associated with peak VO2, lean mass, and test time (ρ=–0.72, –0.84, and 0.66, respectively, all P<0.05). Greater knee flexion was accompanied by larger posterior rotation of the pelvis (ρ=0.74, P<0.05), and was negatively associated with hip flexion (ρ=–0.76, P<0.05). Although we cannot confirm whether the consistency of the hip joint angle actually leads to better rowing performance, our results suggest that there are associations between the consistency of the hip joint angle, aerobic capacity, lean mass, and the time taken to complete the 2000 m ergometer rowing test.
The 2000 m rowing test on an ergometer is considered the gold standard method for the assessment of rowing performance, and it is well known that the time achieved for this test is strongly associated with aerobic capacity.1,2 There are many articles reporting the biomechanical aspects related to rowing performance. However, the way in which body motion is linked to rowing efficacy has not yet been fully investigated directly on a 2000 m ergometer test.
Rowing can be broken down into the catch, drive, finish, and recovery phases. The catch is the position where the rower’s legs are compressed, and the arms are stretched out holding the rowing handle. During the drive phase, the knees are extended by the quadriceps, and the handle is pulled toward the abdomen. The back muscles swing the torso open, and the gluteal and hamstring muscles extend the hip joint. The finish is the end of the drive phase, in which all the muscles of the legs, arms, and back that were used in the drive phase contract to maintain a stable posture. The rower then moves into the recovery phase in which the seat slides to the catch position, restarting the rowing cycle.
In the current study, we focused on the catch position because it is the position in which the rowing drive phase begins and is crucial for the quality of the stroke.3 We focused especially on the kinematics of the hip joint and knee joint because their effects on rowing performance are well known.4 Among three-dimensional kinematic analyses of the ankle, knee, hip, and lumbar-pelvic joints, hip kinematics explained nearly 35% of the variance in the average resultant foot force during an incremental rowing test, suggesting that hip kinematics are a major predictor of foot force output compared with knee or ankle kinematics.4 Hip kinematics are also known to change with the rowing intensity, suggesting that hip kinematics may be an ideal indicator of technique and efficiency.5 We hypothesized that the kinematics of the hip joint at the catch position may be associated with performance in the 2000 m rowing test on an ergometer.
This study was approved by the local ethics committee of Keio University on May 7, 2018 (approval no. 20170340), and written informed consent was obtained from all participants.
ParticipantsEleven adult male rowers voluntarily participated in this study. Six of the participants rowed for the Keio University varsity rowing team (rowing experience 3 ± 1 years, training 22 ± 0 h/week), while the other five rowed for a non-varsity rowing team (rowing experience 3 ± 1 years, training 13 ± 3 h/week). Bodyweight, body fat, and soft lean mass (lean mass) were assessed using an InBody 470 body composition analyzer (InBody Japan Co., Tokyo). With a sample size of 11, the calculated power was 0.82, assuming an α of 0.05 and an effect size of 0.7.6
Performance test using a rowing ergometerEach subject completed a 5–10 min warm-up on the ergometer (Concept2 rowing ergometer model D, PM5 monitor, Concept Inc., Morrisville, VT, USA), before undergoing an all-out 2000 m ergometer rowing test. The rowing ergometer is frequently used by rowers for indoor training. The ergometer uses air resistance to measure the work being done by the rower. This is then used to estimate the distance and speed, simulating on-water rowing.
Aerobic fitness measurements during the all-out 2000 m rowing testDuring the test, exhaled gas analysis was done using the Aeromonitor (AE310S Minato Medical Science Co., Osaka, Japan). VO2 was recorded as the average for every 100 m, and the highest VO2 was defined as the peak VO2.
Motion analyses during the all-out 2000 m rowing testMarkers were placed on the subjects at the hip and knee joints, the anterior superior iliac spine, the greater trochanter of the femur, the lateral epicondyle of the femur, and the lateral malleolus of the fibula (Fig. 1A). Test were recorded using a video camera (30 frames/s), and the angles of these joints were then measured using motion capture software (Kinovea, https://www.kinovea.org/). Angles were measured at the catch positions of five different strokes that were the closest to the following distances: 400, 800, 1200, 1600, and 2000 m. These angles were measured in the first video frame of each stroke where the handle started to move toward the rower.
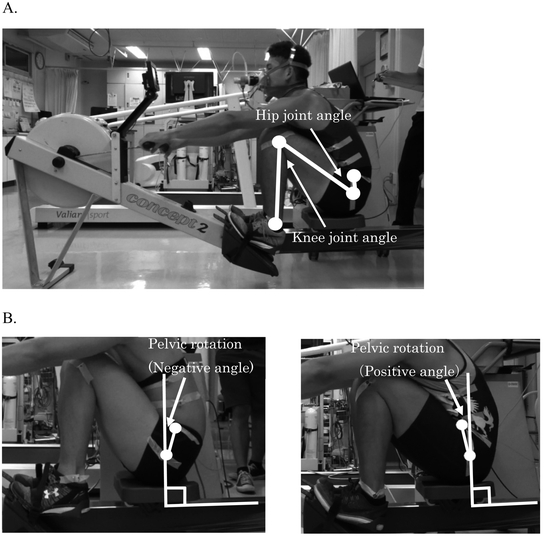
Positions of the markers used to assess the hip and knee joints. (A) Markers were used to determine the hip joint angle (anterior superior iliac spine, greater trochanter of the femur, and lateral epicondyle of the femur), and the knee joint angle (greater trochanter of the femur, lateral epicondyle of the femur, and lateral malleolus of the fibula). (B) Markers were used to determine the pelvic rotation (anterior superior iliac spine, and greater trochanter of the femur). The pelvic rotation was defined as the angle of the pelvis with respect to the perpendicular line on the seat slide of the ergometer.
Markers on the anterior superior iliac spine and the greater trochanter of the femur were also used to determine the rotation of the pelvis (Fig. 1B). The pelvic rotation was defined as the angle of the pelvis with respect to the perpendicular line of the ergometer seat slide and was measured using motion capture software. Anterior rotation was measured as positive angles, whereas posterior rotation was measured as negative angles. The rotation of the pelvis was measured using the same video frames used to assess the hip and knee joint angles.
Statistical analysisCorrelation analysis was performed using Spearman’s test. SPSS for Windows, version 23 (IBM Corp., Armonk, NY, USA), was used for all statistical analysis, except for the power analysis, which was done using G*Power for Windows, version 3.1.6 The average and the variance of each joint angle (hip joint, knee joint, and pelvic rotation) were calculated for each rower by using the angles measured at the five distance points. Because our main outcome measure was the hip kinematics, not the knee kinematics or the pelvis rotation, Bonferroni correction was not applied for the correlation between the hip joint angle and parameters related to rowing performance. Multiple comparisons were considered for the associations between the hip joint, knee joint, and pelvic rotation because there were no specific hypotheses relating to these variables. Benjamini–Hochberg post-hoc analysis was used (the false discovery rate was set at 0.05) for the analysis. The significance level was set at P<0.05, and all values are presented as the mean ± standard deviation.
Table 1 shows the physical characteristics of the subjects. The average rowing training time was 17.8 ± 5.1 h/week, and this was associated with peak VO2 (ρ=0.64, P<0.05), peak VO2 /bodyweight (ρ=0.79, P<0.01), and the time taken to complete the rowing test (ρ=–0.81, P<0.01). Table 2 shows the results of the 2000 m test. Higher peak VO2 was associated with shorter test times (ρ=–0.96, P<0.01, Fig. 2); however, peak VO2/bodyweight was not significantly associated with the test time (ρ=–0.52, ns). In contrast, the lean mass was strongly associated with the test time (ρ=–0.86, P<0.01, Fig. 3).
| Age | Height (cm) |
Bodyweight (kg) |
BMI | Body fat (%) |
Body fat mass (kg) |
Lean mass (kg) |
|
|---|---|---|---|---|---|---|---|
| A | 20 | 176 | 83.9 | 27.1 | 13.0 | 10.9 | 69.0 |
| B | 21 | 188 | 77.6 | 22.0 | 11.3 | 8.8 | 65.0 |
| C | 21 | 181 | 79.6 | 24.3 | 11.0 | 8.8 | 67.0 |
| D | 20 | 176 | 73.2 | 23.6 | 13.4 | 9.8 | 59.9 |
| E | 19 | 180 | 75.0 | 23.1 | 11.1 | 8.3 | 62.9 |
| F | 21 | 174 | 86.2 | 28.5 | 15.4 | 13.2 | 69.0 |
| G | 21 | 178 | 69.2 | 21.8 | 11.2 | 7.7 | 58.1 |
| H | 20 | 170 | 70.7 | 24.5 | 15.2 | 10.7 | 56.7 |
| I | 19 | 171 | 62.3 | 21.3 | 11.9 | 7.4 | 51.9 |
| J | 23 | 167 | 74.7 | 26.9 | 25.9 | 19.3 | 52.5 |
| K | 22 | 173 | 58.8 | 19.6 | 10.9 | 6.4 | 49.6 |
| 21 ± 1 | 176 ± 6 | 73.7 ± 8.3 | 23.9 ± 2.7 | 13.7 ± 4.4 | 10.1 ± 3.6 | 60.1 ± 7.0 |
| Peak VO2
(ml/min) |
Peak VO2/bodyweight
[ml/(kg min)] |
Time (s) |
|
|---|---|---|---|
| A | 4610 | 54.9 | 390.1 |
| B | 4487 | 57.8 | 399.1 |
| C | 4416 | 55.5 | 401.7 |
| D | 4337 | 59.2 | 408.7 |
| E | 4241 | 56.5 | 410.7 |
| F | 4379 | 50.8 | 411.4 |
| G | 3934 | 56.8 | 417.6 |
| H | 3964 | 56.1 | 419.6 |
| I | 3328 | 53.4 | 445.5 |
| J | 3417 | 45.7 | 449.1 |
| K | 3165 | 53.8 | 453.3 |
| 4025 ± 508 | 54.6 ± 3.7 | 418.8 ± 21.3 |
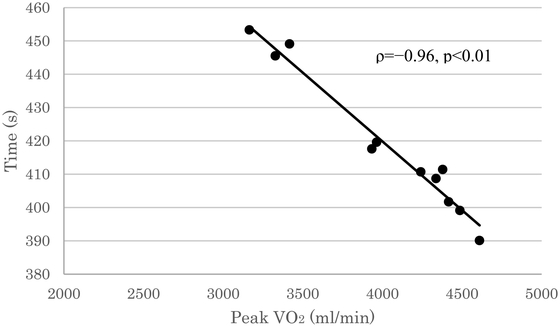
Peak VO2 and the time taken to complete the 2000 m ergometer rowing test. The peak VO2 was significantly negatively correlated with the time taken to complete the 2000 m test (ρ=–0.96, P<0.01).
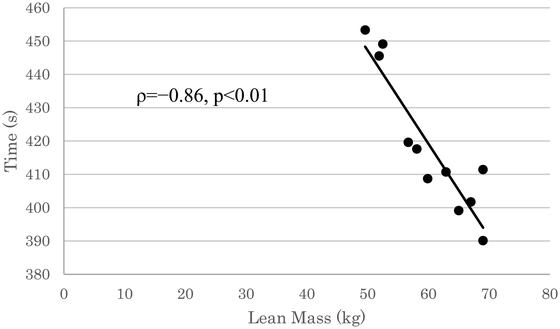
Lean mass and the time taken to complete the 2000 m ergometer test. The lean mass was significantly negatively associated with the time taken to complete the 2000 m test (ρ=–0.86, P<0.01).
For each subject, the changes in hip joint angle at the catch position during the 2000 m test are shown in Fig. 4. As shown in Table 3, the variance of the hip joint angle during the 2000 m test was significantly associated with multiple factors, including the test time (ρ=0.66, P<0.05, Fig. 5A), peak VO2 (ρ=–0.72, P<0.05, Fig. 5B), bodyweight (ρ=–0.72, P<0.05), and lean mass (ρ=–0.84, P<0.01, Fig. 5C). The average hip joint angle during the 2000 m test was not associated with the time of the 2000 m test (ρ=0.15, ns, Fig. 6). As shown in Table 4, the average knee joint angle was negatively associated with the average hip joint angle (ρ=–0.76, P<0.05, Fig. 7A) and positively associated with the average pelvic rotation (ρ=0.74, P<0.05, Fig. 7B). The average pelvic rotation was negatively associated with the average hip joint angle (ρ=–0.91, P<0.05, Fig. 7C). Neither the average nor the variance of the knee joint angle was associated with peak VO2 or the time taken to complete the 2000 m test.
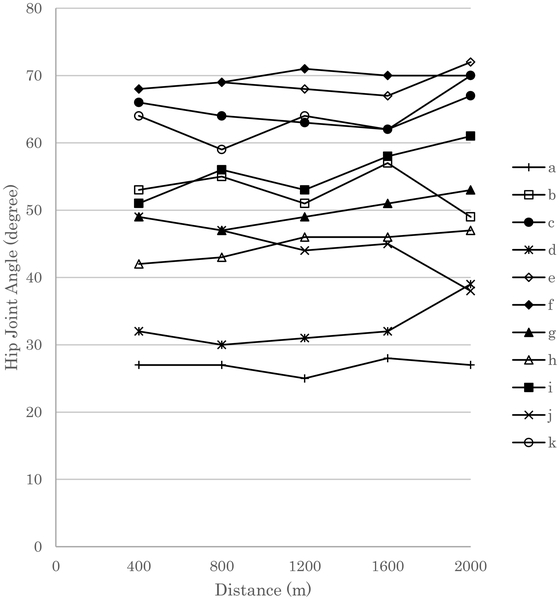
Changes in the hip joint angle at the catch position during the 2000 m ergometer rowing test.
| Hip joint angle | Knee joint angle | Pelvis rotation | ||||
|---|---|---|---|---|---|---|
| Average | Variance | Average | Variance | Average | Variance | |
| Age | 0.03 | 0.39 | 0.44 | 0.44 | –0.04 | –0.01 |
| Height (cm) | 0.26 | –0.43 | –0.08 | 0.19 | –0.12 | –0.30 |
| BMI | –0.18 | –0.55 | 0.16 | 0.05 | 0.43 | 0.26 |
| Bodyweight (kg) | 0.14 | –0.72* | 0.00 | 0.03 | 0.14 | 0.27 |
| Body fat (%) | –0.42 | 0.01 | 0.39 | 0.08 | 0.56 | 0.23 |
| Body fat mass (kg) | –0.35 | –0.29 | 0.40 | 0.23 | 0.57 | 0.l9 |
| Lean mass (kg) | 0.12 | –0.84** | –0.03 | 0.01 | 0.15 | 0.13 |
| Peak VO2 (ml/min) | –0.10 | –0.72* | 0.16 | 0.25 | 0.33 | 0.00 |
| Time (s) | 0.15 | 0.66* | –0.14 | –0.23 | 0.34 | 0.06 |
*P<0.05, **P<0.01 as evaluated by Spearman's test.

Associations between the time taken to complete the 2000 m ergometer rowing test, peak VO2, and lean mass with the variance of the hip joint angle. (A) Association between 2000 m test time and the variance of the hip joint angle. The time was significantly positively correlated with the variation of the hip joint angle (ρ=0.66, P<0.05). (B) Association between peak VO2 and the variance of the hip joint angle. The peak VO2 was significantly negatively correlated with the variation of the hip joint angle (ρ=–0.72, P<0.05). (C) Association between lean mass and the variance of the hip joint angle. The lean mass was significantly negatively correlated with the variation of the hip joint angle (ρ=–0.84, P<0.01).
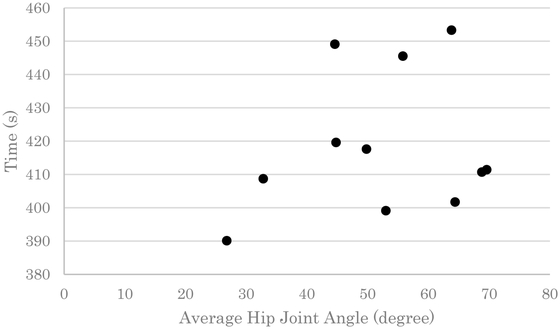
Average hip joint angle and the time taken to complete the 2000 m ergometer test. The average hip joint angle did not show significant association with the time of the 2000 m test.
| Hip joint angle | Knee joint angle | Pelvic rotation | ||||
|---|---|---|---|---|---|---|
| Average | Variance | Average | Variance | Average | Variance | |
| Hip joint angle (average) | – | –0.21 | –0.76* | –0.42 | –0.91* | 0.16 |
| Hip joint angle (variance) | – | 0.37 | 0.36 | 0.03 | –0.02 | |
| Knee joint angle (average) |
– | 0.70* | 0.74* | –0.18 | ||
| Knee joint angle (variance) |
_ | 0.52 | –0.39 | |||
| Pelvic rotation (average) |
_ | –0.15 | ||||
| Pelvic rotation (variance) |
_ | |||||
*P<0.05 as evaluated using Spearman's test. The correlations were also evaluated using the Benjamini–Hochberg method (false discovery rate set at 0.05), and the correlations that remained significant are bolded and underlined.
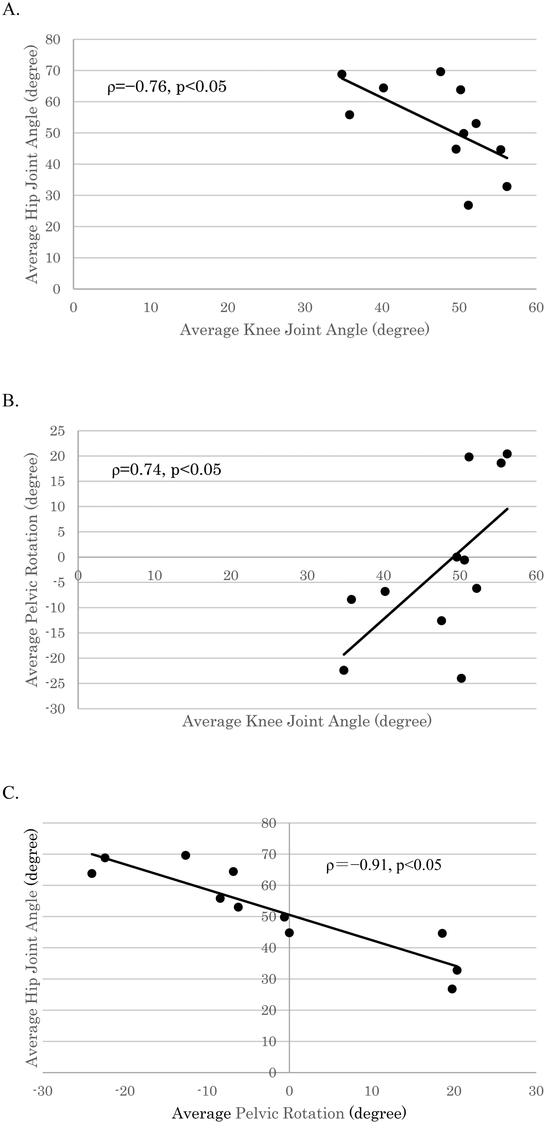
Associations between the hip joint angle, pelvic rotation, and knee joint angle. (A) Association between average hip joint angle and average knee joint angle. Participants with a smaller average knee joint angle had a larger average hip joint angle (ρ=–0.76, P<0.05). (B) Association between average pelvic rotation and average knee joint angle. Participants with a smaller average knee joint angle had greater posterior pelvic rotation (ρ=0.74, P<0.05). (C) Association between average hip joint angle and average pelvic rotation. Participants with greater posterior pelvic rotation had a larger hip joint angle (ρ=–0.91, P<0.05).
Rowing is a demanding sport that requires both aerobic and anaerobic capabilities. It has been reported that 70–75% of the power necessary to row a 2000 m race is produced from aerobic metabolism, whereas the other 25–30% is produced from anaerobic metabolism.7 High physical endurance is the key to good performance in rowing.
Previous research has proven the importance of aerobic fitness by showing that the VO2 max of a rower is the key determinant of performance in the 2000 m ergometer test.1 The current results were consistent with these previous findings. Furthermore, our finding that peak VO2, but not peak VO2 /bodyweight, was associated with performance in the 2000 m ergometer test suggests that greater lean mass is also an important determinant of rowing performance. Unlike other sports, rowing is performed in a seated position and is a non-weight-bearing sport. Therefore, greater lean mass does not negatively affect the performance of the rower. Rowers with greater lean body mass have greater aerobic capacity and will achieve better rowing performance.2,8
The current study focused on the rowing efficacy and found that rowers with low variance of the hip joint angle achieved shorter test times. In other words, consistency of the hip joint angle at the catch position throughout the test was associated with better rowing performance.
Buckeridge et al. showed that a greater range of motion in the hip joint during the stroke is a key variable that contributes to greater resultant foot force.4 In this previous study, a larger range of motion was achieved through greater flexibility of the hips, allowing greater flexion at the catch.4 In another study evaluating the effect of foot stretcher height on rowing performance, the ability to anteriorly rotate the pelvis at the front of the stroke was suggested to be a key factor for achieving better foot forces.9 According to these previous studies, greater flexion of the hips with anterior pelvic rotation at the catch are key components in rowing technique to achieve better rowing performance.
In our study, the only factor that was associated with the time taken to complete the 2000 m ergometer rowing test was the variance of the hip joint angle (Table 3,Fig. 5A). In contrast, neither the average hip joint angle nor the average pelvic rotation was associated with the time taken to complete the test. This finding suggests that the consistency of the hip joint angle at the catch may be a key determinant of performance in the 2000 m test, whereas greater flexion of the hip joint may not be important.
The extension of the pelvis is a key phase of the rowing stroke and consists of the activation of multiple muscles such as the gluteus maximus and the hamstring. Indeed, the hamstring plays a role as a hip extensor during the leg drive of the stroke.10 Therefore, the effective use of these muscles is crucial for good rowing performance. Although greater flexion of the hip joint at the catch is likely to increase the range of motion in the extension phase of the hip joint, this does not necessarily result in the best power output. Studies show that all the joints in our body have a certain angle at which the extensor muscles exhibit maximum strength.11 Wan et al. also showed that the optimal lengths of the hamstring muscle, at which the muscle contraction is maximal, are significantly correlated to hamstring flexibility.12 This suggests that excessive extension of these muscles that surpasses their flexibility will cause inefficient contraction. Consequently, greater flexion of the hip joint may not necessarily result in the best performance.
In our current study, the variance of the hip joint angle was associated with the time taken to complete the 2000 m ergometer rowing test, indicating that rowers who rowed with a more consistent hip joint angle at the catch had better performance. We believe that these rowers were able to constantly maintain their optimal hip joint flexion during the 2000 m test, resulting in better performance.
The variance of the hip joint angle was also associated with peak VO2 (Fig. 5B) and lean mass (Fig. 5C). Although the present study was cross-sectional in nature and was therefore unable to show causality, our findings imply that rowers with greater aerobic capacity and greater muscle mass (and most likely greater muscular strength) would be better at maintaining their optimal hip joint flexion.
The average knee joint angle was significantly negatively associated with the average hip joint angle (Table 4, Fig. 7A), meaning that participants with a smaller knee joint angle had a bigger hip joint angle. Because participants with a smaller knee joint angle had greater posterior rotation of the pelvis (Fig. 7B), this is likely to have caused the hip joint angle to increase (Fig. 7C), thereby decreasing the flexion of the hip joint. In other words, both greater knee flexion and the maintenance of the anterior rotation of the pelvis at the catch position are important in maintaining optimal hip flexion; however, greater knee flexion was offset by greater posterior rotation of the pelvis. This offset body motion may be the reason for the absence of associations between rowing performance and pelvic rotation or knee joint angle.
The limitations of the current study include the small sample size and the nature of cross-sectional analyses. The problem of multiple comparisons with the results shown in Table 3 is also a limitation of our study. When methods such as the Bonferroni correction are applied, the correlation between the variance of the hip joint angle and the time of the 2000 m test becomes not significant. This may be due to type 2 error, because a minimal sample size of 13 is needed for an effect size of 0.66. Furthermore, because we can only directly measure aerobic metabolism, not anaerobic metabolism, the rowing efficiency (i.e., the ratio of mechanical power and energy input) could not be directly assessed. Therefore, we could not determine whether the consistency of the hip joint angle is a determinant of the 2000 m test rowing efficiency or is merely a result of greater lean mass and greater aerobic capacity.
To evaluate the consistency of the hip joint angle as a determinant factor for the 2000 m test performance, the factor of aerobic capacity must be eliminated. To achieve this, we could select rowers with similar aerobic capacities and evaluate the changes in their hip joint throughout a 2000 m test.
In summary, although we cannot determine whether the consistency of the hip joint angle is actually a determinant of the 2000 m test time, our research does suggest that better 2000 m test performance is associated with better hip joint angle consistency. The associations between the aerobic capacity, the lean mass, the time taken to complete the 2000 m test, and the consistency of the hip joint angle warrant further investigation.
Rowing with a greater hip range of motion, i.e., greater flexion at the hip joint, may indeed be a key factor for rowing performance, but efforts directed at trying to row with a greater stroke from the catch may not be sufficient. The ability to row consistently at a certain flexion in the hip joint could be an additional factor in rowing performance and is something that coaches and rowers should pay attention to.
We thank the staff of the Institute for Integrated Sports Medicine for their support and their assistance with data collection. We also thank Kelly Zammit, BVSc, from Edanz Group (www.edanzediting.com/ac), for editing a draft of this manuscript.
The authors have declared that no conflict of interest exists.