Abstract
The aim of this study was to identify 18F-fluorodeoxyglucose positron emission
tomography/computed tomography (18F-FDG-PET/CT) parameters that could predict
the prognosis of patients with esophageal cancer before and after undergoing
chemoradiation therapy. We retrospectively reconstructed images under the same conditions
for patients who underwent pre- and post-treatment 18F-FDG-PET for
chemoradiation therapy for esophageal cancer. Correlations between 2-year survival rates
and pre-treatment values, differences between pre- and post-treatment quotients, and their
ratios were examined for various standardized uptake values (SUV), metabolic tumor volumes
(MTV), and each SUVmean (Mean SUV)*MTV (Vol.mean). We enrolled 29 patients who underwent
pre-and post-treatment 18F-FDG-PET. The median overall survival was 21.4 months
(range, 3.6–100.9 months). Pre-treatment MTV had the most favorable hazard ratio (HR) for
survival. However, the MTV product (Vol.meanQ), SUV corrected for basal metabolic rate
using Mifflin-St Jeor estimation (BMR.ms), Vol.mean (SUVmeanQ) using the qPET method,
SUVmean, and HR using Vol.meanQ corrected for body weight were nearly equivalent. No
significant results were obtained for the pre- and post-treatment quotients. The pre- and
post-treatment Vol.meanQ is a useful prognostic parameter that considers the effect of
age-related loss of lean body mass. The use of parameters, including metabolism, will
facilitate more appropriate use of 18F-FDG-PET before and after chemoradiation
therapy.
Introduction
Most esophageal cancers are regional or distant metastatic cases (locally advanced disease)
at the time of initial diagnosis, and multimodal therapy including surgery is the standard
treatment.1,2 We have previously reported favorable long-term
outcomes for patients with esophageal cancer.3 Definitive chemoradiotherapy has the merit of esophageal preservation and
is one of the standard treatments.1,2 However,
there are known early and late adverse events caused by chemoradiation4; therefore, it is useful to predict the
therapeutic effect to determine the treatment strategy.
18F-Fluorodeoxyglucose positron emission tomography/computed tomography
(18F-FDG-PET/CT) has been established as a useful diagnostic modality in
oncology because of its excellent tumor detection abilities. It is widely used for detecting
distant metastases, unknown primary tumors, and tumor recurrence.5 With regard to esophageal cancer, Marzola et
al. reported that 18F-FDG-PET was not suitable for the detection of
tumors with very small volumes, although it was superior to CT/endoscopic ultrasound,
especially for the detection of distant metastases.6
18F-FDG-PET/CT is widely used for not only tumor detection but also for
determination of therapeutic effects because it provides semi-quantitative numerical
values.7,8 In recent years, its utility for determining the
prognosis after concurrent chemoradiotherapy (CCRT) in lymph node-positive patients has also
been investigated.9 Although this modality
is widely used to determine therapeutic effects via comparisons before and after
treatment,10,11 the treatment efficacy is based on visual
assessment of uptake, and the details of reliable parameters for predicting the patient’s
prognosis remain unclear.
Studies on prognosis prediction based on the judgment of therapeutic effects are being
conducted, with several studies reporting that the standardized uptake value (SUV) was a
useful predictor in oral cancer,12,13 small
cell lung cancer,14 and
lymphoma.15 However, another study
reported that the metabolic tumor volume (MTV) was a more reliable predictor than
SUV.16 Therefore, it is unclear which
parameter is more reliable. Although both pre- and post-treatment values appear to be
powerful parameters for prognosis prediction, the disadvantage lies in the fact that
post-treatment parameters are required and cannot be predicted before treatment.
The purpose of this study was to examine 18F-FDG-PET/CT parameters before and
after treatment and determine the useful parameters for predicting the prognosis before and
after chemoradiation for esophageal cancer. In addition, we examined the robustness of SUV
and MTV values through detailed examination of changes in their usefulness depending on
metabolic correction.
Materials and Methods
Ethical approval
All procedures were in accordance with the ethical standards of the responsible committee
at which the studies were conducted (Ethics Committee of Keio University School of
Medicine; 31 July 2015; No. 2015/20150137) and were in accordance with the 1964
Declaration of Helsinki and later versions. Informed consent was obtained from all
patients.
Patients
We retrospectively reviewed our institutional database of electronic medical records and
all available 18F-FDG-PET/CT imaging studies between 1 August 2012 and 31
December 2019. During this period, 112 patients with esophageal squamous carcinoma
received CCRT treatment. We included patients who received CCRT as the first-line
treatment and underwent 18F-FDG-PET/CT before and after CCRT. The first
18F-FDG-PET/CT (pre-test) examination was performed within 50 days before
CCRT initiation, and the second examination was performed 14–150 days after CCRT
completion (post-test). Patients with a history of chemotherapy or radiotherapy for other
cancers and those with metastatic recurrence were excluded.
18F-FDG-PET/CT image acquisition
Following confirmation of a fasting blood glucose level below 6 mmol/L (≥6 h of fasting),
we intravenously administered 18F-FDG. Approximately 60–75 min (until 31 August
2016: 60 min; from 1 September 2016: 75 min according to changes in facility policies)
after 18F-FDG uptake, a topogram was obtained in the craniocaudal direction to
plan for the scan. This was followed by CT (without contrast enhancement) for anatomical
localization, attenuation correction, and diagnostic purposes. The patients were scanned
using a Siemens BioGraph 40/64 TruePoint hybrid PET/CT scanner (Siemens Medical Solutions,
Malvern PA, USA). Several emission scans were recorded at seven bed positions with the
following parameters: duration method, step and shoot (from 1 August 2012 to 31 July 2014,
BioGraph 64 used continuous bed motion); scan duration/bed, variable based on body weight
(<50 kg: 60 s, 50–70 kg: 90 s, >70 kg: 120 s) until 31 August 2016 and uniformly set
to 135 s from 1 September 2016. The collected data were reconstructed using Syngo (Siemens
Medical Solutions) with the Iterative+Time-of-Flight method. The processing parameters
were as follows: three iterations/21 subsets, Gaussian-Filter, relative accuracy of the
scatter correction method, and 256 × 256-pixel image size.
Measurements
We measured various SUV-based parameters such as maximum SUV (SUVmax), mean SUV
(SUVmean), peak SUV (SUVpeak),17 the
standard deviation of SUVmean (SUVmean_sd), SUVpeak based on qPET (SUVqpeak),18 the average of the SUVqpeak (MeanQ), the
average of Wahl’s SUVpeak19 using qPET
(MeanW), and MTV on the PET/CT viewer.20
These parameters were based on the distributions of Fiji21/ImageJ.22
We manually set volumes of interest (VOIs) and defined targets using the following
thresholds:
-
1. Fixed SUV threshold of 2.0 g/mL (SUV2.0, MTV2.0)
-
2. Fixed SUV threshold of 2.5 g/mL (SUV2.5, MTV2.5)
-
3. Fixed SUV threshold of 3.0 g/mL (SUV3.0, MTV3.0)
-
4. Adaptive at 41% of maximum SUV on each lesion (SUV41, MTV41)
We evaluated all SUV thresholds and selected the best representative value. We measured
SUVs (maximum, mean, and peak) based on the 18F-FDG-PET/CT: European
Association of Nuclear Medicine procedure guidelines for tumor imaging, version
2.0.17 SUVqPeak was proposed by
Hasenclever et al.18
for lymphoma cases. Average PET (MeanW) and average Q-PET (MeanQ) were calculated as the
average SUVs for each slice including the delimited VOI of SUVpeak19 and SUVqpeak.18 Accordingly, we evaluated the following parameters: SUVmax,
SUVpeak, SUVqpeak, SUVmean, MeanW, and MeanQ. We tested three patterns of the mean based
on SUVpeak in addition to SUVmean for MeanW and MeanQ. The parameters also included MTV
and MTV*mean, with three patterns of the mean for MeanW and MeanQ tested based on SUVpeak
in addition to SUVmean. MTV*SUVmean represented total lesion glycolysis.
SUV measurement and highest SUVmax detection
We detected the highest SUVmax using a VOI of 1 cm3 for each organ (esophagus,
heart, liver, spleen, multifidus muscle, abdominal aorta, colon, and jejunum), because the
SUVmax of the contoured organs could not be derived directly on CT. Subsequently, we
measured the average and peak values for the organs based on the arranged VOI.
Parameter correction (method)
We corrected SUV values using several parameters,23 including ideal body weight (IBW),24 predicted normal weight (PNW),25 body surface area (BSA),26 fat-free mass (FFM),27 two types of basal metabolic rate (BMR),28,29 and two types of lean body mass (LBM).30,31Table 1 shows the formulae
used to calculate each parameter. In addition to Janmahasatian’s estimate
(LBM.j)31 for SUV corrected by LBM
(SUL) in the PET/CT viewer, we calculated LBM using Green and Duffull’s formula
(LBM.gd).30
Table 1SUV and metabolic correction functions
| Parameter |
Method |
Sex |
Function |
Purpose |
| SUVcorr |
- |
Both |
SUV
corr
=
C
img
Dose
inj
÷
Correction value (ex
. BW)
|
For use in each SUV
correction formula |
| BMI |
- |
Both |
Bw
kg
Ht
m
2
|
For use in each
correction formula |
| BSA |
DuBois’ formula |
Both |
0.007184
×
Bw
0.425
kg
×
Ht
0.725
cm
|
Indicator of metabolism used in chemotherapy |
| IBW |
- |
Male |
49.9
+
0.89
×
Ht
cm
−
152.4
|
Index that is not affected by age and
weight |
| Female |
45.4
+
0.89
×
Ht
cm
−
152.4
|
| PNW |
- |
Male |
1.57
×
Bw
kg
−
0.0183
×
BMI
×
Bw
kg
−
10.5
|
LBM related indicators |
| Female |
1.75
×
Bw
kg
−
0.0242
×
BMI
×
Bw
kg
−
12.6
|
| FFM |
- |
Male |
0.285
×
Bw
kg
+
12.1
×
Ht
m
2
|
LBM related indicators |
| Female |
0.287
×
Bw
kg
+
9.74
×
Ht
m
2
|
| LBM |
Janmahasatian’s
estimate
(LBM.j) |
Male |
9270
×
Bw
kg
6680
+
216
×
BMI
|
As basic parameters |
| Female |
9270
×
Bw
kg
8780
+
244
×
BMI
|
| Green and Duffull’s formula (LBM.gd) |
Male |
1.10
×
Bw
kg
−
0.0128
×
BMI
×
Bw
kg
|
| Female |
1.07
×
Bw
kg
−
0.0148
×
BMI
×
Bw
kg
|
| BMR |
Roza’s formula (BMR.r) |
Male |
13.397
×
Bw
kg
+
4.799
×
Ht
cm
−
5.677
×
Age
y
+
88.362
|
Indicators affected by sex, age, and
weight |
| Female |
9.247
×
Bw
kg
+
3.098
×
Ht
cm
−
4.330
×
Age
y
+
447.593
|
Mifflin-St Jeor
estimate
(BMR.ms) |
Male |
9.99
×
Bw
kg
+
6.25
×
Ht
cm
−
4.92
×
Age
y
+
5
|
| Female |
9.99
×
Bw
kg
+
6.25
×
Ht
cm
−
4.92
×
Age
y
−
161
|
SUVcorr, SUV correction; Bw, body weight; Ht, height; BMI, body mass
index; BSA, body surface area; IBW, ideal body weight; PNW, predicted normal weight;
FFM, fat-free mass; LBM, lean body mass; BMR, basal metabolic rate; Cimg,
image-derived radioactivity concentration; Doseinj, injected radioactivity
dose.
We verified the correlation between overall survival and disease-free survival (OS-DFS)
for the PET values in the following three groups: Pre alone (Prealone),
difference between Pre and Post (DiffPrePost), and quotient of Pre and Post
(QuotPrePost). This process is ongoing, and useful parameters and their
cutoffs have been identified.
Visual evaluation
A single doctor visually evaluated various organs using the 0–4-point method. However,
the entire brain was not imaged or evaluated in multiple cases. For myocardial assessment,
we could not reproduce the reconstruction of the vertical long-axis/horizontal
long-axis/short-axis images. Therefore, we associated 17 segments of the fusion image with
three-way maximum intensity projection images [anterior to posterior: AP; lateral (left to
right): LR; left anterior oblique: LAO].
Statistical analysis
We analyzed the data using R software (version 3.1.0, R Foundation)32 and three additional packages:
pROC,33 survival,34 and MASS.35 We computed and evaluated the correlation coefficients
between each parameter and event using Cox regression analysis (Cox proportional hazards
model). We also evaluated each parameter using stepwise regression36 on Akaike’s information criterion37 using the MASS package. Receiver operating
characteristic curve analysis was conducted to derive the optimal cut-off value for each
parameter to predict 2-year survival using the Youden index.38 Survival curves were estimated using Kaplan–Meier methods
based on the survival package (R software). Generalized logistic regression analysis of
binary data was performed using the glm function in the R software package. We also used
the logistf package39 with Firth’s
penalized likelihood method40 to verify
the exact logistic regression because of the small number of cases. The history of the
program files was managed by Git41 (a
free, open-source system) and GitHub (provides hosting for software development and
version control using Git). All P values except those for hazard ratio
(HR; obtained from Cox regression model), likelihood ratio (obtained from likelihood
test), and log-rank test were calculated using the Wilcoxon rank-sum exact test or
Wilcoxon rank-sum test. A two-sided P value of <0.05 was considered
statistically significant.
Results
Patient and treatment characteristics
Amongst the 112 patients, 44 received neoadjuvant chemotherapy and 35 did not undergo
18F-FDG-PET/CT (in most cases, post-CCRT PET was not performed). Moreover,
the images of 4 patients could not be technically evaluated because of corrupted or
unreadable data. Finally, 29 patients who met the inclusion criteria were examined. The
observations for 13 patients were right-censored, and the time of death was recorded for
all other patients. At the final follow-up on 26 June 2021, the median overall survival
was 21.4 months (range, 3.6–100.9 months), with 8 survivors. Table 2 presents the clinical characteristics of the study
population. Following CCRT, the initial evaluation revealed a complete response in 12
patients, a partial response in 8 patients, stable disease in 4 patients, and progressive
disease in 5 patients. Surgery (n = 6), endoscopic submucosal dissection (n = 2),
chemotherapy (n = 7), and radiotherapy (n = 3) were also used as salvage therapies.
Table 2Clinical characteristics of the study population
| Characteristic |
n =29 |
| Initial age (years) |
66 [61–76] |
| Height (cm) |
168 [160–171] |
| Diabetes |
|
| Yes |
2 (6.9%) |
| No |
27 (93%) |
| Tobacco experience |
|
| Yes |
26 (90%) |
| No |
2 (6.9%) |
| Unknown |
1 (3.4%) |
| Tobacco (pack-year) |
28 [12–35] |
| Alcohol experience |
|
| Social |
28 (97%) |
| Never |
1 (3.4%) |
| Alcohol face flush |
|
| Yes |
15 (52%) |
| Yes (former) |
3 (10%) |
| No |
6 (21%) |
| No (Unknown for previous) |
2 (6.9%) |
| Unknown |
3 (10%) |
| Alcohol (drinks/day)a |
4.40 [3.89–6.60] |
| Initial stage (UICC 8th) |
|
| I |
5 (17%) |
| II |
4 (14%) |
| III |
7 (24%) |
| IV |
13 (45%) |
| Pathology |
|
| SCC |
28 (97%) |
| ADC |
1 (3.4%) |
| RTx dose (Gy) |
|
| <50 |
3 (10%) |
| ≥50 |
26 (90%) |
| CTx regimen |
|
| FP1000/75b |
23 (79%) |
| FP700/70c |
4 (14%) |
| 5-FU1000d |
1 (3.4%) |
| PTX30e |
1 (3.4%) |
Data given as median [25%–75%] or number (percentage).
UICC, Union for International Cancer Control; SCC, squamous cell carcinoma; ADC,
adenocarcinoma; RTx, radiation therapy; CTx, chemotherapy.
a One drink =10 g ethanol; b Fluorouracil 1000 mg/m2
+ cisplatin 75 mg/m2; c Fluorouracil 700 mg/m2 +
cisplatin 70 mg/m2; d Fluorouracil 1000 mg/m2; e
Paclitaxel 30 mg/m2.
Fig. 1 shows plots of each SUV correction
parameter for examining the effects. The correction parameters differed only in the IBW
derived from height; however, the other values increased with height and weight. LBM.j,
LBM.gd, and PNW showed similar trends for men and women and for weight and height;
however, LBM.gd and PNW decreased more with short stature and increased weight. In
addition, Roza’s BMR (BMR.r) and BMR.ms accounted for the age-related decline. Considering
the age distribution of the patients, the weight/height graph for BMRs narrowed between
the ages of 40 and 90 years. The height was fixed at 165 cm for all parameters because it
represented the mean patient height rounded down to the nearest whole number, and a
three-dimensional plot would be too complex to interpret. The correlations of body weight
and age with correction parameters are shown in Supplement Figures 1 and 2. BMR.r and BMR.ms decreased with age; however, BMR.ms
was fundamentally similar to FFM. BMR.r had different slopes for men and women. The
difference in the SUV correction value for BMR.r between men and women was almost
constant, regardless of age and weight. However, for BMR.ms, the slope for men was steeper
than that for women, and SUV was reversed.

18F-FDG-PET/CT images of all patients allowed evaluation from the neck to the
pelvis. Among the patients, one had different bed movement settings and four had different
imaging timings for pre-treatment and post-treatment scans, although none had both. Table 3 and Table 4 show the SUV-correlated body
parameters based on sex.
Table 3Characteristics of FDG-PET scan
| Characteristic |
Male |
P
|
Female |
P
|
Overall |
P
|
| Pre (n =24) |
Post (n =24) |
Pre (n =5) |
Post (n =5) |
Pre (n =29) |
Post (n =29) |
| FDG dose (MBq) |
238 [216–259] |
232 [204–244] |
0.31 |
153 [139–180] |
165 [144–172] |
>0.99 |
236 [180–256] |
227 [191–236] |
0.37 |
| BW adapted RA (MBq/kg)a |
3.89 [3.69–3.99] |
3.93 [3.69–4.06] |
0.77 |
3.98 [3.87–4.30] |
4.08 [3.88–4.18] |
>0.99 |
3.90 [3.69–4.05] |
3.93 [3.71–4.09] |
0.71 |
| Interval (days) |
15 [10–20] |
34 [27–52] |
<0.001 |
15 [14–21] |
29 [27–35] |
0.008 |
15 [11–21] |
33 [27–52] |
<0.001 |
Data given as median [25%–75%]; P values from Wilcoxon rank-sum
exact test.
a Radioactivity by body weight.
Table 4Characteristics of patients' body parameters
| Group |
Characteristic |
Male |
P
|
Female |
P
|
Overall |
P
|
| Pre (n =24) |
Post (n =24) |
Pre (n =5) |
Post (n =5) |
Pre (n =29) |
Post (n =29) |
| Patients |
Age |
67 [65–77] |
68 [65–78] |
0.72 |
59 [56–61] |
60 [57–61] |
0.69 |
66 [61–76] |
67 [61–77] |
0.75 |
| Correction parameters |
BW |
61 [54–65] |
59 [53–64] |
0.35 |
45 [35–46] |
41 [33–44] |
0.69 |
60 [50–63] |
57 [47–62] |
0.35 |
|
BMI |
21.4 [19.9–24.1] |
20.8 [18.2–23.0] |
0.35 |
16.8 [14.0–20.4] |
14.9 [14.0–20.2] |
0.84 |
21.0 [18.9–24.1] |
20.2 [17.6–23.0] |
0.38 |
|
BSA |
1.67 [1.62–1.82] |
1.66 [1.55–1.77] |
0.57 |
1.36 [1.28–1.50] |
1.35 [1.25–1.42] |
0.84 |
1.67 [1.50–1.74] |
1.62 [1.50–1.71] |
0.56 |
|
IBW |
65.3 [57.6–67.5] |
65.3 [57.6–67.5] |
>0.99 |
50.4 [44.0–51.7] |
50.4 [44.0–51.7] |
>0.99 |
64 [56–66] |
64 [56–66] |
>0.99 |
|
PNW |
60 [56–68] |
59 [53–65] |
0.46 |
44 [37–50] |
44 [35–45] |
0.84 |
59 [50–63] |
57 [49–62] |
0.45 |
|
FFM |
51.4 [48.3–55.5] |
51.0 [47.3–54.0] |
0.68 |
34.4 [34.4–40.3] |
34.3 [33.9–38.8] |
0.69 |
51 [44–54] |
50 [44–53] |
0.70 |
|
LBM.j |
49 [47–55] |
48 [44–53] |
0.52 |
30.3 [26.6–33.5] |
30.1 [25.7–30.8] |
0.84 |
49 [41–51] |
47 [40–51] |
0.59 |
|
LBM.gd |
50 [47–55] |
48 [44–53] |
0.46 |
34.6 [30.2–38.2] |
34.3 [29.1–35.0] |
0.84 |
49 [43–52] |
47 [42–51] |
0.53 |
|
BMR.r |
1291 [1223–1443] |
1294 [1161–1407] |
0.51 |
1067 [928–1149] |
1061 [943–1098] |
0.84 |
1255 [1149–1432] |
1261 [1121–1399] |
0.56 |
|
BMR.ms |
1308 [1238–1439] |
1301 [1195–1411] |
0.53 |
925 [791–1067] |
919 [798–1011] |
0.84 |
1281 [1145–1430] |
1267 [1137–1407] |
0.59 |
Data given as median [25%–75%]; P values from Wilcoxon rank-sum
exact test.
BW, body weight; BMI, body mass index; BSA, body surface area; IBW, ideal body
weight; PNW, predicted normal weight; FFM, fat-free mass; LBM.j, lean body mass
(Janmahasatian's estimate); LBM.gd, lean body mass (Green and Duffull's formula);
BMR.r, basal metabolic rate (Roza's formula); BMR.ms, basal metabolic rate (Mifflin-St
Jeor estimate).
Fig. 2 shows the SUVmean values based on the
pre-and post-treatment 18F-FDG accumulation in various organs. Supplement
Figure 3 shows the pre-and post-treatment data plots for the corresponding data.
A significant difference was observed in the distribution of the myocardium and multifidus
before and after treatment (P = 0.008 and P = 0.001,
respectively). In multiple cases, the accumulation of 18F-FDG in the myocardium
decreased or recovered significantly before and after treatment. The myocardium was also
visually evaluated by applying each segment model based on the 17-segment model.
(Supplement Figure 4).
Changes in 18F-FDG accumulation before and after CCRT
Fig. 3 displays representative examples of
changes in 18F-FDG accumulation. SUV levels were insignificant and stable in
the multifidus muscles; however, they were uneven in the liver and spleen, often showing
changes before and after treatment.
Distribution and linear regression
Fig. 4 and Fig. 5 show the distribution of SUVs and SUV*Volumes by weight
corrections for SUVmeans (SUVmean, SUVmeanW, and SUVmeanQ). Vol.means (Vol.mean,
Vol.meanW, and Vol.meanQ) had higher correlation coefficients for MTV than the SUVmeans
(SUVmean, SUVmeanW, or SUVmeanQ) for all body weight corrections before and after
treatment, when the threshold was fixed. Table
5 presents the detailed characteristics of the corrected and measured data from
the 18F-FDG-PET scans. In the relative cutoff, the maximum correlation
coefficient for MTV to Vol.means was observed when SUVmean was corrected using IBW and the
Mifflin-St Jeor estimate (BMR.ms). The detailed parameters are provided in Supplementary
tables. Supplementary Table S1 presents the
top 20 correlation coefficients between Vol.means (Table S1–1) and SUVmeans (Table
S1–2).
Table 5Characteristics of corrected and measured data based on
18F-FDG-PET
scan
| Characteristic |
Male |
P
|
Female |
P
|
Overall |
P
|
| Pre (n =24) |
Post (n =24) |
Pre (n =5) |
Post (n =5) |
Pre (n =29) |
Post (n =29) |
| Vol.ml |
22 [12–33] |
17 [9–25] |
0.21 |
78 [40–113] |
36 [15–44] |
0.22 |
23 [12–40] |
18 [10–27] |
0.13 |
| Vol.mean |
99 [47–185] |
41 [20–63] |
0.001 |
641 [191–1,079] |
112 [27–117] |
0.10 |
142 [49–191] |
41 [21–73] |
<0.001 |
| SUVMean |
4.53 [2.75–6.97] |
2.25 [1.97–2.58] |
<0.001 |
7.68 [4.82–8.26] |
2.67 [1.98–3.03] |
0.056 |
4.82 [2.76–7.62] |
2.28 [1.98–2.67] |
<0.001 |
| SUVPeak |
9.9 [5.3–12.7] |
3.4 [2.8–4.1] |
<0.001 |
13.5 [10.6–13.8] |
4.7 [2.9–4.8] |
0.056 |
10.6 [5.4–12.9] |
3.5 [2.9–4.7] |
<0.001 |
| MeanWahl |
4.76 [3.16–7.14] |
2.62 [2.32–3.14] |
<0.001 |
7.37 [5.50–10.32] |
3.18 [2.26–3.46] |
0.056 |
5.40 [3.23–7.86] |
2.65 [2.26–3.20] |
<0.001 |
| SUVqPeak |
11.5 [6.4–13.8] |
4.0 [3.2–4.9] |
<0.001 |
14.2 [12.8–15.4] |
5.4 [3.2–5.8] |
0.056 |
12.8 [6.5–14.3] |
4.1 [3.2–5.4] |
<0.001 |
| MeanQpet |
5.30 [3.49–7.73] |
2.83 [2.51–3.45] |
<0.001 |
7.82 [6.10–11.07] |
3.48 [2.47–3.75] |
0.056 |
5.89 [3.56–8.52] |
2.87 [2.47–3.55] |
<0.001 |
| SUVMax |
11.8 [6.4–14.0] |
4.1 [3.2–5.1] |
<0.001 |
14.3 [12.9–15.6] |
5.4 [3.2–5.8] |
0.056 |
12.9 [6.6–14.7] |
4.2 [3.2–5.4] |
<0.001 |
Data given as median [25%–75%]; P values from Wilcoxon rank-sum
exact test.
Vol.ml, volume only (= MTV); Vol.mean, volume × SUVmean (= total region glycolysis);
SUVMean, mean standardized uptake value; SUVPeak, peak standardized uptake value;
MeanWahl, average of SUVs in each slice that include the delimited VOI of SUVpeak;
SUVqPeak, method for lymphoma as proposed by Hasenclever et
al.18; MeanQpet, average of SUVs in each slice that include the
delimited VOI of SUVqpeak; SUVMax, maximum standardized uptake value.
The correlation coefficient between SUVmean and Vol.means decreased as the cutoff
increased and reached its maximum at PNW, with a cut-off value of 2.0. With an SUV cut-off
value of 3.0, a negative correlation coefficient was observed between survival time and
MTV and Vol.means. Furthermore, the correlation coefficient between Vol.MeanW and
Vol.meanQ was higher than that between Vol.meanW and Vol.mean. The highest correlation
coefficient was observed when Vol.meanW was corrected for body weight. The top 20 results
are summarized in Supplementary Table S2.
Cox regression analysis
Table 6 presents the top three groups in the
Cox regression analysis. Pre-treatment MTV alone was selected as the best parameter for
calculating results based on each parameter using the difference and quotient. This was
followed by pre- and post-treatment Vol.meanQ and pre-treatment Vol.mean. No values
exceeded the obtained PET values. Supplementary Table
S3–1 shows the top 20 parameters by stepwise regression analysis, and
Supplementary Table S3–2 provides detailed
thresholds and cut-off values for Table 6.
Table 6Characteristics of the top three groups of Cox regression results
| Group |
Calculation |
SUVs |
Thresholds |
Correction parameters |
Hazard ratio |
c-statistic |
Likelihood ratio |
| HR |
P
|
95% CI |
LR |
P
|
| 1 |
Prealone |
Vol.ml |
3.0 |
- |
39.4 |
<0.01 |
4.6–339.3 |
0.81 |
21.5 |
<0.01 |
| 2 |
DiffPrePost |
Vol.meanQ |
2.5 |
BMR.ms |
38.5 |
<0.01 |
4.4–333.3 |
0.80 |
20.9 |
<0.01 |
| 3 |
Prealone |
Vol.mean |
2.5, 3.0 |
- |
38.1 |
<0.01 |
4.4–330.9 |
0.80 |
20.7 |
<0.01 |
| DiffPrePost |
Vol.meanW |
2.5, 3.0 |
BMR.ms, BMR.r, BSA, BW, FFM, IBW, LBM.gd, PNW |
38.1 |
<0.01 |
4.4–330.9 |
0.80 |
20.7 |
<0.01 |
| Vol.meanW |
3.0 |
LBM.j |
38.1 |
<0.01 |
4.4–330.9 |
0.80 |
20.7 |
<0.01 |
| Vol.meanQ |
2.5, 3.0 |
BMR.r, BSA, BW, FFM, LBM.gd, PNW |
38.1 |
<0.01 |
4.4–330.9 |
0.80 |
20.7 |
<0.01 |
| Vol.meanQ |
3.0 |
BMR.ms, IBW |
38.1 |
<0.01 |
4.4–330.9 |
0.80 |
20.7 |
<0.01 |
SUVs, standard uptake values; HR, hazard ratio; CI, confidence interval; LR,
likelihood ratio; Prealone, only pre-treatment data are used, with no
post-treatment data included; DiffPrePost, difference between pre-treatment
and post-treatment tests; Vol.mean, volume × SUV mean (= total region glycolysis);
Vol.meanQ, volume × SUV meanQ; Vol.meanW, volume × SUV meanW; BW, body weight; BMI,
body mass index; BSA, body surface area; IBW, ideal body weight; PNW, predicted normal
weight; FFM, fat-free mass; LBM.j, lean body mass (Janmahasatian's estimate); LBM.gd,
lean body mass (Green and Duffull's formula); BMR.r, basal metabolic rate (Roza's
formula); BMR.ms, basal metabolic rate (Mifflin-St Jeor estimate).
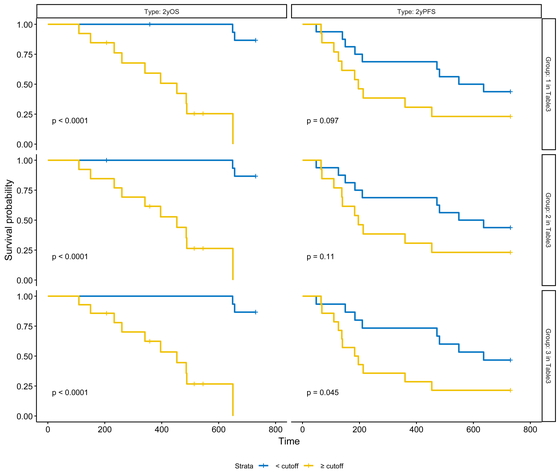
Fig. 6 shows the Kaplan–Meier plots for 2-year
overall and progression-free survival in the top three groups based on HR. The selected
parameters were considered good predictors of overall and progression-free survival.
Discussion
PET parameters and prognosis prediction
For pre- and post-treatment comparisons, the difference between pre-treatment and
post-treatment (DiffPrePost) Vol*Means (MTV SUV threshold of 2.5) corrected for
BMR.ms was selected as the best HR factor. Although the HR value was not superior to the
Prealone MTV single factor, which is currently widely used, it was considered
to be almost equivalent based on the c-statistic.
A report evaluating the parameters of pre-treatment 18F-FDG-PET found that MTV
with an automatic threshold of 20% or 40% was useful (although a fixed value of 3.0 or 2.5
was more useful for the threshold in our study), consistent with our results.42,43,44,45 Kanoun
et al.15 reported
that the baseline MTV in patients with Hodgkin’s lymphoma was a favorable predictor, and
that combination with the difference in SUV before and interim treatment provided a
significant insight into the prognosis. These results were consistent with those of the
present study.
Previous studies of squamous cell carcinoma on the oral side of the diaphragm have
examined ratios and rates of change in MTV and SUV and reported a cutoff for their
correlation with the prognosis.12,13,14
However, in our study the quotient did not show statistically significance, which did not
support the usefulness in prognosis prediction.
Among the DiffPrePost, the difference in Vol.*Means was higher than the
difference in MTV for both HR and likelihood ratio. Only Vol.*MeanQ, which used BMR.ms for
correction, was different from the others. SUVmeanQ (tumor SUV normalized by liver
SUVmean) using BMR.ms for correction was superior to MTV probably because of the small
number of cases and the effect of body fat correction in men and women. FFM, PNW, and LBM
evaluate metabolism by body mass, but BMR also considers age. It is suggested that not
only sex differences but also age correction may be important for LBM. LBM.gd, PNW, and
FFM also resembled BSA and body weight because the range of 160–170 cm, which was common
in this case, was similar, as observed in Fig. 1.
In addition, in this study, the body weight of women was less than 50 kg both before and
after treatment. It is possible that women’s metabolism was overestimated because of the
following factors. First, PNW and LBM (especially PNW and LBM.gd) have smaller sex
differences for patients with low weight. Second, the BMR.r slope tends to flatten for
women. In particular, the values for men and women are reversed when the weight is less
than 50 kg.
Only SUVmeanQ and SUVmeanW were more useful in the differential analysis. This may
reflect insufficient standardization of SUVmean or poor correction of adipose tissue. It
has been reported that the estimated muscle mass from the estimation formula differs
between Asians and other races.46
Regarding the evaluation of LBM, which is related to metabolism, it is considered
necessary to at least consider the root genes (e.g., three races), sex, and age.
In addition to reconstructing the estimation formula, we think that it is one of the
countermeasures to consider the prediction of body weight that contributes to metabolism
according to resting energy expenditure by other methods, including indirect
calorimetry.47 This includes Weir’s
formula48 and its
simplifications.49The Weir equation
is as
follows:
| EEkcal/day=(Consumed.O2L/min×3.941+[Produced.CO2L/min×1.106]−urine.N2g/min×2.17)×1440min/day |
The
simplified Weir equation is as
follows:
| EEkcal/day≈(Consumed.O2L/min×3.9+[Produced.CO2L/min×1.1])×1440min/day |
Although there was a significant difference in the distribution of myocardial uptake and
multifidus muscle uptake before and after treatment, there was no significant trend in the
course of increase or decrease. Therefore, the effect of the glucose metabolism
environment, such as the effect of fasting before the examination, was considered. In
addition to the effect of glucose metabolism, the effects of alcohol50,51,52 and smoking53,54 on
glucose metabolism have been reported.
Reactive oxygen species (ROS) induce glucose metabolic pathways that are distinct from
the normal pathway (e.g., α7nAchR-NF-κB-IL-6 → JAK2/Akt crosstalk).55 α7-Nicotinic acetylcholine receptor
(α7nAchR) is involved in these pathways and is upregulated by the nuclear factor-κB
(NF-κB) pathway involving tumor necrosis factor-α and interleukin-6 (IL-6) induced by
lipopolysaccharide (LPS) produced from intestinal bacteria,56,57 by ethanol,58 or by
nitrosamine ketones derived from tobacco smoke extract and nicotine.59
Although the effects of alcohol withdrawal on LPS are unclear, even though LPS is also
induced by alcohol, the dual effect observed on cytochrome P450 2E1 (CYP2E1) was
short-lived, with no increase in activity after more than 8–10 days of
abstinence.60,61 However, this does not happen after about 3
consecutive days,62 and it takes about 2
weeks to reduce the liver damage caused by chronic alcohol consumption63 and 3 months for normalization of the
metabolic environment in the body.64
CYP2E1-mediated responses in the microsomal ethanol oxidizing system exhibit sex
differences65 and are upregulated by
chronic alcohol consumption.66 This fact
may be more influential in some people, such as many Japanese and some Southeast Asians
who have the ADH1B2 allele (also known as the alcohol dependence gene),
which accelerates the metabolism of ethanol to acetaldehyde, and/or
ALDH2*2, which slows down the metabolism of acetaldehyde to acetate. On
the contrary, the effect of smoking on CYP2E1 regulation is unclear, as there are reports
of both upregulation and downregulation, but the effect of nicotine on α7nAch receptors is
known.67 Therefore, to reduce the
effects of metabolic abnormalities on the test, abstinence from alcohol consumption
(including smoking cessation if possible) for at least 10 days before each pre- and
post-treatment test is desirable.
This study has some limitations. The patients examined and analyzed in this study could
have received irradiation for submucosal tumors that had small volumes before and after
treatment, and this may have underestimated SUV levels in one test because of the partial
volume effect. Therefore, the availability of SUV values related to the amount or rate of
change was a secondary goal. Second, because of the retrospective study design, the time
period in which the patients underwent PET-CT was varied. Cases with post-treatment PET-CT
within 1 month were included, and this included the effect of the post-treatment
inflammatory response. Patients who received preoperative chemotherapy were excluded,
limiting the number of cases.
Despite these limitations, the strength of this study was that it evaluated the strength
and weakness of metabolism by examining changes in the intensity of SUVs rather than
evaluating only the amount of SUV that accumulated above the cutoff value. With regard to
the indirect evaluation of metabolism, the backgrounds of the original studies were
different, and the metabolic formula used for standardization was examined in detail by
comprehensive evaluation of the different distribution characteristics.
In conclusion, considering the effect of age-related decreases in LBM, the difference in
the product of MTV and SUVmeanQ before and after CCRT may be a useful parameter to predict
the prognosis of patients treated with CCRT for esophageal cancer. However, pre-treatment
MTV remains a solid prognostic parameter.
Acknowledgments
The authors thank the late Dr. Shinichi Tominaga (who passed away on September 2, 2018) for
his guidance and support.
Conflicts of Interest
The authors have declared that no conflict of interest exists.
References
- 1. National Comprehensive Cancer Network: Esophageal
and esophagogastric junction cancers (version 2.2022). National Comprehensive Cancer
Network. 2022. https://www.nccn.org/guidelines/guidelines-detail?category=1&id=1433.
Accessed 17 Mar 2023.
- 2. Smyth EC, Verheij M, Allum W, Cunningham D,
Cervantes A, Arnold D, ESMO Guidelines Committee: Gastric cancer: ESMO Clinical Practice
Guidelines for diagnosis, treatment and follow-up. Ann Oncol 2016; 27: v38–v49.
PMID:27664260 https://doi.org/10.1093/annonc/mdw350
- 3. Kumabe A, Fukada J, Kota R, Koike N, Shiraishi Y,
Seki S, Yoshida K, Kitagawa Y, Shigematsu N: Long-term results of concurrent
chemoradiotherapy with daily-low-dose continuous infusion of 5-fluorouracil and cisplatin
(LDFP) for Stage I-II esophageal carcinoma. Dis Esophagus 2018; 31: 1–8. PMID:29228166
https://doi.org/10.1093/dote/dox138
- 4. Shapiro J, van Lanschot JJ, Hulshof MC, van Hagen
P, van Berge Henegouwen MI, Wijnhoven BP, van Laarhoven HW, Nieuwenhuijzen GA, Hospers GA,
Bonenkamp JJ, Cuesta MA, Blaisse RJ, Busch OR, ten Kate FJ, Creemers GJ, Punt CJ, Plukker
JT, Verheul HM, Bilgen EJ, van Dekken H, van der Sangen MJ, Rozema T, Biermann K, Beukema
JC, Piet AH, van Rij CM, Reinders JG, Tilanus HW, Steyerberg EW, van der Gaast A, CROSS
Study Group: Neoadjuvant chemoradiotherapy plus surgery versus surgery alone for
oesophageal or junctional cancer (CROSS): long-term results of a randomised controlled
trial. Lancet Oncol 2015; 16: 1090–1098. PMID:26254683
https://doi.org/10.1016/S1470-2045(15)00040-6
- 5. Fletcher JW, Djulbegovic B, Soares HP, Siegel BA,
Lowe VJ, Lyman GH, Coleman RE, Wahl R, Paschold JC, Avril N, Einhorn LH, Suh WW, Samson D,
Delbeke D, Gorman M, Shields AF: Recommendations on the use of 18F-FDG PET in oncology. J
Nucl Med 2008; 49: 480–508. PMID:18287273
https://doi.org/10.2967/jnumed.107.047787
- 6. Marzola MC, De Manzoni G, Grassetto G, Cordiano
C, Al-Nahhas A, Alavi A, Rubello D. Extended staging of oesophageal cancer using FDG-PET -
a critical appraisal. Eur J Radiol 2012 ; 81: 21-30. PMID: 21055894,
https://doi.org/10.1016/j.ejrad.2010.10.018
- 7. Hoekstra CJ, Stroobants SG, Smit EF,
Vansteenkiste J, van Tinteren H, Postmus PE, Golding RP, Biesma B, Schramel FJ, van
Zandwijk N, Lammertsma AA, Hoekstra OS: Prognostic relevance of response evaluation using
[18F]-2-fluoro-2-deoxy-d-glucose positron emission tomography in patients with locally
advanced non-small-cell lung cancer. J Clin Oncol 2005; 23: 8362–8370. PMID:16293866
https://doi.org/10.1200/JCO.2005.01.1189
- 8. Larson SM, Schwartz LH: 18F-FDG PET as a
candidate for “qualified biomarker”: functional assessment of treatment response in
oncology. J Nucl Med 2006; 47: 901–903. PMID:16741296
- 9. Yap WK, Chang YC, Tseng CK, Hsieh CH, Chao YK, Su
PJ, Hou MM, Yang CK, Pai PC, Lin CR, Hsieh CE, Wu YY, Hung TM: Predictive value of nodal
maximum standardized uptake value of pretreatment [18F]fluorodeoxyglucose positron
emission tomography imaging in patients with esophageal cancer. Dis Esophagus 2017; 30:
1–10. PMID:28575243 https://doi.org/10.1093/dote/dox021
- 10. Cheson BD, Fisher RI, Barrington SF, Cavalli F,
Schwartz LH, Zucca E, Lister TA; Alliance, Australasian Leukaemia and Lymphoma Group;
Eastern Cooperative Oncology Group; European Mantle Cell Lymphoma Consortium; Italian
Lymphoma Foundation; European Organisation for Research; Treatment of Cancer/Dutch
Hemato-Oncology Group; Grupo Español de Médula Ósea; German High-Grade Lymphoma Study
Group; German Hodgkin’s Study Group; Japanese Lymphorra Study Group; Lymphoma Study
Association; NCIC Clinical Trials Group; Nordic Lymphoma Study Group; Southwest Oncology
Group; United Kingdom National Cancer Research Institute: Recommendations for initial
evaluation, staging, and response assessment of Hodgkin and non-Hodgkin lymphoma: the
Lugano classification. J Clin Oncol 2014; 32: 3059–3067. PMID:25113753
https://doi.org/10.1200/JCO.2013.54.8800
- 11. Barrington SF, Mikhaeel NG, Kostakoglu L, Meignan
M, Hutchings M, Müeller SP, Schwartz LH, Zucca E, Fisher RI, Trotman J, Hoekstra OS, Hicks
RJ, O’Doherty MJ, Hustinx R, Biggi A, Cheson BD: Role of imaging in the staging and
response assessment of lymphoma: consensus of the International Conference on Malignant
Lymphomas Imaging Working Group. J Clin Oncol 2014; 32: 3048–3058. PMID:25113771
https://doi.org/10.1200/JCO.2013.53.5229
- 12. Shimizu M, Mitsudo K, Koike I, Taguri M, Iwai T,
Koizumi T, Oguri S, Kioi M, Hirota M, Inoue T, Tohnai I: Prognostic value of 2-[18
F]fluoro-2-deoxy-d-glucose positron emission tomography for patients with oral squamous
cell carcinoma treated with retrograde superselective intra-arterial chemotherapy and
daily concurrent radiotherapy. Oral Surg Oral Med Oral Pathol Oral Radiol 2016; 121:
239–247. PMID:26768076 https://doi.org/10.1016/j.oooo.2015.10.018
- 13. Shimomura H, Sasahira T, Yamanaka Y, Kurihara M,
Imai Y, Tamaki S, Yamakawa N, Shirone N, Hasegawa M, Kuniyasu H, Kirita T:
[18F]fluoro-2-deoxyglucose-positron emission tomography for the assessment of
histopathological response after preoperative chemoradiotherapy in advanced oral squamous
cell carcinoma. Int J Clin Oncol 2015; 20: 308–316. PMID:24942501
https://doi.org/10.1007/s10147-014-0711-5
- 14. Kim H, Yoo IR, Boo SH, Park HL, O JH, Kim SH:
Prognostic value of pre- and post-treatment FDG PET/CT parameters in small cell lung
cancer patients. Nucl Med Mol Imaging 2018; 52: 31–38. PMID:29391910
https://doi.org/10.1007/s13139-017-0490-9
- 15. Kanoun S, Rossi C, Berriolo-Riedinger A,
Dygai-Cochet I, Cochet A, Humbert O, Toubeau M, Ferrant E, Brunotte F, Casasnovas RO:
Baseline metabolic tumour volume is an independent prognostic factor in Hodgkin lymphoma.
Eur J Nucl Med Mol Imaging 2014; 41: 1735–1743. PMID:24811577
https://doi.org/10.1007/s00259-014-2783-x
- 16. Jayachandran P, Pai RK, Quon A, Graves E, Krakow
TE, La T, Loo BW, Koong AC, Chang DT: Postchemoradiotherapy positron emission tomography
predicts pathologic response and survival in patients with esophageal cancer. Int J Radiat
Oncol Biol Phys 2012; 84: 471–477. PMID:22381904
https://doi.org/10.1016/j.ijrobp.2011.12.029
- 17. Boellaard R, Delgado-Bolton R, Oyen WJ,
Giammarile F, Tatsch K, Eschner W, Verzijlbergen FJ, Barrington SF, Pike LC, Weber WA,
Stroobants S, Delbeke D, Donohoe KJ, Holbrook S, Graham MM, Testanera G, Hoekstra OS,
Zijlstra J, Visser E, Hoekstra CJ, Pruim J, Willemsen A, Arends B, Kotzerke J, Bockisch A,
Beyer T, Chiti A, Krause BJ, European Association of Nuclear Medicine (EANM): FDG PET/CT:
EANM procedure guidelines for tumour imaging: version 2.0. Eur J Nucl Med Mol Imaging
2015; 42: 328–354. PMID:25452219
https://doi.org/10.1007/s00259-014-2961-x
- 18. Hasenclever D, Kurch L, Mauz-Körholz C, Elsner A,
Georgi T, Wallace H, Landman-Parker J, Moryl-Bujakowska A, Cepelová M, Karlén J, Álvarez
Fernández-Teijeiro A, Attarbaschi A, Fosså A, Pears J, Hraskova A, Bergsträsser E,
Beishuizen A, Uyttebroeck A, Schomerus E, Sabri O, Körholz D, Kluge R: qPET—a quantitative
extension of the Deauville scale to assess response in interim FDG-PET scans in lymphoma.
Eur J Nucl Med Mol Imaging 2014; 41: 1301–1308. PMID:24604592
https://doi.org/10.1007/s00259-014-2715-9
- 19. Wahl RL, Jacene H, Kasamon Y, Lodge MA: From
RECIST to PERCIST: evolving considerations for PET response criteria in solid tumors. J
Nucl Med 2009; 50: 122S–150S. PMID:19403881
https://doi.org/10.2967/jnumed.108.057307
- 20. Kanoun S, Tal I, Berriolo-Riedinger A, Rossi C,
Riedinger JM, Vrigneaud JM, Legrand L, Humbert O, Casasnovas O, Brunotte F, Cochet A:
Influence of software tool and methodological aspects of total metabolic tumor volume
calculation on baseline [18F]FDG PET to predict survival in Hodgkin lymphoma. PLoS One
2015; 10: e0140830. PMID:26473950
https://doi.org/10.1371/journal.pone.0140830
- 21. Schindelin J, Arganda-Carreras I, Frise E, Kaynig
V, Longair M, Pietzsch T, Preibisch S, Rueden C, Saalfeld S, Schmid B, Tinevez JY, White
DJ, Hartenstein V, Eliceiri K, Tomancak P, Cardona A: Fiji: an open-source platform for
biological-image analysis. Nat Methods 2012; 9: 676–682. PMID:22743772
https://doi.org/10.1038/nmeth.2019
- 22. Schneider CA, Rasband WS, Eliceiri KW: NIH Image
to ImageJ: 25 years of image analysis. Nat Methods 2012; 9: 671–675. PMID:22930834
https://doi.org/10.1038/nmeth.2089
- 23. Kubota K, Matsuzawa T, Ito M, Ito K, Fujiwara T,
Abe Y, Yoshioka S, Fukuda H, Hatazawa J, Iwata R, Watanuki S, Ido T: Lung tumor imaging by
positron emission tomography using C-11 l-methionine. J Nucl Med 1985; 26: 37–42.
PMID:2981300
- 24. Devine B: Gentamicin therapy. Drug Intell Clin
Pharm 1974; 8: 650–655.
- 25. Duffull SB, Dooley MJ, Green B, Poole SG,
Kirkpatrick CM: A standard weight descriptor for dose adjustment in the obese patient.
Clin Pharmacokinet 2004; 43: 1167–1178. PMID:15568893
https://doi.org/10.2165/00003088-200443150-00007
- 26. Du Bois D, Du Bois EF: A formula to estimate the
approximate surface area if height and weight be known. 1916. Nutrition 1989; 5: 303–313.
PMID:2520314
- 27. Garrow JS, Webster J: Quetelet’s index (W/H2) as
a measure of fatness. Int J Obes (Lond) 1985; 9: 147–153. PMID:4030199
- 28. Roza AM, Shizgal HM: The Harris Benedict equation
reevaluated: resting energy requirements and the body cell mass. Am J Clin Nutr 1984; 40:
168–182. PMID:6741850 https://doi.org/10.1093/ajcn/40.1.168
- 29. Mifflin MD, St Jeor ST, Hill LA, Scott BJ,
Daugherty SA, Koh YO: A new predictive equation for resting energy expenditure in healthy
individuals. Am J Clin Nutr 1990; 51: 241–247. PMID:2305711
https://doi.org/10.1093/ajcn/51.2.241
- 30.Green B, Duffull S: Caution when lean body
weight is used as a size descriptor for obese subjects. Clin Pharmacol Ther 2002; 72:
743–744. https://doi.org/10.1067/mcp.2002.129306
- 31. Janmahasatian S, Duffull SB, Ash S, Ward LC,
Byrne NM, Green B: Quantification of lean bodyweight. Clin Pharmacokinet 2005; 44:
1051–1065. PMID:16176118 https://doi.org/10.2165/00003088-200544100-00004
- 32. R Core Team: R: a language and environment for
statistical computing. R Foundation for Statistical Computing. 2022.
https://www.R-project.org/. Accessed 17 Mar 2023.
- 33. Robin X, Turck N, Hainard A, Tiberti N, Lisacek
F, Sanchez JC, Müller M: pROC: display and analyze ROC curves. 2021.
http://expasy.org/tools/pROC/. Accessed 17 Mar 2023.
- 34. Therneau TM: Survival: survival analysis. 2022.
https://github.com/therneau/survival. Accessed 17 Mar 2023.
- 35. Ripley B: MASS: support functions and datasets
for Venables and Ripley’s MASS. 2022. http://www.stats.ox.ac.uk/pub/MASS4/. Accessed 17
Mar 2023.
- 36. Breaux HJ: A modification of Efroymson’s
technique for stepwise regression analysis. Commun ACM 1968; 11: 556–558.
https://doi.org/10.1145/363567.363580
- 37. Akaike H: A new look at the statistical model
identification. IEEE Trans Automat Contr 1974; 19: 716–723.
https://doi.org/10.1109/TAC.1974.1100705
- 38. Akobeng AK: Understanding diagnostic tests 3:
receiver operating characteristic curves. Acta Paediatr 2007; 96: 644–647. PMID:17376185
https://doi.org/10.1111/j.1651-2227.2006.00178.x
- 39. Heinze G, Ploner M, Jiricka L: Logistf: Firth’s
bias-reduced logistic regression. 2022.
https://cemsiis.meduniwien.ac.at/en/kb/science-research/software/statistical-software/firth-correction/.
Accessed 17 Mar 2023.
- 40. Firth D: Bias reduction of maximum likelihood
estimates. Biometrika 1993; 80: 27–38.
https://doi.org/10.1093/biomet/80.1.27
- 41. Straub B, Chacon S: Pro Git, 2nd edition. USA:
Apress; 2014.
- 42. Chen SW, Hsieh TC, Ding HJ, Yen KY, Lin CY, Liang
JA, Kao CH: Pretreatment metabolic tumor volumes to predict the short-term outcome of
unresectable locally advanced squamous cell carcinoma of the esophagus treated with
definitive chemoradiotherapy. Nucl Med Commun 2014; 35: 291–297. PMID:24276528
https://doi.org/10.1097/MNM.0000000000000046
- 43. Lemarignier C, Di Fiore F, Marre C, Hapdey S,
Modzelewski R, Gouel P, Michel P, Dubray B, Vera P: Pretreatment metabolic tumour volume
is predictive of disease-free survival and overall survival in patients with oesophageal
squamous cell carcinoma. Eur J Nucl Med Mol Imaging 2014; 41: 2008–2016. PMID:25037871
https://doi.org/10.1007/s00259-014-2839-y
- 44. Li Y, Lin Q, Wang L, Sun L, Dai M, Luo Z, Zheng
H, Zhao L, Wu H: Application of sequential (18)F-FDG PET/CT scans for concurrent
chemoradiotherapy of non-surgical squamous cell esophageal carcinoma. J Balkan Union Oncol
2014; 19: 517–523. PMID:24965415
- 45. Betancourt SL, Marom EM, Palacio D, Correa M,
Hofstetter WL: Prognostic value of initial FDG-PET/CT metabolic tumor volume in patients
with resectable esophageal adenocarcinoma. JSM Gastroenterol Hepatol 2015; 3:
1037–1044.
- 46. Janssen I, Heymsfield SB, Baumgartner RN, Ross R:
Estimation of skeletal muscle mass by bioelectrical impedance analysis. J Appl Physiol
2000; 89: 465–471. PMID:10926627
https://doi.org/10.1152/jappl.2000.89.2.465
- 47. Thomas N, Gupta RD, Ramachandran R, Venkatesan P,
Anoop S, Joseph M: Indirect calorimetry: from bench to bedside. Indian J Endocrinol Metab
2017; 21: 594–599. PMID:28670546 https://doi.org/10.4103/ijem.IJEM_484_16
- 48. Weir JB: New methods for calculating metabolic
rate with special reference to protein metabolism. J Physiol 1949; 109: 1–9. PMID:15394301
https://doi.org/10.1113/jphysiol.1949.sp004363
- 49. Mehta NM, Smallwood CD, Joosten KF, Hulst JM,
Tasker RC, Duggan CP: Accuracy of a simplified equation for energy expenditure based on
bedside volumetric carbon dioxide elimination measurement—a two-center study. Clin Nutr
2015; 34: 151–155. PMID:24636151
https://doi.org/10.1016/j.clnu.2014.02.008
- 50. Volkow ND, Wang GJ, Shokri Kojori E, Fowler JS,
Benveniste H, Tomasi D: Alcohol decreases baseline brain glucose metabolism more in heavy
drinkers than controls but has no effect on stimulation-induced metabolic increases. J
Neurosci 2015; 35: 3248–3255. PMID:25698759
https://doi.org/10.1523/JNEUROSCI.4877-14.2015
- 51. Gispert JD, Figueiras FP, Vengeliene V, Herance
JR, Rojas S, Spanagel R: Changes in cerebral [18F]-FDG uptake induced by acute alcohol
administration in a rat model of alcoholism. Behav Brain Res 2017; 327: 29–33.
PMID:28347826 https://doi.org/10.1016/j.bbr.2017.03.038
- 52. Jacob A, Wang P: Alcohol intoxication and
cognition: implications on mechanisms and therapeutic strategies. Front Neurosci 2020; 14:
102. PMID:32116535 https://doi.org/10.3389/fnins.2020.00102
- 53. Rengier F, Weber TF, Henninger V, Böckler D,
Schumacher H, Kauczor HU, von Tengg-Kobligk H: Heartbeat-related distension and
displacement of the thoracic aorta in healthy volunteers. Eur J Radiol 2012; 81: 158–164.
PMID:20850234 https://doi.org/10.1016/j.ejrad.2010.08.023
- 54. Tong L, Sui Y, Jiang S, Yin Y: The association
between lung fluorodeoxyglucose metabolism and smoking history in 347 healthy adults. J
Asthma Allergy 2021; 14: 301–308. PMID:33840997
https://doi.org/10.2147/JAA.S302602
- 55. Akbari M, Hassan-Zadeh V: IL-6 signalling
pathways and the development of type 2 diabetes. Inflammopharmacology 2018; 26: 685–698.
PMID:29508109 https://doi.org/10.1007/s10787-018-0458-0
- 56. Liangpunsakul S, Toh E, Ross RA, Heathers LE,
Chandler K, Oshodi A, McGee B, Modlik E, Linton T, Mangiacarne D, Jimenez C, Dong XC, Wang
L, Tu W, Nelson DE: Quantity of alcohol drinking positively correlates with serum levels
of endotoxin and markers of monocyte activation. Sci Rep 2017; 7: 4462. PMID:28667254
https://doi.org/10.1038/s41598-017-04669-7
- 57. Bala S, Marcos M, Gattu A, Catalano D, Szabo G:
Acute binge drinking increases serum endotoxin and bacterial DNA levels in healthy
individuals. PLoS One 2014; 9: e96864. PMID:24828436
https://doi.org/10.1371/journal.pone.0096864
- 58. Gorbounova O, Svensson AL, Jönsson P, Mousavi M,
Miao H, Hellström-Lindahl E, Nordberg A: Chronic ethanol treatment decreases
[3H]epibatidine and [3H]nicotine binding and differentially regulates mRNA levels of
nicotinic acetylcholine receptor subunits expressed in M10 and SH-SY5Y neuroblastoma
cells. J Neurochem 1998; 70: 1134–1142. PMID:9489734
https://doi.org/10.1046/j.1471-4159.1998.70031134.x
- 59. Lee AT, Xu Z, Pothula SP, Patel MB, Pirola RC,
Wilson JS, Apte MV: Alcohol and cigarette smoke components activate human pancreatic
stellate cells: implications for the progression of chronic pancreatitis. Alcohol Clin Exp
Res 2015; 39: 2123–2133. PMID:26463405 https://doi.org/10.1111/acer.12882
- 60. Perrot N, Nalpas B, Yang CS, Beaune PH:
Modulation of cytochrome P450 isozymes in human liver, by ethanol and drug intake. Eur J
Clin Invest 1989; 19: 549–555. PMID:2515975
https://doi.org/10.1111/j.1365-2362.1989.tb00273.x
- 61. Oneta CM, Lieber CS, Li J, Rüttimann S, Schmid B,
Lattmann J, Rosman AS, Seitz HK: Dynamics of cytochrome P4502E1 activity in man: induction
by ethanol and disappearance during withdrawal phase. J Hepatol 2002; 36: 47–52.
PMID:11804663 https://doi.org/10.1016/S0168-8278(01)00223-9
- 62. Yin H, Ingelman-Sundberg M, Lindros KO: Induction
mechanisms of cytochrome P450 2E1 in liver: interplay between ethanol treatment and
starvation. Biochem Pharmacol 1995; 50: 155–161. PMID:7632158
https://doi.org/10.1016/0006-2952(95)00128-M
- 63. Kirpich IA, McClain CJ, Vatsalya V, Schwandt M,
Phillips M, Falkner KC, Zhang L, Harwell C, George DT, Umhau JC: Liver injury and
endotoxemia in male and female alcohol-dependent individuals admitted to an alcohol
treatment program. Alcohol Clin Exp Res 2017; 41: 747–757. PMID:28166367
https://doi.org/10.1111/acer.13346
- 64. Addolorato G, Capristo E, Greco AV, Caputo F,
Stefanini GF, Gasbarrini G: Three months of abstinence from alcohol normalizes energy
expenditure and substrate oxidation in alcoholics: a longitudinal study. Am J
Gastroenterol 1998; 93: 2476–2481. PMID:9860412
https://doi.org/10.1111/j.1572-0241.1998.00707.x
- 65. Penaloza CG, Cruz M, Germain G, Jabeen S, Javdan
M, Lockshin RA, Zakeri Z: Higher sensitivity of female cells to ethanol: methylation of
DNA lowers Cyp2e1, generating more ROS. Cell Commun Signal 2020; 18: 111. PMID:32653010
https://doi.org/10.1186/s12964-020-00616-8
- 66. Lieber CS: The discovery of the microsomal
ethanol oxidizing system and its physiologic and pathologic role. Drug Metab Rev 2004; 36:
511–529. PMID:15554233 https://doi.org/10.1081/DMR-200033441
- 67. Wu Y, Song P, Zhang W, Liu J, Dai X, Liu Z, Lu Q,
Ouyang C, Xie Z, Zhao Z, Zhuo X, Viollet B, Foretz M, Wu J, Yuan Z, Zou MH: Activation of
AMPKα2 in adipocytes is essential for nicotine-induced insulin resistance in vivo. Nat Med
2015; 21: 373–382. PMID:25799226 https://doi.org/10.1038/nm.3826