Review Papers
Mechanical Resistance due to Shearing of Partially Wet Granular Media
2013 年 30 巻 p. 109-118
詳細
2013 年 30 巻 p. 109-118
Mixing granular media with a given amount of liquid is an operation conducted and used intensively for the preparation of concrete. The power and time required to obtain good homogeneity of the granular paste are known to have a complex relationship with the physical properties of the particles, with the liquid and with the mixer design. In this paper some of these issues are addressed by evaluating the shear resistance of a granular paste. Using model spherical materials (glass beads) and ground and sieved minerals (calcite CaCO3), we investigate experimentally the impact of the particle size, liquid amount and morphology of the particles.
From quasi-static experiments in shear cells, different regimes of shear resistance are revealed. In dry conditions, van der Waals’ forces dominate. In wet conditions, a capillary or consolidation regime where shear resistance is dominated by capillary forces is strongly impacted by the morphology of the particles and by the formation of texture. These regimes are qualitatively observed in a bowl mixer for which the variation of the current intensity correlates with the shear resistance observed in quasi-static experiments.
In order to understand why the mixing of a composition requires more or less energy than another composition, we need to classify the different factors (powders and liquid properties, process parameters) and the different forces (capillary, van der Waals, gravitational, frictional and viscous forces) that have an effect on the shear resistance1–3). Usually, power or intensity consumption measurements are taken during mixing to evaluate the different wetting states4–8). The use of progressive addition, with a controlled flow, makes it possible to differentiate the various wetting regimes. The consumption intensity profile, represented as a function of mixing time or of the amount of liquid added, may be related to different states of liquid saturation (Fig. 1a, 1b): dry state, pendular state when particles are held together by a liquid bridge at their contact points, capillary state, occurring when all the voids are filled with the liquid and the surface liquid is drawn back into the pores under capillary action, and funicular state as a transition state between the pendular and capillary state where the voids are not fully saturated with liquid.
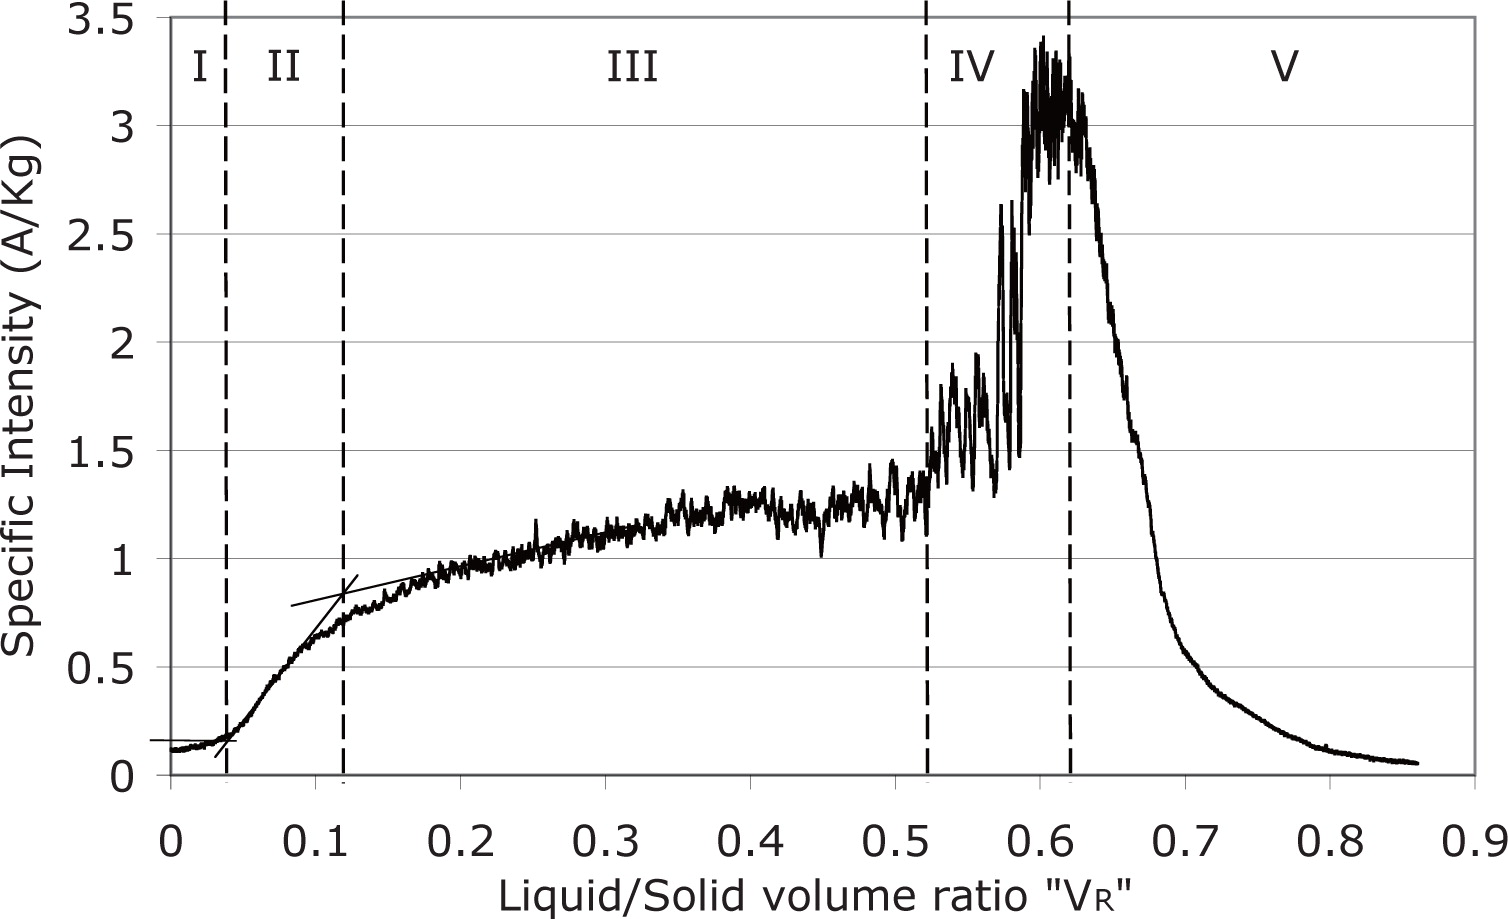
Intensity consumption of the calcite 1 mixed with a progressive water addition (40 ml/min; 120 rpm) and schematic wetting regime states (pendular II, funicular III, capillary IV)
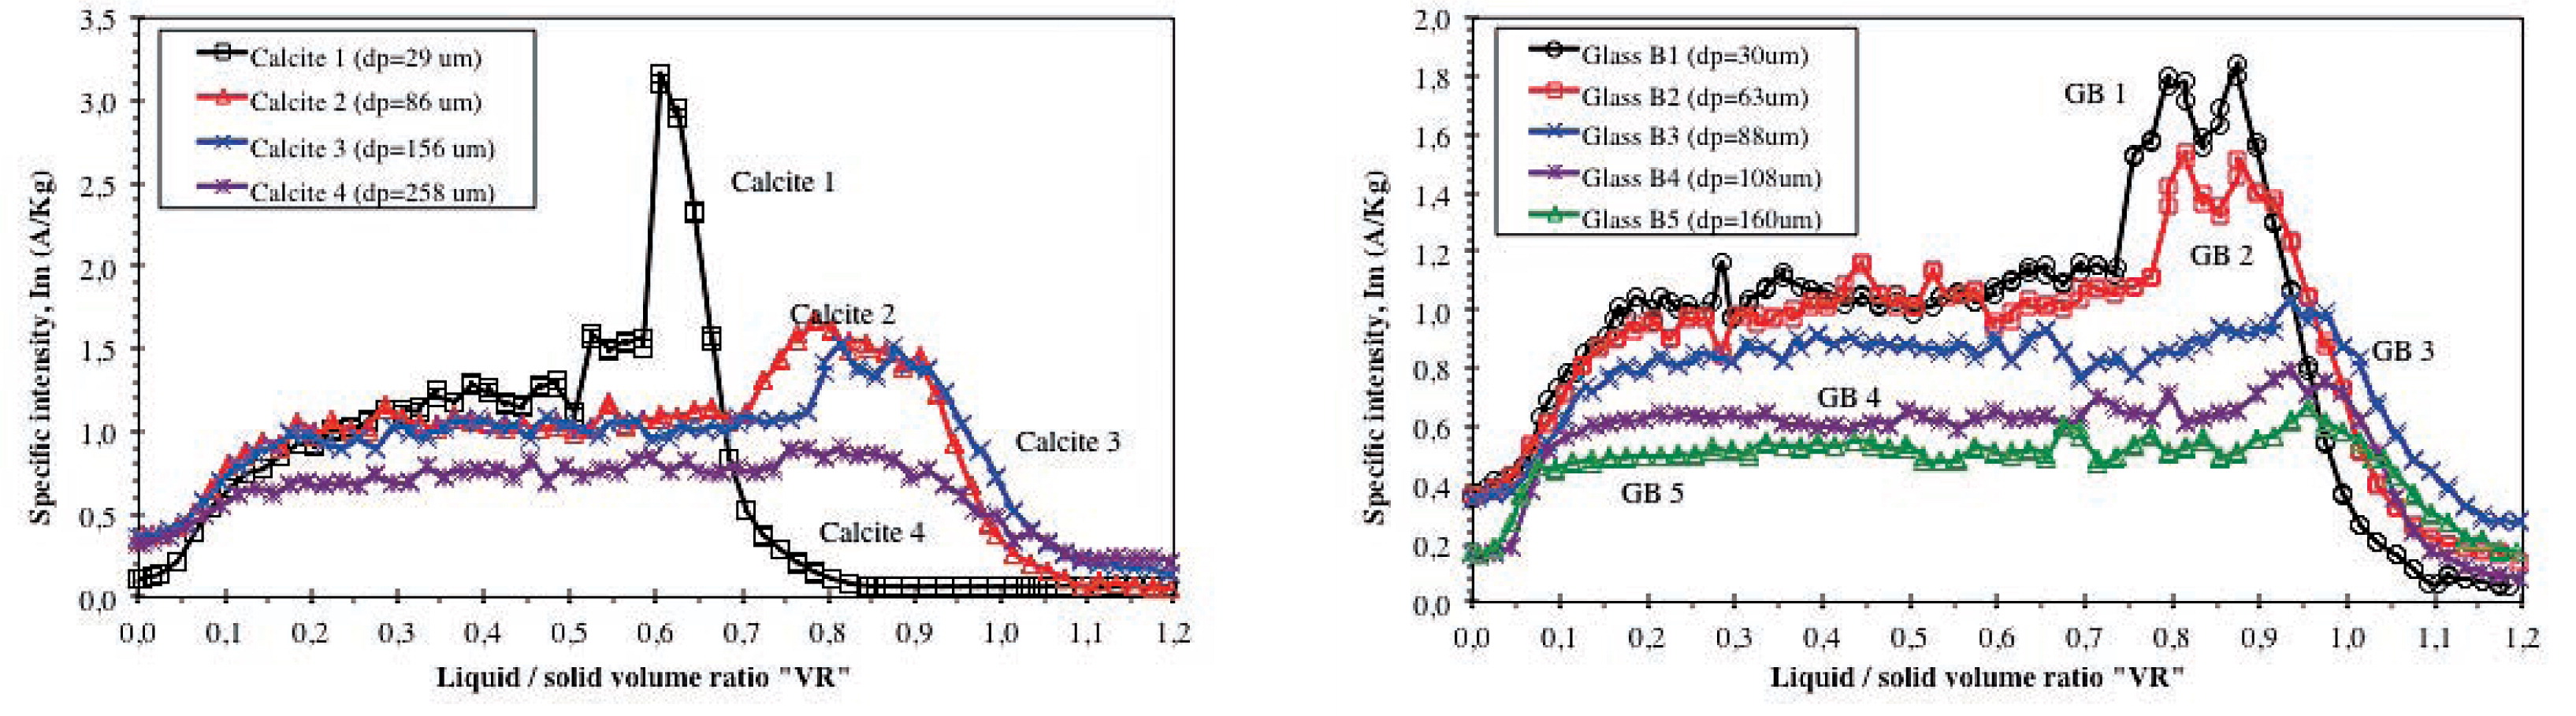
Intensity consumption of the calcite (left) or glass beads (right) mixed with a progressive water addition (40 ml/min; 120 rpm) in a planetary mixer CAD.
In a recent work9–11), we showed that the behaviour of the granular medium during mixing (planetary mixer) is greatly affected by the granular properties, by the mixer process parameters and by the liquid addition method. We also studied the interparticulate porosity of granular samples removed during mixing, and the effects of particle size. Measurements of calcite granular porosities during mixing (with water) showed that the porosity is not constant from the dry to the capillary state9–11), the capillary state being denser then the funicular state.
The mixing energy consumption depends on the particle interaction forces, their density and how the shear deformation occurs in the mixer. To distinguish these contributions, an alternative method is to study particulate interactions in a quasi-static shear tester, for which the shear deformation is well controlled.
Generally, quasi-static tests are used with dry powders to study cohesive flow behaviour. The flow data obtained can then be used to design silos and hoppers that provide gravitational flow12, 18). We used such a device to obtain information about cohesive (capillary or van der Waals’ forces) and frictional forces acting in wet granular media. The low velocity used leads to negligible viscous forces when compared to capillary forces. The second advantage of using a shear cell is that it simplifies definition of the shearing zone, which is reduced to a known surface plane. The simplicity of the shear area allows the shear stress to be calculated.
Section II of this paper presents the shear test, a short description of the Schulze annular shear cell and the materials used. Section III summarises the results obtained for the quasi-static shear cell experiments, taking into account the influence of the consolidated normal load, the amount of liquid, the mean diameter, and the shape of the particles. Finally, the last section presents a comparative evaluation between quasi-static and shear mixing experiments.
The materials used (Table 1) were spherical glass beads supplied by SOVITEC® and calcites supplied by OMYA®. The volume size distributions were obtained by a MALVERN® Mastersizer 2000. The wetting angles with water θ were obtained from capillary rise experiments, using the methodology of Galet13). The average volume roundness index iV50 (ratio of the smaller and higher diameters of the particle) came from a volumetric roundness distribution obtained with the MALVERN® PharmaVision 830 (PVS) automated optical device (2D). The true density of the solids ρS was obtained using a helium pycnometer (Accupyc 1330-MICROMERITIC®), and the dry porosities ε (or the compacity C) by using the values of the true ρS and bulk ρ densities:
| (1) |
| dV10 (μm) | dV50 (μm) | dV90 (μm) |
|
True density ρS (g/cm3) | Bulk density ρ (g/cm3) | Porosity ε (%) (dry state) | Contact angle (water) θ | iV10 | Sphericity index iV50 | iV90 | |
| Glass beads 1 | 18 | 30 | 48 | 1.00 | 2.48 | 1.44 | 42 | 0 | 0.45 | 0.91 | 0.95 |
| Glass beads 2 | 45 | 63 | 88 | 0.68 | 2.51 | 1.43 | 43 | 0 | - | - | - |
| Glass beads 3 | 64 | 88 | 122 | 0.66 | 2.51 | 1.49 | 41 | 0 | 0.47 | 0.96 | 0.98 |
| Glass beads 4 | 78 | 108 | 149 | 0.66 | - | - | - | 0 | - | - | - |
| Glass beads 5 | 117 | 160 | 219 | 0.64 | 2.52 | 1.49 | 41 | 0 | 0.68 | 0.96 | 0.99 |
| Glass beads 6 | 164 | 218 | 295 | 0.60 | - | - | - | 0 | - | - | - |
| Glass beads 7 | 194 | 261 | 353 | 0.61 | 2.52 | 1.46 | 42 | 0 | 0.60 | 0.94 | 0.99 |
| Glass beads 8 | 244 | 332 | 455 | 0.64 | 2.49 | 1.49 | 40 | 0 | - | - | - |
| Calcites 1 | 3 | 29 | 68 | 2.24 | 2.73 | 1.32 | 51 | 51 | 0.35 | 0.71 | 0.90 |
| Calcites 2 | 55 | 86 | 142 | 1.01 | 0.73 | 1.31 | 52 | 51 | 0.49 | 0.77 | 0.92 |
| Calcites 3 | 102 | 156 | 225 | 0.79 | 0.73 | 1.36 | 50 | 51 | 0.51 | 0.73 | 0.89 |
| Calcites 4 | 181 | 258 | 354 | 0.67 | 0.73 | 1.38 | 49 | 51 | 0.45 | 0.71 | 0.88 |
Every quasi-static shear test was carried out with a dry or wet granular medium previously mixed in a planetary mixer from the CAD® Company (Mlx60)9–11). This mixer can be used to make a paste, and it allows the power consumption to be recorded at a frequency of 10 points per second. The available rotation velocity is between 0 and 300 rpm and the volume of the bowl is 4 litres. A preliminary study allowed the process parameters to be set at the following values: an impeller speed of 120 rpm, a droplet-by-droplet liquid flow rate of 40 ml/min, and an initial bulk volume of 1250 cm3, corresponding to a 32% filling rate of the bowl mixer.
To study the interaction forces that take place during the shearing, we used an annular shear cell allowing a sheared interface3of known constant area. The shear velocity was given by the rotational speed (ω = 3.5 10−3 rad/s, ranges from 100 to 200 μm/s from the inner (6 cm) to the outer (12 cm) diameter of the cell). These velocities give very low capillary numbers (of the order 10−5), allowing the viscous forces to be neglected in these quasi-static experiments.
An experimental standard method developed by Jenike14, 18) was used. This method consists of measuring a yield locus, i.e. the tangential stress necessary to shear a granular medium for a given normal stress and a powder sample previously prepared by a consolidation process. It is a two-step measurement. During the first step, the shear under a normal stress σc consolidates the granular sample to a critical state where there are no further variations in volume. The resulting consolidated shearing stress τc is constant. The sample is then sheared under a normal load σ, which is lower than σc. This second step allows the yield shear stress τy to be obtained at the peak, and the steady-state shear stress τD to be measured when a plateau is reached again in the shear stress versus deformation curve or time. These two stages are repeated several times with a constant consolidated normal stress σc and an increasing normal stress15–16) (see Fig. 2).

Shear test (left) and corresponding yield (squares) and dynamic (circles) locii for the 50–125 μm sieved calcite with a liquid to solid ratio of 0.5. The consolidation normal stress here is σc = 9.3 kPa.
The curves representing the yield and the steady-state shear stress (τS or τD) versus the normal stress σ are called the yield17–19) and the dynamic locus, respectively. In the present study, they are both well fitted by a linear Coulombic law:
| (2) |
Since the cohesion appears to increase with the consolidation, this procedure is repeated for at least three normal consolidation stresses. Finally, following the Jenike methodology, rather than using the pair (c, σc), we compute the unconfined yield stress fc and the maximal principal stress σI. These quantities are obtained from the yield locus using the Mohr circles representative of the stress state of an unconfined material at failure, and the maximal stress state for this consolidation (the left and right circles in Fig. 3, respectively). fc is the minimal stress necessary to shear an unconfined consolidated material and σI the maximal stress that this consolidated material has experienced previously. It is observed that the greater the consolidation, the greater the unconfined yield stress. The one-point Flow Function as defined by Schultze18) is the ratio (σI/fc). In this paper, we investigate the evolution of the ratio (fc/ σI): inverse ratio of the definition of Schulze. Changes in the ratio is an increasing function whose slope is limited. Indeed, the yield stress τy remains lower than the shear stress at consolidation (τC = μDσC), which gives the yield locus in Fig. 3 a positive slope. As a consequence, the diameter of the left Mohr circle is, at most, equal to the diameter of the right Mohr circle, giving the following:
| (3) |
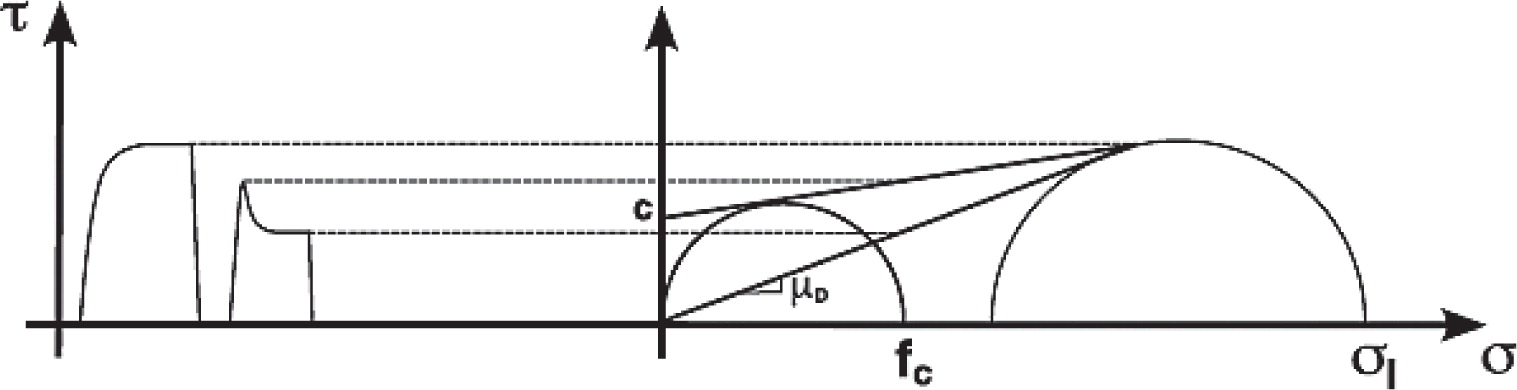
Yield locus construction from shear experiment data. Mohr circles for the determination of fc and σI.
The effects of consolidation and liquid amount on cohesive and frictional interactions were studied with both glass beads and calcites at different particle size distributions (Table 1). They were sheared in dry conditions and wet states with a volume-liquid ratio (VR: ratio of liquid volume by solid volume) up to 0.6. From each yield locus, the cohesion is linearly extrapolated and Fig. 4-left gives the results obtained for the calcite sieved between 50 and 125 μm. The cohesion, which has a non-zero value at the dry state due to the van der Waals’ forces, increases when adding the liquid to reach a plateau value when the liquid amount attains 10% in volume. This plateau is maintained until 60% in volume.

Cohesion (left) and dynamic friction coefficient (right) of the calcite 50–125 μm as a function of liquid amount, for 3 consolidation normal stresses (0.25, 0.5 and 1 kPa).
Three consolidation normal stresses were used (0.25, 0.5 and 1 kPa). It was observed that the cohesion increases proportionally to the consolidation normal stress. As a consequence, for reasons of clarity, the results will be presented using the ratio fc/σI. This ratio is independent of the consolidation, in the range of liquid content between 10 to 60%. The Flow Function (the relationship between the unconfined yield stress fc and the maximal principal stress σI) is therefore fully characterised by their ratio.
To conclude this section, the cohesion for wetted granular media is linked both to the liquid and to the compacity (caused by the consolidation procedure in a shearing test). Strengthening by the addition of liquid is considerable from the dry state to a liquid/solid volume ratio equal to 0.1. For higher liquid amounts, the cohesion remains constant, and the strength is only dependent on the consolidation. These results are in accordance with the fact that the capillary force does not vary very much with the volume of the liquid bridge20, 21). As a consequence, in the following section, we shall restrict discussion to only two cases: the dry state and the funicular state. The latter is chosen at a mean value for a liquid ratio between 30 to 40%, for which the quasi-static results and energy consumption for mixing presented in section IV are mainly independent of the liquid ratio. Finally, the presence of liquid also modifies the dynamic friction behaviour of the granular medium.
3. 2 Particle size effectFor both glass beads and calcites, the evolutions of the dynamic coefficient of friction μD and the ratio (fc/σI) were studied while varying the mean size of the quasi-monodisperse granular materials.
Glass beads and calcites with different sizes (between 30 and 330 μm) were used to perform shear experiments in the dry and funicular wet state. The ratio (fc/σI) and dynamic friction coefficient data from yield and dynamic loci are displayed as a function of the inverse of particle diameter in Fig. 5.
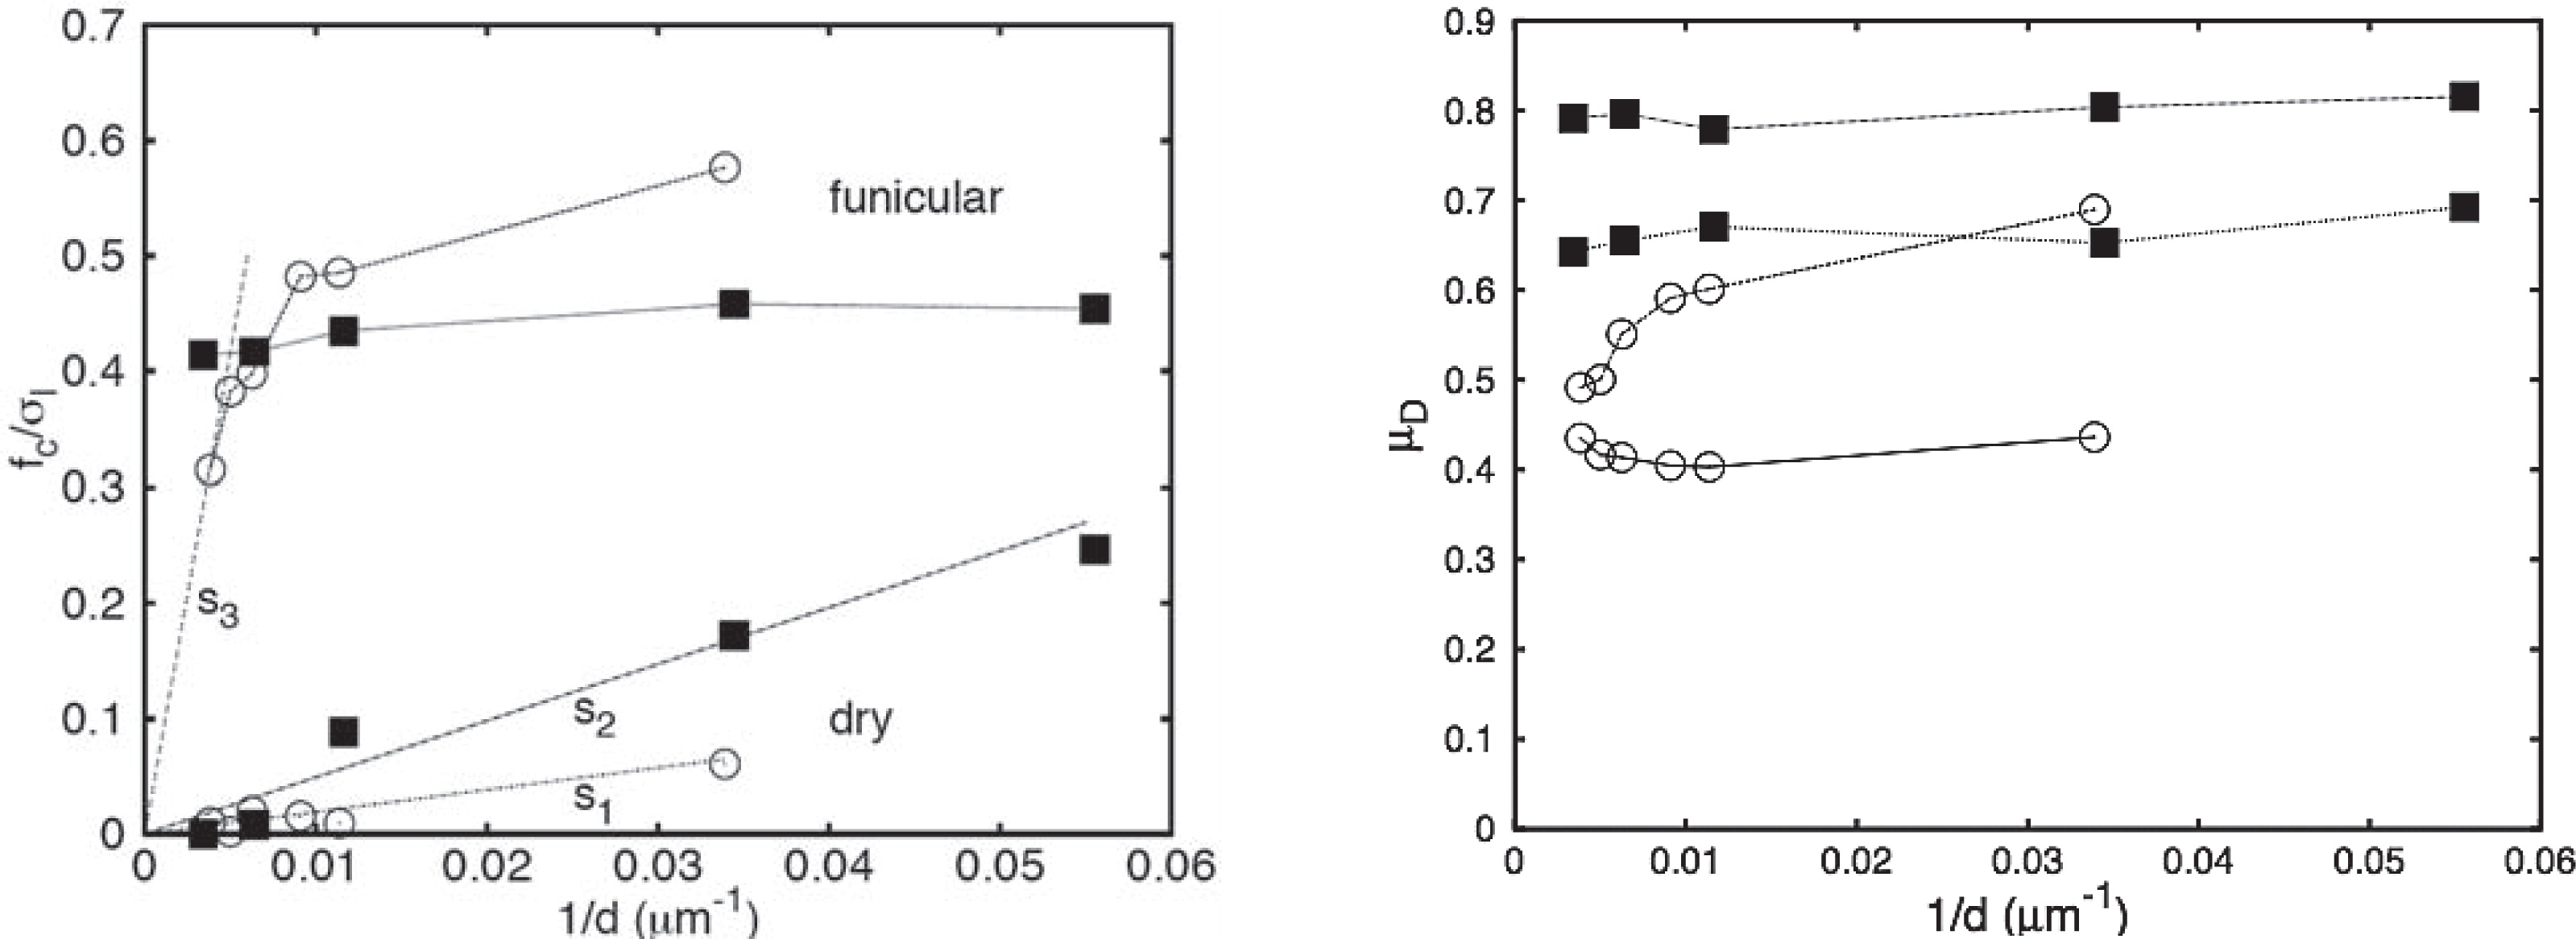
Inverse of the one-point Flow Function of calcites and glass beads (left) or coefficient of dynamic friction (right) as a function of the inverse of the mean diameter for dry and funicular states. Squares: calcites, circles: glass beads.
For the unconfined yield stress normalised by the principal maximal consolidation stress, Fig. 5-left displays the behaviour at dry and funicular conditions.
Dry case, calcites and glass beads: The evolution of (fc/σI) for the dry case is close to being inversely proportional to the particle size, as may be inferred by the Rumpf relation22). Rumpf writes the tensional resistance T of a cohesive granular material as:
| (4) |
| (5) |
It is possible to obtain the constant of proportionality between the Flow Function and the particle size for the calcites and the glass beads by measuring the slopes s1 and s2 in Fig. 5-left. Their difference when changing the material is due to several factors: the Hamaker constant A is different, the roughness and sphericity of both materials are different and finally, the texture of the particle assembly, i.e. the porosity and coordination number may be different. For ε and κ, which are geometric numbers, we expect equivalent values for both materials since they are close to monodispersity.
We find that the ratio of the slopes of the linear fits of (fc/σI) versus (d−1) in the dry conditions for the calcite and glass beads gives a factor of 2.4, which is similar to the ratio of the Hamaker constants of the two materials (Aglass = 6.5 10−20 J, Acalcite = 10.1 10−20 J). This result is quite satisfying and indicates that the particle roughness and the morphology of the calcite, compared to the glass beads, have a low impact on the magnitude of the van der Waals’ forces.
Wet case, glass beads: In the funicular state, the dominant interparticulate force is the capillary force, which can be written as:
| (6) |
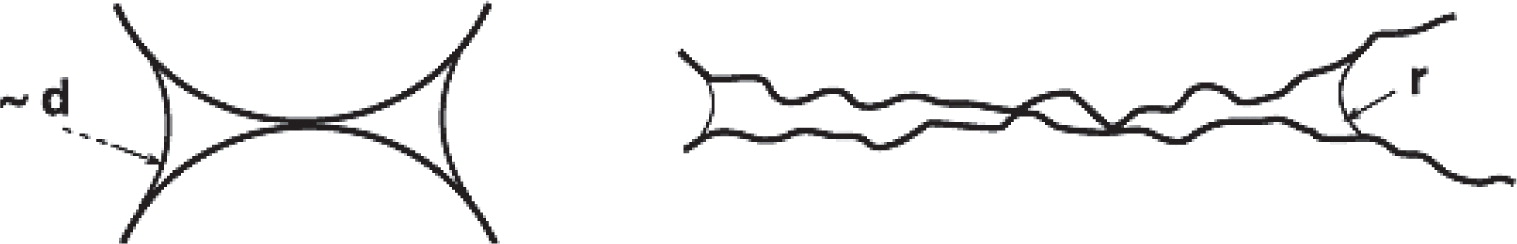
Liquid bridge of wetted spheres and (left) radius r of curvature of the meniscii for particle with some flatness (right).
For the smaller sizes of glass beads, the shear strength becomes lower than that extrapolated from the behaviour of (d−1). This is due to the fact that the ratio fc/ σI is bound to a value around 0.8 for the glass beads (Eq. 3). We then observe the transition between a capillary regime for large particles (larger than 100 μm) where the shear resistance decreases as the inverse of the particle size when increasing the size, and a consolidation regime for the small sizes (smaller than 100 μm) where the shear resistance cannot increase proportionally with the inverse of the particle size, but is limited by the consolidation.
In this small size regime, the Rumpf relation (Eq. 4) suggests that a formation of texture takes place and that the porosity and/or coordination number decreases when the particle size decreases. This observation is corroborated by the observation of the dynamic coefficient of friction (Fig. 5-right).
For glass beads at high particle sizes, the difference in behaviour for the funicular and dry states tends towards zero, which is expected if the capillary interparticle forces become negligible compared to the particle weight, together with a similar texturation of the powder bed.
Wet case, calcites: For the wet calcites, in the range of sizes used (30 to 250 μm), the shear strength is quasi-constant (fc/σI ≈ 0.42 ± 0.2). In particular, we do not observe the regime at high particle size approaching the dry case, as for the glass beads. This difference of behaviour between the glass beads and the calcites is interpreted as follows: the tensional or shear resistance is scaled by fcapillary/d2, where the capillary force scales like the product of the Laplace pressure multiplied by the area of the meniscii. For wetted particles, the area of the meniscii scales like d2 and therefore we have:
| (7) |
This size independency is also observed in dynamic conditions for the corresponding μD in dry and funicular conditions (Fig. 5-right). In particular, there is no convergence of the wet dynamic coefficient of friction towards the dry one when the particle size is increased, indicating that the capillary forces remain greater than the weight of the particles for all the sizes of calcites used.
Conclusion on the particle size effect in quasi-static experiments: The use of a shear cell allowed us to measure quantitatively the Flow Function of spherical and non-spherical particles in dry and wet conditions. From the results obtained, we extracted different shear resistance mechanisms. When the particles are dry, the shear resistance is induced by van der Waals’ interparticle forces (Eq. 4), which leads to a shear resistance inversely proportional to the mean size of the particles. This shear resistance remains weak enough to remain below the saturation due to consolidation, and we observe only this van der Waals-dominated regime for all the range of particle sizes for both calcites and glass beads.
When they are wetted by 10 to 60% v/v by water, the shear resistance is induced by the capillary forces, which are of higher magnitude than the van der Waals’ forces. Depending on the morphology of the particles, this capillary force is given by Eqs. (5) or (6), leading to a shear resistance inversely proportional to the mean particle size for the glass beads and a constant shear resistance for the non-spherical calcites. This capillary regime may be dominated by a consolidation regime where the shear resistance is limited by the consolidation (Eq. 3).
These quantitative measurements allow us to discriminate between different regimes of shear resistance. We shall now investigate whether these different regimes can be qualitatively observed in a planetary mixer, for which neither the surface of the sheared area nor the stresses acting upon it can be obtained, and only the torque on the impeller is measurable.
In order to compare the quasi-static shear experiments with the shear-mixing experiments, we recorded the current intensity required to mix at constant velocity in dry and funicular conditions obtained by reading the actual current intensity minus the current intensity when the bowl is empty. The rotational velocity of the impeller was also recorded in order to check that it remained constant and thus provided a proportionality between this current intensity and the torque on the impeller or the power consumed. For these experiments, the mass was adjusted to obtain the same bulk volume in the mixer (leading to Mglass = 1830 ± 30 g and Mcalcite = 1650 ± 150 g). We should then expect that the surface sheared remained approximately the same for all the experiments. Fig. 7 reports the ratio Im = I/M obtained for the calcites and glass beads.

Left: specific intensity at dry or funicular state versus the inverse of the mean diameter. Right: scaled specific intensity at funicular state (Eq. 6) versus the inverse of the one-point Flow Function. Squares: calcites, circles: glass beads.
This mixing intensity was expected to be proportional to a mean force acting on the bowl, which may be heuristically written as:
| (8) |
| (9) |
| (10) |
| (11) |
We observe in this figure that the calcites present a weak variation in both coordinates: in quasi-static and dynamic experiments, the mechanical resistance is mainly constant. The data points representing the calcite collapse, along with those obtained for the glass beads. For the glass beads, the variations for both coordinates are in correct linear correlation. These correlations remain qualitative and although it would be of interest to add more experimental data for different materials and equipments, they nevertheless give some credence to the assertion that the shear resistance in the mixer at funicular state may be described by the quasi-static resistance of a powder consolidated and submitted to its own weight.
The correlations indicate that the variation of the shear resistance with the mean size of the particles is similar in both quasi-static shear cell and mixer for dry and funicular conditions as directly observed in Fig. 8, where the results of Fig. 7 are plotted versus d−1 for direct comparison with Fig. 5-left (two upper curves).

Results of Fig. 7-right versus the inverse of the mean diameter. Squares: calcites, circles: glass beads.
Finally, for the glass beads of 100 μm mean diameter, we checked that the viscous forces remain negligible in the mixer under the operating conditions or the rotational velocity used. To do this we performed a series of experiments with water-glycerol mixtures of different viscosities. The results obtained are displayed in Fig. 9, which shows the intensity versus the viscosity, both scaled with the values obtained for pure water. It is particularly noticeable that the experiments with water are on a plateau: I does not depend on the viscosity, indicating that the viscous forces are negligible compared to friction and capillary forces in our experiments with water.
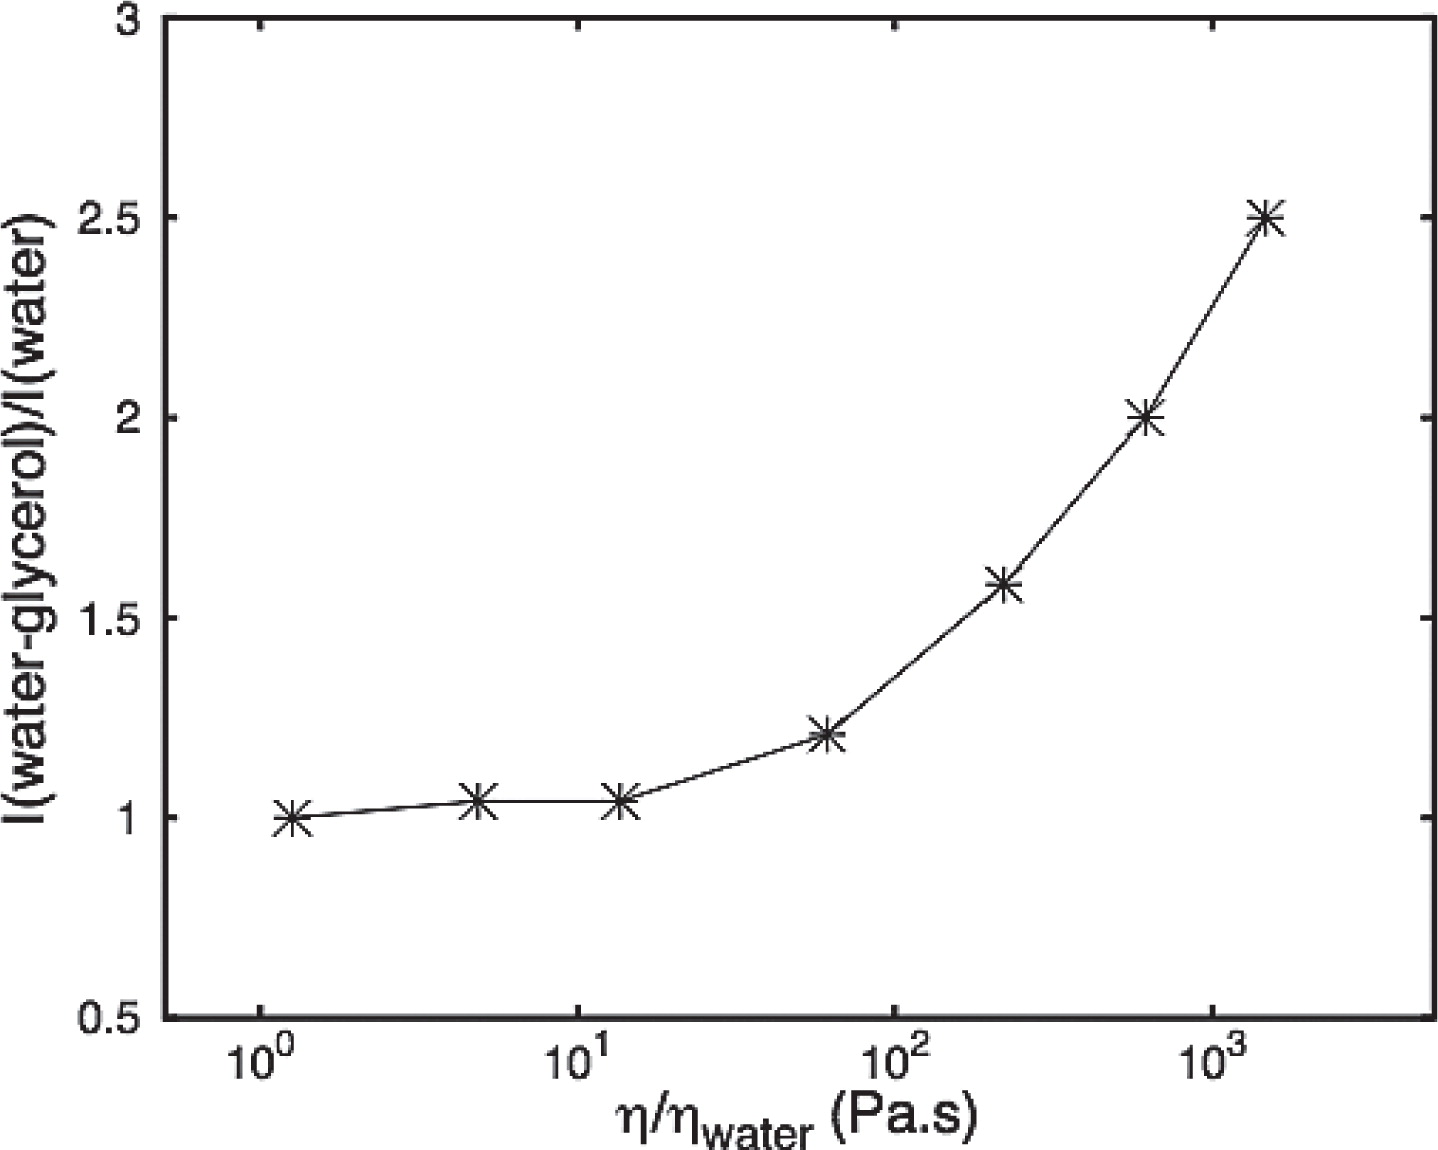
Intensity consumption at funicular state for water-glycerol, scaled by the intensity using water, versus the corresponding scaled viscosity for 100 μm glass beads.
A quasi-static system was used to obtain the cohesion (due to capillary or van der Waals’ forces) and frictional forces acting in sheared granular media. They present a rich phenomenology, depending on the dominant forces in action and on the texturation taken by the paste.
This quasi-static behaviour is shown to explain qualitatively the behaviour of the same granular media sheared in a planetary mixer at the funicular state. The agreement between the two types of experiments suggests that the consolidation process in the bowl mixer is identical for all the samples explored and close to a consolidation due to the weight of the particles themselves.
This correlation between quasi-static experiments and planetary mixer experiments indicates that the strengthening of the granular material is similar in the funicular state in both cases. The shear resistance regimes investigated quantitatively in the quasi-static shear cell (van der Waals, capillary particle morphology and texturation regimes) all apply.
It is a pleasure to thank M. Martin and P.-H. Jézéquel from Société Lafarge for their support and contribution to this research field, and the referee for the remarks that led to improvements in the article.
| A | Hamaker constant | |
| C | Compacity (%) | |
| c | Cohesion (Pa) | |
| d=dv50 | Mean particle diameter (μm)=dp | |
| fC | Unconfined yield stress (Pa), (another common designation is σC) | |
| fcapillary | Capillary force | |
| fvdW | van der Waals force | |
| h | Interdistance between solid particles | |
| iv50 | Mean volume roundness index (−), sphericity index | |
| I | Intensity (A) | |
| Im | Specific intensity (A/Kg), = I/MS | |
| k | Coordination number | |
| ms | Solid mass (g) | |
| Ms | Solid mass (kg) | |
| r | Radius of curvature of meniscii. | |
| S | Mean sheared surface | |
| T | Tensional resistance of a cohesive granular materials | |
| t | Time (s) | |
| (σI/fc) | One-point Flow Function (−) | |
| VP | Porous volume (cm3) | |
| Vs | Volume of dry solid (cm3) | |
| VL | Volume of liquid (cm3) | |
| VR | Ratio of liquid volume by solid volume (−) | |
| VT | Total volume (cm3) = (VP + VS) | |
| Greek symbols | ||
|---|---|---|
| ε | Interparticulate porosity of dry granular medium | |
| γ=γL | Liquid surface tension (mN.m−1) | |
| θ | Liquid-solid contact angle (°), by capillary rise experiments | |
| ρS | Solid true density (g.cm−3) | |
| ρ | Solid bulk density (g.cm−3) | |
| ω | Angular shear velocity (rad.s−1) | |
| σ | Normal stress (Pa) | |
| σC | Consolidation normal stress (Pa) | |
| τS | Yield shear stress (Pa) | |
| τD | Steady-state shear stress (Pa) | |
| τC | Consolidation shear stress (Pa) | |
| μD | Dynamic friction coefficient (−) | |
| σI | Major principal stress (Pa), | |
| ηwater | Water viscosity (Pa.s) | |
| ηW–G | Water-glycerol viscosity (Pa.s) | |
| β | Coefficient: geometrical proportionality constant (Eq. 9) | |
| λ | Coefficient of order unity (Eq. 9) | |
Driss Oulahna
;%0A%09%09%09newWindow.document.open();%0A%09%09%09newWindow.document.write('<img src=%22./Graphics/30_2013012_10.jpg%22>');%0A%09%09%09newWindow.document.close();%0A%09%09)
Driss Oulahna received his chemical engineering degree in 1988 and his PhD in chemical and process engineering in 1992 from École des Mines de Saint-Etienne, France. After a post-doctoral position, he joined the Process Engineering Laboratory of Rapsodee Center-CNRS 5302, École des Mines d’Albi (France) as assistant professor in 1996. His research is in the field of powder technology (agglomeration, granulation, compaction) and particle characterisation methods such as solids-liquids interactions and their role in chemical engineering processes.
Romain Collet
;%0A%09%09%09newWindow.document.open();%0A%09%09%09newWindow.document.write('<img src=%22./Graphics/30_2013012_11.jpg%22>');%0A%09%09%09newWindow.document.close();%0A%09%09)
Romain Collet obtained a master’s degree in “Applied physico-chemistry of Materials” in 2006 from Montpellier II university. After a PhD at École des Mines d’Albi where he studied “Criteria of blending wet granular mixtures”, he joined Parex-Group (R&D center, Saint Quentin Fallavier, France). He is currently an R&D engineer and works on the formulation of ready-to-use mortars for floors (tile adhesive, grout and floor covering).
Alain De Ryck
;%0A%09%09%09newWindow.document.open();%0A%09%09%09newWindow.document.write('<img src=%22./Graphics/30_2013012_12.jpg%22>');%0A%09%09%09newWindow.document.close();%0A%09%09)
Alain de Ryck is a graduate of the École polytechnique (1990), has a MSc in solid physics (Université Paris-Sud) and a PhD in physics (UPMC, Paris 1994). After a post-doctoral position in fluid mechanics at the Instituto Pluridisciplinar-Universidad Complutense, Madrid, he joined the Rapsodee Center-CNRS 5302, Ecole des Mines d’Albi in 1996. Professor and former director, he currently works on granular friction and flows of cohesive bulk materials, gas-solid interactions.