Abstract
This paper reviews scientific understandings relevant to the dry powder inhaler (DPI) development including turbulent airflow characteristics in the inhaler, microparticle entrainment and deaggregation within the airflow and device. Using standardized entrainment tubes (SETs) and powder aerosol deaggregation equation (PADE), the aerosol performance profile in a shear stress range defined by SETs can be predicted. However, such predictions are based on the hypothesis that the shear stresses characterized from SETs are readily translatable to those of the DPIs’. Two selected model DPIs (Rotahaler and Aerolizer) with either gelatin or HPMC capsules were used to evaluate the FPF at the DPI shear stresses. The performance result using DPIs was close to the predicted FPF using SETs and PADE method. The application of SETs and PADE method can be used for performance prediction of these DPIs.
1. Introduction
There have been significant advances in the development of dry powder inhaler (DPI) products since the first commercial DPI was launched in the late 1940s1). Innovations of both formulations and devices have been made to achieve increased delivery efficiency and reproducibility of therapeutic agents to the target sites. Nevertheless, DPIs are complex delivery systems and slight changes of factors associated with flow profile or formulation may have significant impact on the performance of DPIs. Conventional methods of DPI development are mainly based on trial and error. It is not easy to scientifically interpret the aerosolization process from a static metered powder, by means of aerodynamic interaction with inhaled air, to the respirable particle generation. This is due, at least in part, to the incomplete fundamental understandings of the turbulent fluid dynamics occurring in the DPI devices, the microparticle entrainment in turbulent air condition, and heterogeneous microparticle interactions as a result of fluid forces. Moreover, great differences in DPI devices, formulation designs, and metering mechanisms further contribute to the overall complexity. In sight of these complexities, a set of standardized entrainment tubes (SETs) were designed to cover a range of airflow parameters observed in selected passive DPIs2). SETs have been employed to evaluate a wide variety of formulations3–7). Nevertheless, a fundamental understanding of the airflow and microparticle behavior in the SETs is a prerequisite for performance prediction of DPIs. Establishing the nature of formulation discrimination by SETs with respect to DPIs also requires experimental comparison between SET and DPI.
The first aim of this paper was to briefly discuss current understandings of the fundamental aspects of airflow and microparticle behavior in SETs and DPIs. The paper starts with some basic fluid mechanics knowledge of turbulent pipe flow (Section 2); then it is followed by microparticle entrainment in these turbulent conditions (Section 3) and the interpretation of heterogeneous particle interaction using powder aerosol deaggregation equation (PADE, see Section 4). In addition, the necessity of using SETs was addressed (Section 5). The second aim of this paper was to experimentally compare the aerosol performance of SETs vs. DPIs using selected formulations (Section 6). It is proposed that using SETs as device independent screening tools, the aerosol performance of DPIs with defined airflow parameters can be predicted by interpolation from the PADE fitted regression curves.
2. Characteristic Turbulent Pipe Flow
Turbulent airstreams are generally recognized as the major source for particle deaggregation within typical DPI flow rate. However, the detailed nature of turbulent fluid flow and its interaction with the aerosolized particles are still not fully understood.
In typical turbulent flow, large-scale motions are strongly influenced by the boundary conditions, while the small-scale motion is determined by the rate of energy received from the large scales and the fluid viscosity. Eddies carry turbulent kinetic energy distributed over a broad range of scales. Turbulent airflow within a circular pipe consists of three regimes: an inviscid turbulent core, a viscous laminar sublayer, and a buffer layer where transition from turbulent to laminar flow occurs8). The velocity vector in turbulent flow varies, but with a mean velocity vector parallel to the wall. Although DPI devices have much more complex flow profiles than circular pipes, the nature of flow inside them can be characterized similarly by several closely related airflow parameters including Reynolds number (Re), shear stress (τs), pressure drop (ΔP), and power, which in turn, determine the dispersion efficiency of the aerosol formulation.
Among these parameters, Re of the device is the ratio of inertial forces to the viscous forces. It is often used for prediction of turbulence (e.g. Re>4000 for fully developed airflow in circular pipe). The value of Re to characterize a specific DPI device at defined airflow rate is dependent upon geometry, time scales and initial disturbances9). At high Re, the random motions of turbulent flow can be treated statistically for the characterization of the turbulent properties, and statistical fields (continuum fluid properties) vary smoothly in position and time.
Shear stress is caused by one sheet of fluid sliding over another. Apparently, it varies within the cross section of a pipe or DPI device and depends on the flow geometry and Re. The total shear stress in a pipe is the sum of the viscous stress and the Reynolds stress10). The viscous shear stress (τs, N/m2) dominates the wall, causing a velocity gradient. The characterization of turbulent τs may be expressed by the energy cascade and Kolmogorov theory. Briefly, the larger scales (eddies) transfer kinetic energy to successively smaller scales until reaching the smallest dissipative scale (Kolmogorov scale), and the energy is dissipated by viscous action into heat. The energy dissipation rate (ε, J/(kg·s) is determined by the transfer of energy from the largest eddies. Based on the conservation of energy, ε can be approximated by relating the root-mean square velocity fluctuation of the nozzle velocity <u> and the nozzle diameter D as11):
|
ε
≅
2
⟨
u
⟩
3
D
≈
2
(
0.2
u
)
3
D | (1) |
Relating Kolmogorov scales and dynamic viscosity at high
Re, the viscous shear stress (
τs) arising from the turbulent energy transfer can be obtained as
11):
where
μ and
ν are the dynamic and kinematic viscosity of the air (
μ = 2
× 10
−5 kg/(m·s) and
ν = 1.5
× 10
−5 m
2/s), respectively.
The kinetic energy dissipation can also cause ΔP in a pipe flow or DPI devices. The ΔP measured using manometer up- and downstream of a DPI device yields a combined value of both viscous and inviscid contribution12), but either contribution can also be measured separately13). A flow independent parameter, specific resistance (RD) of the DPI device can be obtained by relating ΔP measured and volumetric flow rate Q12). The RD is an intrinsic value that is dependent on the DPI internal geometry and dimension. DPI devices with higher RD will result in lower volumetric airflow rate due to the capability of patients’ maneuver. So optimum RD exists for the best performance of a specific DPI. The power is the rate of work done or inspiratory effort during inhalation, so its value is related to the patient condition and inhalation capability14).
The airflow parameters (Re, τs, ΔP, and power) mentioned above are positively correlated in general, and they have close relationship with particle detachment and dispersion. Using conventional or computational fluid dynamics (CFD) technique, the airflow profiles of some DPI devices or different kinds of pneumatic tubes were characterized and correlated with particle aerosolization performance previously2, 15–17).
3. Particle Entrainment
Principal forces leading to particle resuspension and entrainment are primarily believed to be turbulence, shear stress, collision, centrifugal, and relative motion9). Two theoretical models, force balance and energy accumulation were developed for particle re-suspension in turbulent flows18).
When the turbulent airflow entrains through a pipe or DPI device, it exerts aerodynamic forces or moments on the static dry powder to overcome the interparticulate or surface forces. Once fluid forces reach a critical value to balance adhesive forces, particle detachment occurs. For example, the critical diameter for the separation of two identical spheres can be estimated by equating the viscous shear force to the adhesive van der Waals force9). Somehow the aerodynamic lift forces could be smaller than adhesion forces by several orders of magnitude because of rolling and sliding19–21). Once resuspended, the particles move/rotate along the downstream airflow or collide with other particles or walls by momentum transfer. The mechanism of turbulent “burst” within the viscous sublayer has been used to explain particle detachment, but its contribution is controversial21, 22).
From another perspective, the flow transfers the turbulent energy into the powder bed. Particles can be resuspended when sufficient energy is accumulated to overcome the adhesion potential resulting in entrainment23). There are several advantages in using the energy accumulation model. It accounts for the resuspension below the critical flow velocity. It also takes into account of the time scale and explains the time dependence of particle resuspension that was observed experimentally. Furthermore, it implies that particle resuspension is analogous to the desorption process that occurs on a molecular level24).
4. Heterogeneous Microparticle Interactions
The aerosolization of a powder from DPI is a heterogeneous process with respect to both formulation and airflow condition.
Pharmaceutical powders are inherently heterogeneous, which can be classified in terms of geometric and energetic perspectives. The former includes particle size, size distribution, morphology, surface asperities, meso-/micropores, and particle deformation, and the latter, the energy density distribution caused by surface amorphous content, polymorphic state, and surface impurities5). The heterogeneity feature is also a characteristic of mutual interaction between particles rather than an independent particle.
Solid particles cannot follow fluid motion rigorously due to inertia. Non-spherical particles, surface roughness, particle size distribution, particle concentration are a few factors that could perturb the homogeneity of the turbulence field.
Particle motion associates with a turbulent flow field that has a statistical origin. The heterogeneity described in microparticle dispersion is analogous to that in surface adsorption, which averages local thermodynamic quantities and treats them statistically. In previous studies, standardized entrainment tubes (SETs) were used to comprehensively study the aerosolization performance of carrier-based formulations3, 4, 6). Based on the experiments and fundamental data interpretation, the forces acting at the particle interfaces appear to be analogous to those at the molecular level, and models of molecular surface occupancy, described by an adsorption expression, can be adapted to fit microparticle dissociation, from which a powder aerosol deaggregation equation (PADE) was developed5). Briefly, PADE is a method that directly correlates fine particle fraction (FPF) with τs using an algebraically equivalent expression to that of surface adsorption. FPF is the proportion with respect to the nominal dose (here is the total dose) in a size range considered sufficiently small to enter the lungs. Eqs. 3 and 4 are PADE Langmuir-type non-linear and linear regression equations, respectively5).
|
F
P
F
=
F
P
F
max
k
d
τ
s
1
+
k
d
τ
s | (3) |
|
τ
s
F
P
F
=
τ
s
F
P
F
max
+
1
k
d
(
F
P
F
max
) | (4) |
where
FPFmax is the characteristic
FPF at
τs approaching invariant region, and further increase of
FPF would require comminution of the drug or carrier particles,
kd is defined as the deaggregation constant. The advantages of PADE are that the effect of different formulation performance and the heterogeneity can be discussed in terms of theoretical or empirical surface adsorption models and measured experimentally to describe microparticle surface dissociation in a
τs range, and it is suitable for quick and accurate prediction of the dynamic deaggregation mechanisms for pharmaceutical aerosol formulations having surface energy heterogeneity and lateral interaction forces.
5. SETs vs. DPI Devices
The turbulent airflow profiles within the DPI devices may vary greatly because of short and tortuous internal channels in the device design. Complex designs including internal mesh or grid, compact sizes, formulation enclosure such as capsules, are aimed at enhancing dispersion efficiency and reproducibility, but may also produce complex flow fields. The presence of grid in DPI devices may cause increase or decrease in grid turbulence depending on a variety of factors such as the turbulent flow field, grid type and spacing25, 26). The compact sizes of DPI devices are often insufficient for turbulent flow to fully develop. The viscous effects of the airflow are not uniformly spread throughout due to insufficiently developed flow. The use of capsules may also influence the flow field and contribute to additional particle fluidization and deaggregation mechanisms9, 17). Consequently, the study of the turbulent flow field and the particle entrainment using DPI device directly is difficult. In addition, the particle entrainment and deaggregation in different DPI devices can vary greatly, due to the different device resistance and dispersion mechanisms. It was suggested that performance comparison between difference DPIs be carried out at a given pressure drop, instead of a fixed airflow rate27).
Historically, fully developed pipe flow, due to its geometric simplicity, has been extensively studied to increase the experimental and theoretical understanding of wall-bounded turbulence interactions. Likewise, a series of standardized entrainment tubes (SETs) was developed as a standardized method for the DPI formulation evaluation2, 5). These SETs have fully developed airflow profile. Their airflow parameters (Re, τs, ΔP, and power) encompass those of DPI devices2). This allows correlation between airflow parameters and formulation performance. Using SETs also eliminates the confounding factors caused by DPI devices and allows focus on formulation effect.
If microparticles are contained within the viscous sublayer of an SET or DPI device, they experience a mean shear flow that produces a combination of translational and rotational motions such as lifting, rolling and sliding contribute to initial particle detachment. Assuming the particle entrainment and deaggregation in an SET or DPI device are governed by these aerodynamic forces within the Kolmogorov scale of turbulence and, τs is expressed as Eqs. 1 and 2, the aerosolization performance of both SET and DPI device should be comparable.
6. Experimental
6.1. Material and methods
6.1.1 Formulations
Two micronized pulmonary drugs, disodium cromoglycate (DSCG, Sigma-Aldrich, Inc., St. Louis, MO) and albuterol sulfate (AS, Pfizer Global R&D, Kent, UK) were used. Two carriers, α-lactose monohydrate (Lac) (DMV Fonterra Excipients, Goch, Germany) and D-Mannitol (Mann) (Sigma-Aldrich, Inc., St. Louis, MO) were used. The preparation of carrier-based formulations with drug concentration at 2 %w/w was described previously3). They are interactive physical mixtures of DSCG–Lac and AS–Mann. The physico-chemical characterization including morphology (scanning electron microscopy), thermal properties (differential scanning calorimetry), crystallinity (X-ray powder diffraction), and particle size distribution (laser diffraction) of both formulations were reported previously3, 6).
6.1.2 Devices
A series of seven SETs with their airflow parameters encompassing commercial DPIs were applied. Two commercial DPI devices, Rotahaler® (Glaxo Smith Kline, RTP, NC) and Aerolizer® (Novartis, NJ) were compared with SETs. τs values within all the SETs and DPI devices were calculated by applying Kolmogorov turbulent theory (Eqs. 1 and 2) and reported previously2, 5). Two types of size 3 hard capsules: the gelatin (Capsugel®, Greenwood, SC) and HPMC capsules (Vcaps® Plus, Greenwood, SC) were used in the DPI devices.
6.1.3 In vitro aerosol performance characterization
The aerosolization performance efficiency represented by FPF and emitted dose (ED) was generated using a twin-stage liquid impinger (TSLI) at fixed airflow rate of 60 L/min. The TSLI setup has an aerodynamic cutoff diameter of 6.4 μm. In vitro aerosolization was performed in triplicate under ambient conditions. Prior to aerosolization, 25 mg of formulation was transferred onto the SET loading area located at the proximal end of the inlet section A solenoid switch was placed between the TSLI and the aspirator to achieve instant actuation for SET experiment. Each actuation was lasted for 10 sec. FPF values were correlated with τs values using PADE non-linear and linear regression models described in Eqs. 3 and 4. The PADE parameters (FPFmax and kd) and regression statistics were analyzed using Sigma-Plot software. (SigmaPlot 2004 Ver 9.01 for Windows, Systat Software, Inc., CA).
Two single dose DPIs (Rotahaler® and Aerolizer®) with either gelatin or HPMC capsules containing 25 mg of formulations were used. The actuation using DPI devices was achieved by twisting (Rotahaler®) or piercing (Aerolizer®) of the individual capsule at steady airflow rate of 60 L/min. The predicted FPF values (FPFpred) by interpolation from PADE regression curves were then compared with the FPF values obtained experimentally using DPIs. (Paired t-test, InStat Ver 3.05 for Windows NT, GraphPad Software, Inc., CA) The ED values generated from SETs were compared with those of DPIs.
6.2. Results and discussion
6.2.1 Formulation characterization
Pulmonary drugs (DSCG, AS), carriers (ML, Mann), and dry powder formulations (DSCG-Lac, AS-Mann) were prepared and characterized previously3,6). Different drugs and carriers were chosen to represent diversity of the formulation components. Briefly, both DSCG and AS were jet-milled and their particle volume size distribution by laser diffraction was: DSCG (D50 = 3.68 μm, span = 0.32) and AS (D50 = 3.59 μm, span = 0.26), respectively. The particle volume size distribution of carriers was: ML (D50 = 52.0 μm, span ∼ 3.10) and Mann (D50 = 52.9 μm, span = 1.19), respectively. Other physico-chemical characterizations including morphology, thermal properties, and crystallinity were reported previously and will not reiterate3, 6).
6.2.2 Device characterization
Seven SETs were selected and their τs values at airflow rate of 60 L/min were 13.143, 8.742, 4.342, 2.775, 2.199, 1.412, and 0.624 N/m2, respectively5).
Rotahaler® and Aerolizer® were chosen because they both are passive DPI devices with relatively simple internal geometry. The airflow conditions and the powder aerosolization within both devices have been well-explored experimentally and theoretically2, 26, 28–30). Both Rotahaler® and Aerolizer® products are metered by unit-dose capsule that contains carrier-based formulation. They both have a grid structure perpendicular to the flow vector. Rotahaler® has low specific resistance, RD = 0.036 cm H2O0.5/(L/min)2, 12). Aerolizer has relatively higher specific resistance, RD = 0.072 cm H2O0.5/(L/min)31). The τs value of Rotahaler® was measured previously, τs = 2.026 N/m2 2). The turbulent energy dissipation rate of Aerolizer® was calculated based on the integral scale strain rate and the rate of turbulence kinetic energy in a computation fluid dynamic study elsewhere29). The τs value of Aerolizer® was then calculated to be, τs = 2.588 N/m2. (Eq. 2).
6.2.3 Aerosol performance characterization
Using seven SETs, the correlation of FPF with SET τs by PADE nonlinear (Eq. 3) and linear regression (Eq. 4) analyses are shown in Fig. 1A–D, respectively. PADE nonlinear regression statistics of DSCG-Lac yielded FPFmax = 46.51%, kd = 1.19 m2/N, R2 = 0.9651, adj R2 = 0.9593; AS-Mann yielded FPFmax = 10.95%, kd = 0.90 m2/N, R2 = 0.9197, adj R2 = 0.9064 5). The PADE linear regression of DSCG-Lac and AS-Mann resulted in R2 = 0.9909 and 0.9808, respectively. Excellent goodness of fit was observed for both formulation performance evaluations. In previous papers, we stated that FPFmax should be an important parameter for evaluating the aerosol formulation3). The interpreted data from the slope of linear regression showed the rank order of the formulation performance efficency3).
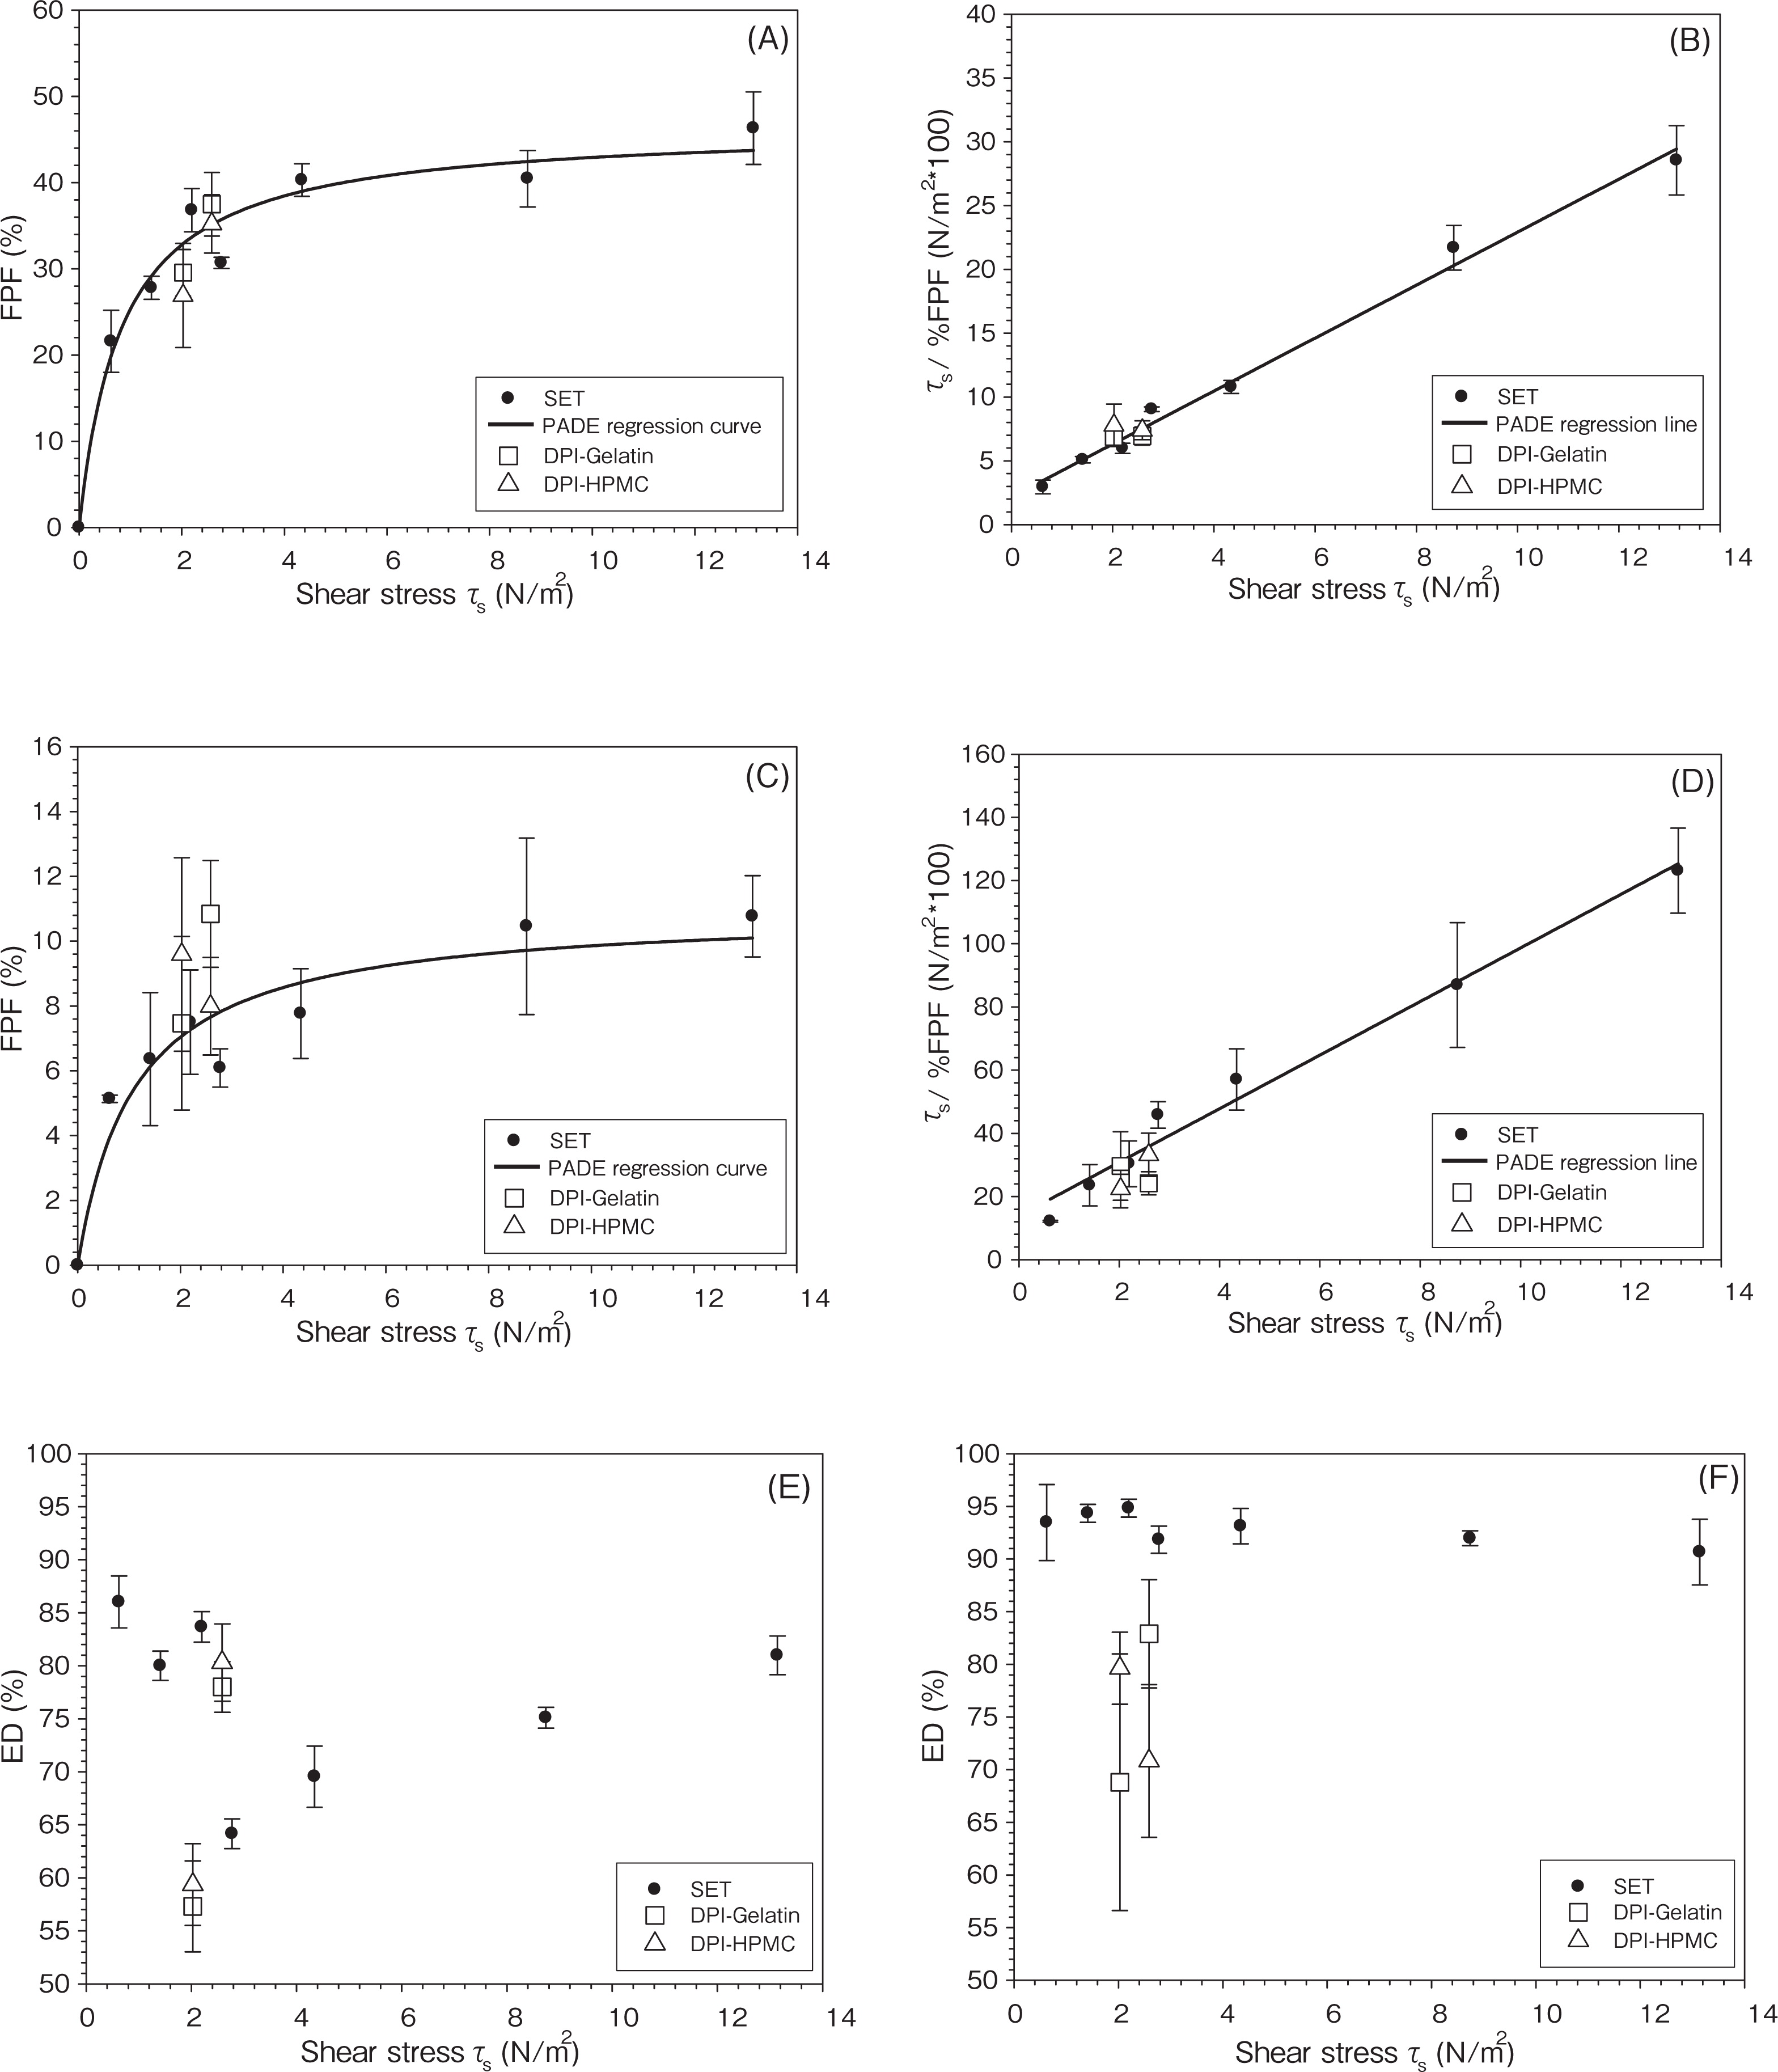
From another perspective, the PADE analyses led to the performance evaluation and prediction across the entire τs range. The optimum τs required for efficient and reproducible aerosolization is close to FPFmax. This sets an appropriate criterion for the construction or selection of proper DPI devices for a particular formulation. Assuming FPF values reach a plateau when they are equal or greater than 85% of the values of FPFmax, the critical τs values of DPI devices can be interpolated from the fitted regression curve: τs = 4.70 N/m2 (for DSCG-Lac) and τs = 6.37 N/m2 (for AS-Mann), respectively. At airflow rate 60 L/min, Aerolizer® and Rotahaler® have τs = 2.588 and 2.026 N/m2, respectively. According to the PADE analyses, both devices failed to reach critical τs for efficient and reproducible aerosolization of the selected formulations. The FPFpred obtained by interpolation of PADE non-linear curve fitting are shown in Table 1. For DSCG-Lac formulation, the FPFpred values were 32.9% (Rotahaler®) and 35.2% (Aerolizer®), respectively. For AS-Mann formulation, the FPFpred values were 7.1% (Rotahaler®) and 7.6% (Aerolizer®), respectively.
Table 1
Predictive Evaluation of Aerosolization Efficiency of DSCG-Lac and AS-Mann Formulations
| Formulation |
DPI-Capsule |
τs (N/m2) |
FPFpred(%)* |
FPFexp(%)** |
| DSCG-Lac |
Rotahaler®−Gelatin |
2.026 |
32.9 |
29.6 ± 2.7 |
| Rotahaler®-HPMC |
26.9 ± 6.0 |
| Aerolizer®-Gelatin |
2.588 |
35.2 |
37.5 ± 3.7 |
| Aerolizer®-HPMC |
35.2 ± 3.4 |
| AS-Mann |
Rotahaler®-Gelatin |
2.026 |
7.1 |
7.5 ± 2.7 |
| Rotahaler®-HPMC |
9.6 ± 3.0 |
| Aerolizer®-Gelatin |
2.588 |
7.6 |
10.8 ± 1.6 |
| Aerolizer®-HPMC |
8.0 ± 1.5 |
*
FPFpred: predicted
FPF values, obtained by interpolation of PADE non-linear curve fitting.
**
FPFexp: FPF obtained experimentally. Mean ± SD,
n = 3.
The experimental results of DPI aerosolization performance are show in Table 1. When the Aerolizer® was used, DSCG-Lac formulation gave mean FPF values of 37.5% (Gelatin) and 35.2% (HPMC), and AS-Mann formulation gave mean FPF values of 10.8% (Gelatin) and 8.0% (HPMC), respectively. When Rotahaler® was used, DSCG-Lac formulation gave mean FPF values of 29.6% (Gelatin) and 26.9% (HPMC), and AS-Mann formulation gave mean FPF values of 7.5% (Gelatin) and 9.6% (HPMC), respectively. FPF values generated by Aerolizer® were superior to those by Rotahaler® indicating superior dispersion efficiency of the former. Overall, the results obtained experimentally using DPI devices were very close to the interpolated FPF obtained from PADE non-linear fitted curve shown above. The FPFpred values were then compared with mean FPF values obtained experimentally using paired t-test. The result showed the difference were insignificant (p > 0.1) This indicated that using the SETs for aerosol performance studies, the PADE method provided a robust method for the evaluation of aerosol performance of commercial DPI devices, in spite of the differences between SETs and DPI devices mentioned above. No significant difference of FPF values was observed when either gelatin or HPMC capsules was used.
It is interesting to observe that FPF values generated from DPI devices experimentally can be predicted from the SET data, considering the vast differences in geometry, dimension, grid, capsule, and the corresponding turbulent airflow field and dispersion mechanisms between them. Similar comparable result was demonstrated earlier using Ventolin® formulation and different commercial DPIs2). Particle entrainment and deaggregation mechanisms in SETs are mainly shear force, other mechanisms of dispersion such as collision and momentum transfer may contribute greatly using DPI devices. However, it is reasonable to suggest that particles which can be removed by shear forces may more readily be removed under the influence of collision and momentum transfer, from which it can be inferred that the FPF interpolated from the SET data can be used for the performance evaluation of DPI products.
The FPF represents the degree of particle deaggregation, whereas the ED represents the degree of particle entrainment. The values of ED were influenced by both formulation and device. (Fig. 1 E–1F) For DSCG-Lac formulation, ED values using SETs ranged from 64.2% (at τs = 2.775 N/m2, SET-B1) to 86.0% (at τs = 0.624 N/m2, SET-D). This could be explained by the design of expansion region in SETs. The lower shear SET-C, C1 and D had gradual enlargement to facilitate gradual energy loss and central loading platform to maximize airflow velocity, whereas higher shear SET-A, A1, B, B1 did not include such a diffuser for energy recovery. This resulted in relatively higher ED in lower shear SETs and lower ED in higher shear. For SETs with sudden enlargement, the lower airflow velocity corresponded to the lower ED values, indicating that the fluid force could not sustain particle fluidization due to energy loss. For AS-Mann formulation, ED values using SETs were similar and ranged from 90.7% (at τs = 13.143 N/m2, SET-A) to 94.8% (at τs = 2.199 N/m2, SET-C). This is likely because of the formulation effect. Carrier ML was milled lactose monohydrate particles with much larger span than that of Mann, which indicated that AS-Mann was much easier to fluidize than DSCG-Lac.
In general, smaller ED values were observed using DPI devices than SETs at similar τs. Aerolizer® gave higher ED values than Rotahaler® for DSCG-Lac formulation. No significant difference of ED values was observed when either type of capsules was used.
The differences of dispersion (FPF, ED values) between SETs and DPIs may be explained from several perspectives including the presence of grid in DPI devices, the compact sizes and complex geometry of DPI devices, and the use of capsule.
The grid may cause increase or decrease in grid turbulence depending on a variety of factors such as the turbulent flow field, grid type and spacing25, 26). Grid may also enhance impaction and effects of viscosity in turbulent flow25). These are the features for the particle deaggregation not presented in SETs. The effect of grid on particle dispersion is sometimes controversial. In one study, FPF values generated from performance with grid were similar to those without; indicating mechanical impaction had little effect on particle deaggregation32). While in another study using Aerolizer®, the structure of grid was found to play a vital role in converting high-velocity tangential flow into low-velocity axial flow, thus increasing FPF26).
The turbulent airflow was unlikely to fully develop because of the compact sizes of DPI devices, so the viscous effects of the airflow were not uniformly spread throughout. This led to the fluctuation and higher standard deviation of the FPF and ED values obtained than typical dispersion data obtained using SETs.
The use of capsules in the DPI devices offered another reason for the difference in ED values. The ED values obtained using SETs were generally higher than those obtained using DPI devices. The enclosure of powder formulations in the capsules may hinder the powder entrainment and lead to lower ED. The mechanisms of entrainment and deaggregation in the Rotahaler® are different from those in the Aerolizer®. The former requires mechanical break of capsules and expose the powder for dispersion, whereas the latter requires capillary fluidization and shear force for powder dispersion9, 29). The capillary fluidization may offer additional capsule dispersion, which may result in higher ED and FPF using Aerolizer®. The use of gelatin or HPMC capsules did not lead to significant difference in ED and FPF. (p > 0.1)
7. Conclusion
This paper describes the important aspects including turbulent airflow and microparticle interactions that are relevant to the DPI performance. A unique PADE method that allows aerosol performance prediction over defined τs range was reviewed and utilized in the experimental study.
The aerosol performance study tested the hypothesis that using SETs as device independent screening tools, the aerosol performance of DPIs with defined airflow parameters can be predicted by interpolation from the PADE fitted curves. In addition, the PADE method suggests the critical τs required for efficient and reproducible aerosol performance of a formulation. This could be very helpful in the selection of the correct DPI device for the specific formulation to achieve optimum aerosolization.
Undoubtedly, in the final product, different mechanisms of DPI particle separation would be employed. Impaction and momentum transfer mechanisms, for which many devices were designed, have been the focus of considerable research. Nevertheless, it is reasonable to suggest that particles which can be stripped by shear force may more readily be removed under the influence of volume or mass related contributions such as particle-particle and particle-wall collision. The SETs and the PADE method are excellent tools for the formulation optimization in the early stage of DPI development, and the selection of proper DPI device and formulation combination for the whole DPI product development.
A method developed to compare performance of formulations in a manner generally relevant to passive dry powder inhalers should conform to the follow postulates. The method should: 1) Cover the range of airflow performance characteristics for known inhalers (of clinical significance); 2) Discriminate performance differences between a wide range of formulations and; 3) Demonstrate with known formulations adequate prediction of their performance in DPIs.
It should be noted, however, current study covered only a narrow range of τs by two DPI devices, further evaluation of DPI devices at different τs and the DPIs with principal dispersion mechanisms other than shear flow are necessary to strengthen the hypothesis.
Author’s short biography
Zhen Xu

Dr. Zhen Xu obtained his Ph.D. in 2010 in the Eshelman School of Pharmacy, University of North Carolina. His Ph.D. research in Dr. Anthony Hickey’s lab focused on dry powder aerosol formulations for the treatment of asthma, with an effort on elucidating the heterogeneous microparticle interactions in the solid-state, and achieving cost-effective formulation screening/prediction. He is currently a post-doctoral fellow in the School of Pharmacy, University of Maryland. His current research focuses on the aerosol device technologies, using valved holding chamber and facemask systems for pediatric pulmonary delivery. He previously received his M.S. degree in Chemistry at Michigan State University.
Anthony J. Hickey

Dr. Hickey is Distinguished RTI Fellow and Program Leader in Inhaled Therapeutics in the Center for Aerosol and Nanomaterials Engineering at the RTI International, Emeritus Professor of Molecular Pharmaceutics of the Eshelman School of Pharmacy, and Adjunct Professor Biomedical Engineering of the School of Medicine, at the University of North Carolina at Chapel Hill. He is a Fellow of the UK Society of Biology, the American Association of Pharmaceutical Scientists, and the American Association for the Advancement of Science. He has edited texts on pharmaceutical inhalation aerosols and co-authored others on Pharmaceutical Process Engineering, Particulate Science and Pharmaco-complexity.
References
- 1) Clark, A. R. (1995): Medical aerosol inhalers: past, present, and future, Aerosol Sci. Technol., Vol.22, pp.374–391.
- 2) Louey, M. D., VanOort, M., and Hickey, A. J. (2006): Standardized entrainment tubes for the evaluation of pharmaceutical dry powder dispersion, J. Aerosol Sci., Vol.37, pp.1520–1533.
- 3) Xu, Z., Mansour, H. M., Mulder, T., McLean, R., Langridge, J., and Hickey, A. J. (2010): Dry powder aerosols generated by standardized entrainment tubes from drug blends with lactose monohydrate: 1. Albuterol sulfate and disodium cromoglycate, J. Pharm. Sci., Vol.99, pp.3398–3414.
- 4) Xu, Z., Mansour, H. M., Mulder, T., McLean, R., Langridge, J., and Hickey, A. J. (2010): Dry powder aerosols generated by standardized entrainment tubes from drug blends with lactose monohydrate: 2. Ipratropium bromide monohydrate and fluticasone propionate, J. Pharm. Sci., Vol.99, pp.3415–3429.
- 5) Xu, Z., Mansour, H. M., Mulder, T., McLean, R., Langridge, J., and Hickey, A. J. (2010): Heterogeneous particle deaggregation and its implication for therapeutic aerosol performance, J. Pharm. Sci., Vol.99, pp.3442–3461.
- 6) Mansour, H. M., Xu, Z., and Hickey, A. J. (2010): Dry powder aerosols generated by standardized entrainment tubes from alternative sugar blends: 3. Trehalose dihydrate and D-mannitol carriers, J. Pharm. Sci., Vol.99, pp.3430–3441.
- 7) Xu, Z., Mansour, H. M., and Hickey, A. J. (2011): Particle interactions in dry powder inhaler unit processes: a review, J. Adhesion Sci. Technol., Vol.25, pp.451–482.
- 8) Hickey, A. J. and Ganderton, D. (2010): “Fluid flow”, Pharmaceutical Process Engineering, 2nd edition, Informa Healthcare USA, pp.4–30.
- 9) Dunbar, C. A., Hickey, A. J., and Holzner, P. (1998): Dispersion and characterization of pharmaceutical dry powder aerosols, KONA Powder and Particle Journal, No.16, pp.7–45.
- 10) Pope, S. B. (2000): “Wall flows”, Turbulent Flows, Cambridge University Press, Cambridge, UK, p.264–332.
- 11) Shekunov, B. Y., Feeley, J. C., Chow, A. H., Tong, H. H., and York, P. (2003): Aerosolization behavior of micronized and supercritically-processed powders, J. Aerosol Sci., Vol.34, pp.553–568.
- 12) Clark, A. R. and Hollingsworth, A. M. (1993): The relationship between powder inhaler resistance and peak inspiratory conditions in healthy volunteers - implications for in vitro testing, J Aerosol Med., Vol.6, pp.99–110.
- 13) Mendes, P. J., Pinto, J. F., and Sousa, J. M. M. (2007): A non-dimensional functional relationship for the fine particle fraction produced by dry powder inhales, J. Aerosol Sci., Vol.38, pp.612–624.
- 14) de Boer, A. H., Winter, H. M. I., and Lerk, C. F. (1996): Inhalation characteristics and their effects on in vitro drug delivery from dry powder inhalers part 1. inhalation characteristics, work of breathing and volunteers’ preference in dependence of the inhaler resistance, Int. J. Pharm., Vol.130, pp.231–244.
- 15) Wong, W., Fletcher, D. F., Traini, D., Chan, H. K., Crapper, J., and Young, P. M. (2010): Particle aerosolisation and break-up in dry powder inhalers 1: evaluation and modelling of venturi effects for agglomerated systems, Pharm. Res., Vol.27, pp.1367–1376.
- 16) Calvert, G., Ghadiri, M. and Tweedie, R. (2009): Aerodynamic dispersion of cohesive powders: a review of understanding and technology, Adv. Powder Tech., Vol.20, pp.4–16.
- 17) Coates, M. S., Tang, P., Chan, H. K., Fletcher, D. F., and Raper, J. A. (2009): “Characterization of pharmaceutical aerosols and dry powder inhalers for pulmonary drug delivery”, Particulate Systems in Nano- and Biotechnologies”, eds: Sigmund, W., El-Shall, H., Shah, D. O., Moudgil, B. M., CRC Press Taylor & Francis Group, p.193–222.
- 18) Ziskind, G., Fichman, M., and Gutfinger, C. (1995): Resuspension of particulates from surfaces to turbulent flows - review and analyss, J. Aerosol Sci., Vol.26, pp.613–644.
- 19) Ziskind, G., Fichman, M., and Gutfinger, C. (1997): Adhesion moment model for estimating particle detachment from a surface, J. Aerosol Sci., Vol.28, pp.623–634.
- 20) Wang, H. C. (1990): Effects of inception motion on particle detachment from surfaces, Aerosol Sci. Tech., Vol.13, pp.386–393.
- 21) Ibrahim, A. H., Dunn, P. F., and Brach, R. M. (2003): Microparticle detachment from surfaces exposed to turbulent air flow: controlled experiments and modeling, J. Aerosol Sci., Vol.34, pp.765–782.
- 22) Gradon, L. (2009): Resuspension of particles from surfaces: technological, environmental and pharmaceutical aspects, Adv. Powder Tech., Vol.20, pp.17–28.
- 23) Reeks, M. W., Reed, J., and Hall, D. (1998): On the resuspension of gas-borne particles in recirculating turbulent flow, J. Phys. D: Appl. Phys., Vol.21, pp.574–589.
- 24) Wen, H. Y. and Kasper, G. (1989): On the kinetics of particle reentrainment from surfaces, J. Aerosol Sci., Vol.20, pp.483–498.
- 25) Pope, S. B. (2000): “Free shear flows”, Turbulent Flows, Cambridge University Press, Cambridge, UK, p.158–161.
- 26) Coates, M. S., Fletcher, D. F., Chan, H. K., and Raper, J. A. (2004): Effect of design on the performance of a dry powder inhaler using computational fluid dynamics. Part 1: Grid structure and mouthpiece length, J. Pharm. Sci., Vol.93, pp.2863–2876.
- 27) Richards, R. and Saunders, M. (1993): Need for a comparative performance standard for dry powder inhalers, Thorax., Vol.48, pp.1186–1187.
- 28) Chew, N. Y., Bagster, D. F., and Chan, H. K. (2000): Effect of particle size, air flow and inhaler device on the aerosolisation of disodium cromoglycate powders, Int. J. Pharm., Vol.206, pp.75–83.
- 29) Coates, M. S., Fletcher, D. F., Chan, H. K., and Raper, J. A. (2005): The role of capsule on the performance of a dry powder inhaler using computational and experimental analyses, Pharm. Res., Vol.22, pp.923–932.
- 30) Coates, M. S., Chan, H. K., Fletcher, D. F., and Chiou, H. (2007): Influence of mouthpiece geometry on the aerosol delivery performance of a dry powder inhaler, Pharm. Res., Vol.24, pp.1450–1456.
- 31) Weuthen, T., Roeder, S., Brand, P., Mullinger, B., and Scheuch, G. (2002): In vitro testing of two formoterol dry powder inhalers at different flow rats, J. Aerosol Med., Vol.15, pp.297–303.
- 32) Voss, A., Finlay, W. H. (2002): Deagglomeration of dry powder pharmaceutical aerosols, Int. J. Pharm., Vol.248, pp.39–50.
;%0A%09%09%09newWindow.document.open();%0A%09%09%09newWindow.document.write('<img src=%22./Graphics/30_2013019_2.jpg%22>');%0A%09%09%09newWindow.document.close();%0A%09%09)
;%0A%09%09%09newWindow.document.open();%0A%09%09%09newWindow.document.write('<img src=%22./Graphics/30_2013019_3.jpg%22>');%0A%09%09%09newWindow.document.close();%0A%09%09)