Abstract
Compaction is a key unit operation in many particulate industries. Accordingly, this study addresses a research question of considerable importance concerning compact (or tablet) formation, i.e., the feasibility of using mechanical properties of powder formulations in low to medium pressure regime (<10 MPa) as predictors of tablet (i.e., compact) quality parameters. For the feasibility study, mechanical properties, i.e., elastic and elastoplastic, of dry powder formulations at three binder contents were determined using a flexible boundary cubical triaxial tester in low to medium pressure regime. For the same formulations, tablets formed at two pressing pressures (70 and 90 MPa) were tested for four physical quality parameters, i.e., diametral strength, axial penetration strength, indentation hardness, and friability. Some of the key findings were: bulk modulus increased with pressure and binder; shear modulus increased with confining pressure; tablet hardness increased with binder content upto a point and thereafter decreased or remained constant. All the powders' properties related with tablet qualities, i.e., had R2>0.80; i.e., demonstrating the feasibility of using powder properties as initial predictors of tablet quality for formulations tested. In particular, the spring-back index, compression index, and bulk modulus were found to be most correlated with tablets' diametral strength, axial penetration strength, indentation hardness, and friability. An elastic energy based hypothesis was proposed to provide a fundamental basis for mechanical properties of powder formulations vs. tablet quality relationships. The positive outcome of this feasibility study suggests that the approach could be used for other similar powder formulations.
1. Introduction
Compaction is an important unit operation in many particulate industries, such as, chemical, ceramics, pharmaceuticals, and powdered metal. Compacts or tablets are formed using powder ingredients such as filler, binder(s), lubricant(s), and disintegrant (if needed). These ingredients are blended in desired proportion and compacted. Herein we have used pharmaceutical powder formulations, which include also an active pharmaceutical ingredient (API). This study addresses a research question of considerable importance, i.e., the feasibility of using dry powder formulation properties in low to medium pressure regime (<10 MPa) as predictors of tablet quality parameters. Toward that end, fundamental mechanical properties of powder formulations were determined using a flexible membrane cubical triaxial tester (CTT). Some of these test results have been presented in Pandeya and Puri (2011) and comprehensive results are given in Pandeya (2009). In addition, quality parameters of the tablets formed from the same powder formulations were determined. Various studies have been performed on determining the quality parameters of tablets (Tabor, 2000; Tye et al., 2005; Wu et al., 2005). However, no study could be found that has related the dry powders’ fundamental mechanical properties to tablet quality. In accord with the research question, the objective of the study was to determine the feasibility of prediction of the tablet quality parameters based on the mechanical properties of the dry powder formulation at three binder contents in the low to medium pressure regime.
2. Material
The formulation used for the research was composed of Avicel (FMC Biopolymers, Philadelphia, PA), Methocel (Colorcon, PA), Magnesium stearate (Sigma Aldrich, St. Louis MO), Ac-Di-Sol (FMC Biopolymers, Philadelphia, PA), and Acetaminophen (Sigma Aldrich, St. Louis MO) as filler, binder, lubricant, disintegrant and active pharmaceutical ingredient, respectively. The properties of these ingredients are given in Table 1 Three different levels of methocel (binder): 0 (none), 5, and 10%, were used in powder formulation. The proportion of other four ingredients were maintained at the same level, i.e., Avicel: Acetaminophen: Ac-Di-Sol: Magnesium stearate :0.90:0.05:0.03:0.02 (Table 2). Detailed description of all the ingredients used and selection of binder levels are presented in Pandeya (2009) and Pandeya and Puri (2008 and 2011). The drug loading in pharmaceutical formulations varies over the entire spectrum of values (i.e., from 0.1% to 100%) depending upon the type of drug and its application. In our context, the objective was to determine the mechanical properties of a pharmaceutical formulation consisting of major ingredients that are commonly used such as MCC, Methocel, Acetaminophen, Ac-di-sol, and Magnesium stearate, i.e., the study was not targeted to develop an optimum formulation. The powder formulations’ mechanical properties where investigated as possible predictors of tablet physical quality metrics.
Table 1
Properties of formulation ingredients
|
Parameters |
| Ingredients |
Bulk density (g/cc) |
Particle density* (g/cc) |
Median (d50) particle size † (μm) |
| Avicel PH 102 |
0.41 |
1.61 |
78 |
| Methocel |
0.42 |
1.33 |
108 |
| Acetaminophen |
0.25 |
1.36 |
15 |
| Ac-Di-Sol |
0.46 |
1.66 |
60 |
| Magnesium stearate |
0.26 |
1.13 |
10 |
* Measured using Micromeretics Multivolume Helium Pycnometer 1305 (Boynton Beach, FL)
† Measured using the Malvern Instruments Mastersizer (Westborough, MA)
Table 2
Ingredients and their proportions used in pharmaceutical powder formulations
| A. Methocel (Binder) |
0% |
5% |
10% |
| B. Other ingredients |
100% |
95% |
90% |
| B1. Avicel PH 102 |
90% |
85.5% |
81% |
| B2. Acetaminophen |
5% |
4.75% |
4.5% |
| B3. Ac-Di-Sol |
3% |
2.85% |
2.7% |
| B4. Magnesium stearate |
2% |
1.9% |
1.8% |
3. Methodology
Hydrostatic triaxial compression (HTC) and conventional triaxial compression (CTC) tests were conducted using a CTT for formulations at different binder content. Tablets at binder contents of 5 and 10% and without binder (i.e., 0%) were formed at pressures of 70 and 90 MPa. Tablets’ physical quality parameters (discussed in the following sections) were determined at all three binder contents and both tabletting pressures. The ingredients were stored and tests were conducted in an environment controlled laboratory with temperature setting of 23°C ± 1° C and relative humidity setting 35% ± 5%. Three replications of each test were conducted (Kamath and Puri, 1997; Li and Puri, 1997; Mittal and Puri, 2005).
3.1 Cubical triaxial tester
A medium pressure cubical triaxial tester (Fig. 1) developed by Kamath and Puri (1997) and Li and Puri (1997) and modified by Mittal and Puri (2005) was used for the experiments. This CTT is capable of applying pressure on six sides of a cubical sample (powder). The pressure is applied through flexible rubber membranes by pressurized nitrogen gas. The powder sample is contained in a cube-shaped Sample Holding Membrane (SHM) (made out of silicone rubber), which has dimensions of 50.8×50.8×50.8 mm. The SHM is placed in the cubical cavity of the CTT and pressure is applied to the six surfaces of SHM via flexible rubber membranes. Due to the application of pressure, change in the dimensions of the powder sample takes place. The change in the dimensions was recorded using linear motion potentiometers that are in constant contact with pressure application membranes, i.e., all six faces.
3.2 Blending
The powders were blended using manual Mini-Inversina (Bioengineering AG, Switzerland) capable of providing 360° motion to the mixture. The mixing was performed at 80 RPM for 5 minutes with a batch size of 400 g. The batch size and mixing time were based on preliminary runs to assess the quality of powder mixture (Pandeya, 2009).
3.3 Hydrostatic triaxial compression (HTC) and conventional triaxial compression (CTC) Tests
In HTC tests, the powder mixture sample was subjected to isotropic loading and the stress state was the same in all three principal directions, i.e. equal pressure is applied on each of the six faces of the cubical sample. Parameters such as bulk modulus, compression index, and spring-back index were determined using the HTC test (Li and Puri, 1997; Mittal and Puri, 2005). All tests were conducted at pressures upto 10 MPa and loading rates of 10 and 20 MPa/min. Since this is the first known feasibility study of using the fundamental mechanical properties of powder formulation as predictors of the tablet quality, two different loading rates were used, i.e., is known that the powders’ mechanical behavior can be sensitive to the loading rate. In CTC tests, first the sample was confined by applying same pressure on each face of the cubical sample similar to HTC tests after that deviatoric stress was applied in the top-bottom direction (also the gravity direction). Shear modulus and failure stress were determined using the CTC tests (Li and Puri, 1997; Mittal and Puri, 2005). These tests were conducted at confining pressures of 1, 2, and 3 MPa. Three replications at 0, 5, and 10% binder content were performed at loading rates of 10 and 20 MPa/min. The tests were conducted to produce stress difference of 1 and 2 MPa, which ensured stresses below but in the vicinity of incipient failure of powder specimen. Rationale for selection of these values is discussed in detail (Pandeya, 2009; Pandeya and Puri, 2011).
3.4 Tablet formation
The tablets were formed using a die and punch assembly. A material testing system (MTS 810, Eden Prairie, MN) fitted with a load cell of 100 kN ± 0.1 kN and capable of applying load at varying speeds was used to apply the pressure on the powder through the punch. The tablets were formed at different binder contents of 0, 5, and 10% and compaction pressures of 70 and 90 MPa. Known weight of samples (300±1 mg) was transferred into the die and pressure was applied.
3.5 Determination of tablet quality parameters
Diametral strength, axial compressive strength, indentation hardness, and friability tests were conducted to evaluate the tablet properties. First three tests were conducted using universal testing machine (Instron 4444, Canton, OH); whereas, the fourth (friability) was determined using a friabilator. These are summarized in the following subsections.
Diametral Strength Test:
Diametral strength test, also known as tensile strength test, is a most commonly used test to assess the overall mechanical strength of the tablet. The force was applied diametrically at a cross head speed of 12.52 mm/min on the tablet and the crushing force (Fx) was measured. Slow test speed was used to minimize any time-dependent effects. The diametral strength, DS was calculated using the following equation (Tye et. al., 2005):
, where D and t are diameter and thickness respectively of the tablet.
Axial Penetration Strength:
Axial penetration strength was also conducted at a cross head speed of 12.52 mm/min. In the test, the tablet was compressed axially using a cylindrical probe of 3 mm diameter. The pressure at which the specimen failed was taken as penetration strength of the tablet in compression.
Indentation Hardness:
Hardness may be defined as the resistance of a material to local permanent deformation (Kuentz and Leuenberger, 2000). According to Leuenberger and Rohera (1986), hardness is related primarily to the plasticity of the tablet, which is usually measured by the indentation test. They divided the hardness testing technique into two groups: 1) hardness determination by static impression method; and 2) hardness determination by dynamic method. The first method i.e. hardness determination using static methods being the most widely used, was adopted in this feasibility study. The Brinell hardness number (BHN) is expressed as the ratio of the load to the diameter of the indentation and can be calculated by the following equation:
|
BHN
=
2
F
π
D
(
D
−
D
2
−
d
2
)
=
2
F
π
D
h |
where,
-
F = Indentation Force,
-
D = diameter of indenter,
-
d = diameter of indentation,
-
h = depth of indentation.
The indentation hardness was determined by penetration a stainless steel spherical probe upto 0.3 mm at a speed of 0.15 mm/min.
Friability:
It is a measure of the tablet’s resistance to subsequent process condition and transportation. Friability is measured using a friabilator designed and fabricated in Department’s Fabrications Facility (Pandeya, 2009). Riippi et al. (1998) performed the friability test on erythromycin acistrate tablets using a friabilator for 100 rotations. Ameye et al. (2002) performed the friability test on tablets formed using granulated powder formulation. They used Pharma Test-type friabilator at 25 rpm for 4 min (100 rotations). Dedusted tablets were reweighed and percentage loss in weight was measured as friability. Accordingly, for the present research, known weights of dedusted tablets were subjected to a free fall of 152.4 mm for 100 times in a rotating drum (friabilator) at a speed of 26 rpm.
4. Results
4.1 Fundamental mechanical properties of powder formulation
The bulk modulus, compression index, and spring-back index were determined using the HTC test at unloading pressures of 2.5, 5.0, and 10.0 MPa. The shear modulus was determined using the CTC tests at confining pressures of 1, 2, and 3 MPa. These parameters were determined at loading rates of 10 and 20 MPa/min at 0, 5, and 10% binder content. The detailed powder fundamental properties are given in Pandeya and Puri (2011). For completeness; herein, a summary of powder properties: Bulk modulus, Compression index, Spring-back index, and Shear modulus, is presented in the following paragraphs. Rationale for the trends of these properties and corresponding discussion are given in Pandeya and Puri (2011).
Bulk Modulus:
Bulk modulus is the measure of the resistance of the material to volumetric change. At 10 MPa/min loading rate, the bulk modulus increased with increase in the isotropic pressure and binder content in all cases. At 20 MPa/min the bulk modulus was maximum at 0% binder (i.e., no binder) followed by those at 10 and 5% binder content.
Compression Index:
The compression index, an elastoplastic property, is the measure of compressibility of the material. The compression index value increased with pressure.
Spring-back Index:
Spring-back index, an elastic property, is the measure of elastic recovery of the material after the applied pressure has been released. In all cases the spring-back index value increased with pressure. At 10 MPa/min loading rate, the spring-back value decreased with binder content. At 20 MPa/min the spring-back index value was lowest at 0% binder followed by 10 and 5% binder content.
Shear Modulus:
The shear modulus is the measure of resistance of the material to deformation in shear loading. The shear modulus increased with increase in the confining pressure in all cases.
4.2 Tablet quality
As mentioned in a preceding section, four physical quality parameters, i.e., diametral strength, axial penetration strength, indentation hardness, and friability were evaluated for the tablets formed at different pressure and binder content. The diameter of the tablets formed were 10 mm with flat surface having average thickness of 3.3 and 3.2 mm in case of 70 and 90 MPa pressure, respectively. These parameters are discussed in the following subsections.
Diametral Strength:
Generally, the average diametral strength values were higher for tablets formed at 90 MPa than at 70 MPa compression pressure for all binder contents (Fig. 2). The average diametral strength values at 70 MPa were 0.191, 0.345, and 0.330 MPa at 0, 5, and 10% binder, respectively (Table 3). These values at 90 MPa compression pressure were 0.323 (69%, percent increase in diametral strength from 70 MPa), 0.386 (12%), and 0.379 MPa (15%). With increase in compaction pressure the void ratio decreased and relative density increased, which resulted in an increase in strength. The diametral strength increased with binder content upto 5%; thereafter, it decreased or remained same when binder content increased from 5 to 10%. This shows that increase in binder after 5% did not affect the diametral strength. Binder addition improved the contact via the hypothesis of filling the void spaces, which resulted in increase in strength of the tablets. Beyond 5% binder level, the diametral strength decreased; albeit slightly (not significant, p >0.05). By definition, binder is a softer, high plasticity material compared with the other ingredients. Therefore, beyond a certain level of binder content, the tablet’s diametral strength will decrease. For the tested formulations, 5% appears to be the threshold value at which the maximum strength is attained.
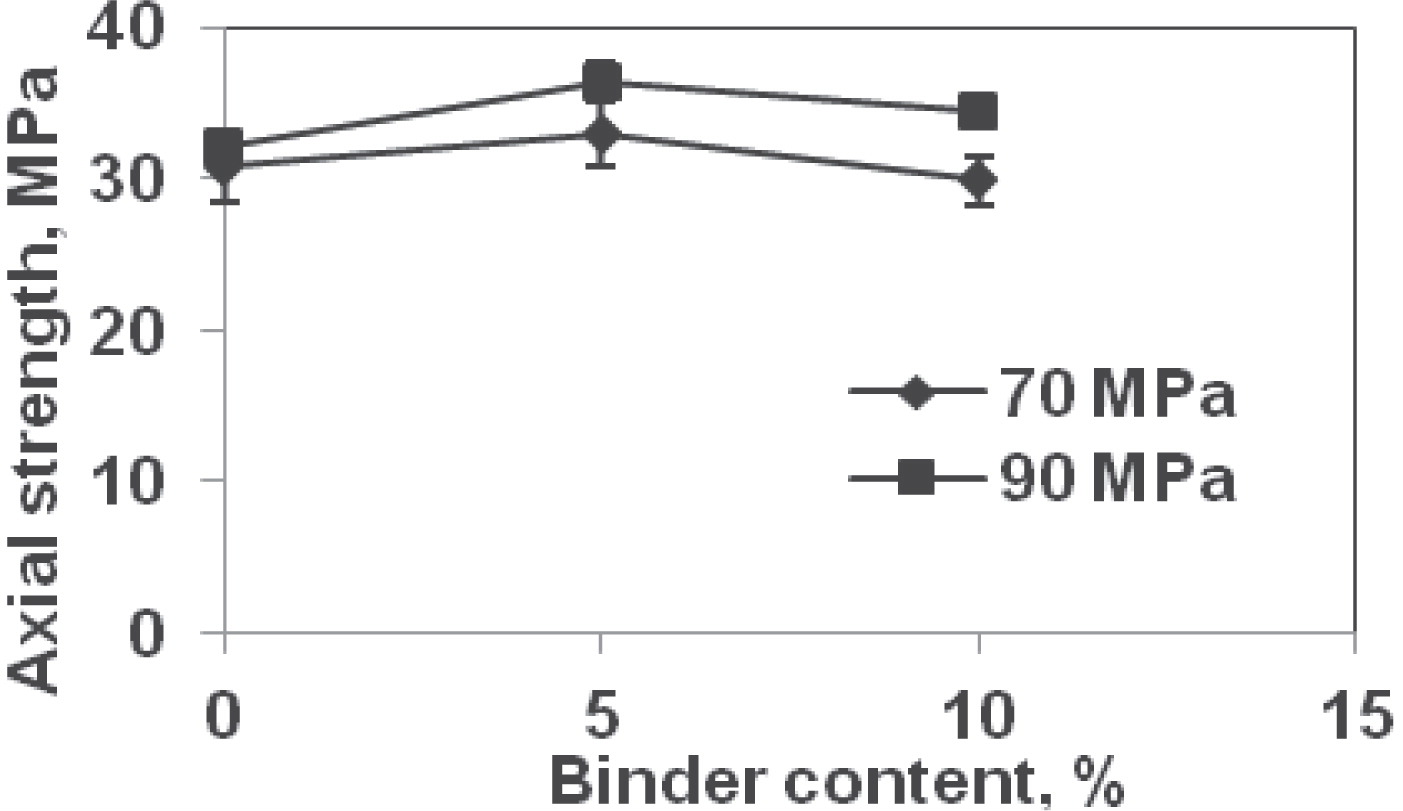
Table 3
Diametral strength of tablets made from dry powder formulations at 70 and 90 MPa compression pressures and different binder contents
*
| Binder content, % |
Compression pressure |
| 70 MPa |
90 MPa |
| 0 |
0.19 MPa (0.021) |
0.32 MPa (0.005) |
| 5 |
0.35 MPa (0.008) |
0.38 MPa (0.008) |
| 10 |
0.33 MPa (0.030) |
0.38 MPa (0.029) |
* Standard deviation in parenthesis
Axial penetration strength values for tablets formed at 90 MPa were higher than at 70 MPa for all binder contents (Fig. 3). The average axial penetration strength values at 70 MPa were 30.8, 32.9, and 29.8 MPa at 0, 5, and 10% binder, respectively (Table 4). These values at 90 MPa compression pressure were 32.0 (4%, increase over 70 MPa value), 36.5 (11%), and 34.3 MPa (15%). The axial penetration strength increased with binder content upto 5%; thereafter, it decreased when binder content increased from 5 to 10% similar to the diametral strength. Since axial penetration strength is a measure of failure value similar to the diametral strength, decrease in strength value was measured beyond 5% binder content; i.e., further corroborating that the threshold value at which maximum strength is attained is 5% binder content.
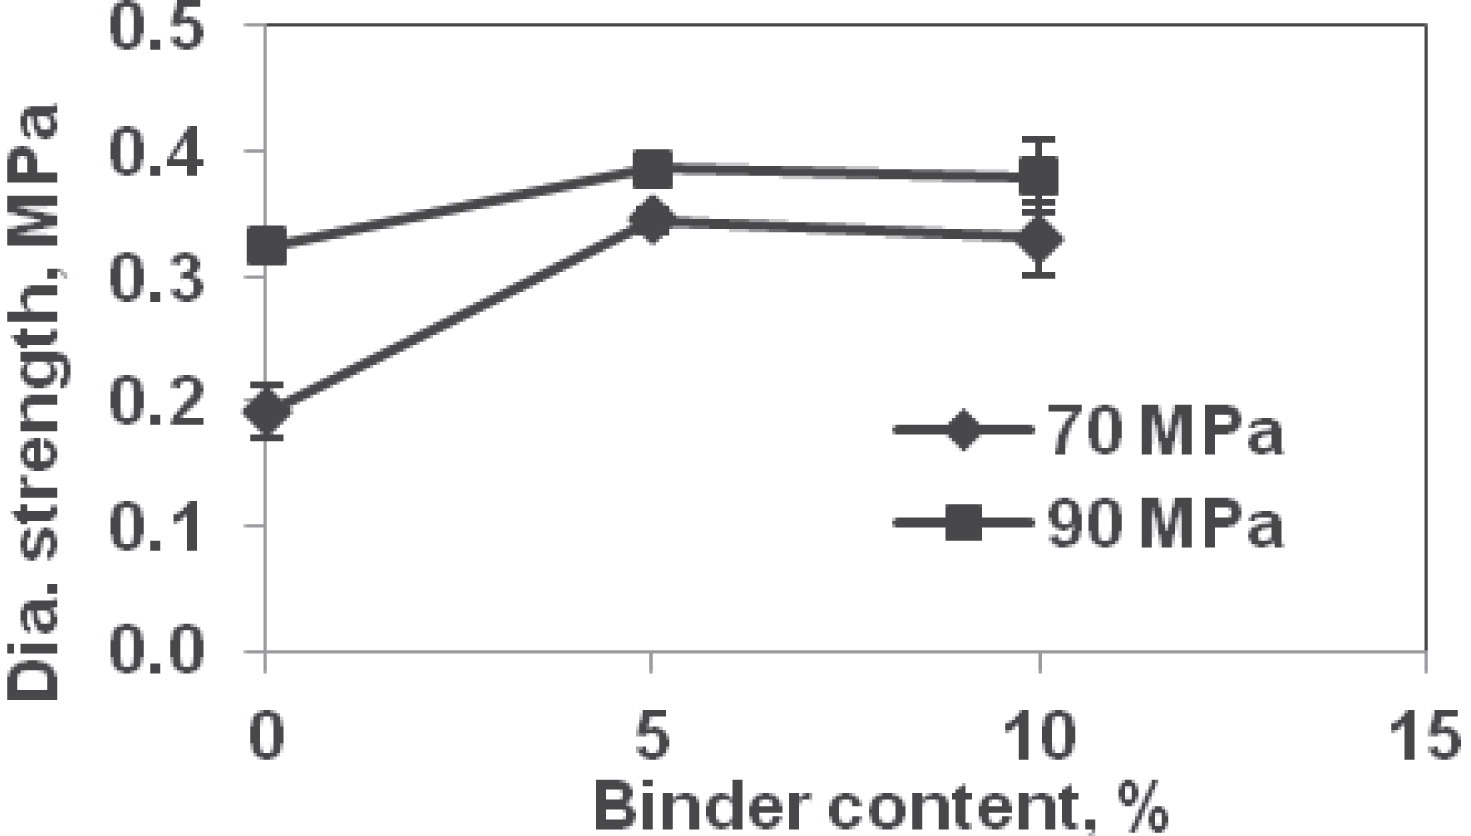
Table 4
Axial penetration strength of tablets made from dry powder formulations at 70 and 90 MPa compression pressures and different binder contents
*
| Binder content, % |
Compression pressure |
| 70 MPa |
90 MPa |
| 0 |
30.8 MPa (2.4) |
32.0 MPa (1.2) |
| 5 |
32.9 MPa (2.2) |
36.5 MPa (1.3) |
| 10 |
29.8 MPa (1.6) |
34.3 MPa (0.7) |
* Standard deviation in parenthesis
Indentation hardness for tablets formed at 90 MPa were higher than at 70 MPa at all binder contents (Fig. 4). The average indentation hardness values at 70 MPa were 1.15, 1.28, and 1.27 MPa at 0, 5, and 10% binder, respectively (Table 5). These values at 90 MPa compression pressure were 1.25 (9%, increase over 70 MPa value), 1.38 (8%), and 1.40 MPa (10%). The indentation hardness increased with binder content upto 5%; thereafter, it either decreased slightly or remained nearly the same when binder content was increased from 5 to 10%. Indentation is a measure of surface and top layers’ resistance to penetration. It can be hypothesized that as the binder content increases, it helps build bridges between particles, i.e., assisting with the hardness. However, beyond a certain value, i.e., when sufficient bridges have been formed; binder itself being soft plastic-type material will reduce the resistance to deformation. For the formulations tested, this threshold value appears to be in the vicinity of 5% binder content.
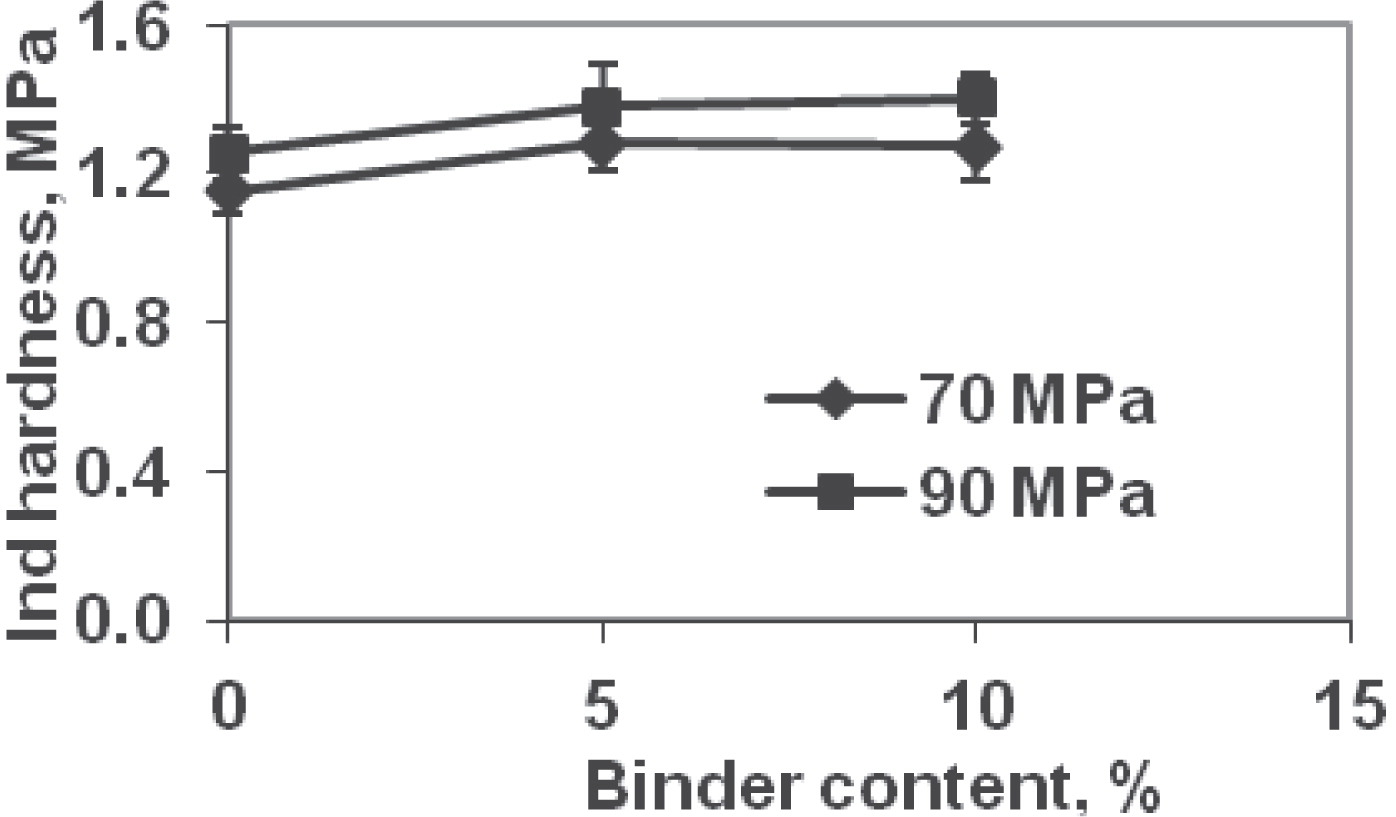
Table 5
Indentation hardness of tablets made from dry powder formulations at 70 and 90 MPa compression pressure and different binder contents
*
| Binder content, % |
Compression pressure |
| 70 MPa |
90 MPa |
| 0 |
1.15 MPa (0.06) |
1.25 MPa (0.07) |
| 5 |
1.28 MPa (0.07) |
1.38 MPa (0.11) |
| 10 |
1.27 MPa (0.09) |
1.40 MPa (0.07) |
* Standard deviation in parenthesis
Friability of tablets was higher for forming pressure of 70 MPa compared to 90 MPa for all binder contents (Fig. 5). The friability values at 70 MPa were 1.62, 1.31, and 1.48% at 0, 5, and 10% binder, respectively (Table 6). These values at 90 MPa compression pressure were 0.92 (43%, decrease over 70 MPa value), 0.79 (40%), and 0.75% (49%). The friability decreased with binder content upto 5%; thereafter, it increased when binder content increased from 5 to 10%. At low binder levels (<5% in this study), addition of binder improved the bonding between the particle and hence the friability decreased. However, as the binder level was increased, although fewer but larger granules were dedusted; which effectively increased the overall friability. In other words, increase in binder level beyond a formulation-specific value can adversely affect both strength and friability. For the specific formulations studied, based on experimental results, the binder level of about 5% produced best values of tablet metrics.
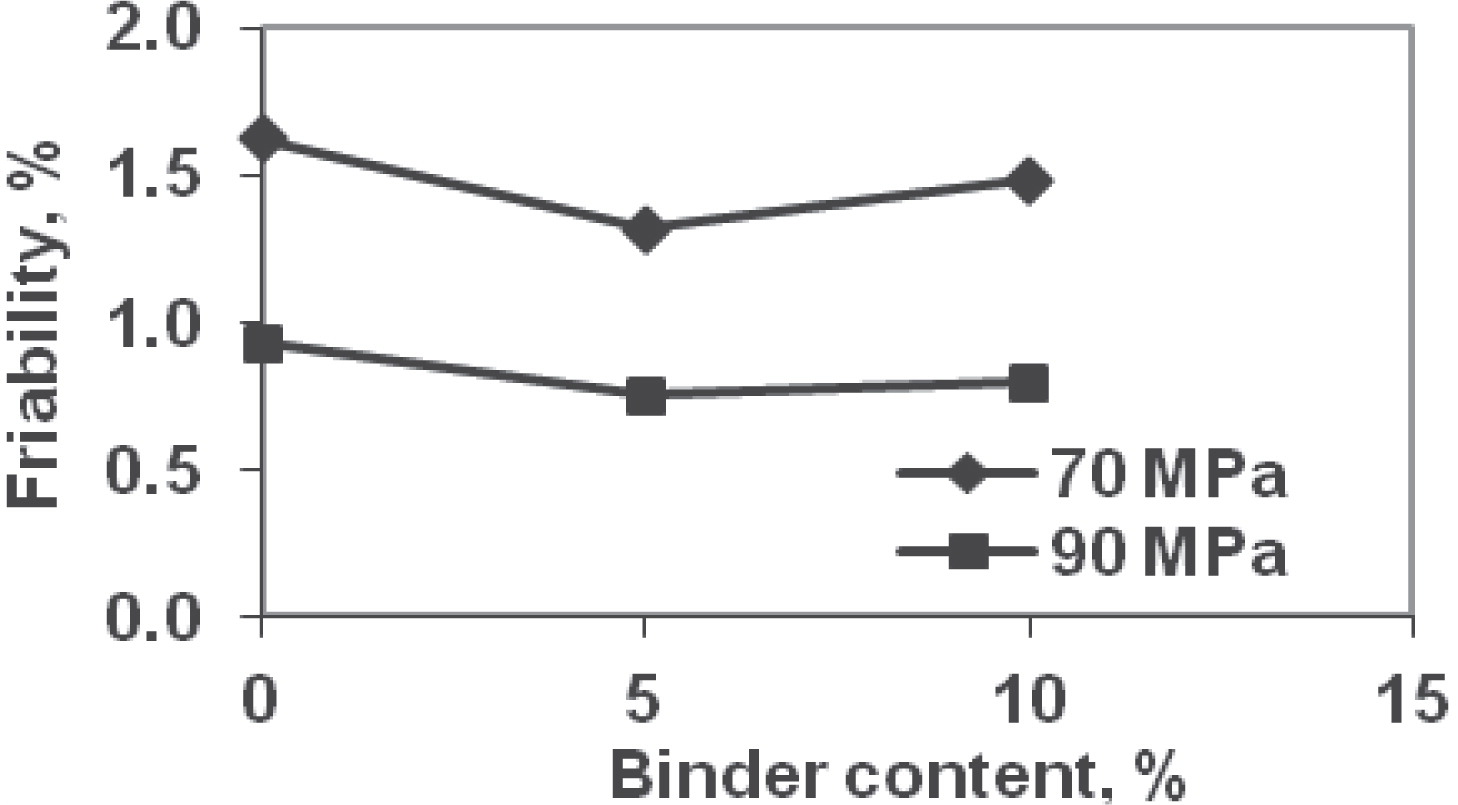
Table 6
Friability (%) of tablets made from dry powder formulations at 70 and 90 MPa compression pressures and different binder contents
| Binder content, % |
Compression pressure |
| 70 MPa |
90 MPa |
| 0 |
1.62% |
0.92% |
| 5 |
1.31% |
0.75% |
| 10 |
1.48% |
0.79% |
Relationships based on regression analysis were developed between tablet quality parameters and powder mechanical properties at different binder contents and loading rates. The regression equations between each tablet quality and powder property were developed. Few examples of regression equations for predicting the tablet quality parameters are given in Table 7 The complete list of equation is given in Pandeya (2009).
Table 7
Regression equations for predicting the tablet quality parameters
| Tablet Quality Parameters |
Regression Equations |
R2 |
| Diametral Strength (DS) |
DS70 = 14.11 SI10, 20 − 0.79* |
0.99 |
| DS90= 5.70 SI10,20 + 0.075 |
0.99 |
| Axial Strength (AS) |
AS70= 40.46 CI5, 10 − 7.91 |
0.93 |
| AS90= 247.53 SI5,20 + 17.76 |
0.98 |
| Indentation Hardness (IH) |
IH70= − 4.90 SI2.5,10 + 1.59 |
0.99 |
| IH90= − 9.36 SI10,10 + 2.27 |
0.98 |
| Friability (FR) |
FR70= 14.11 SI10, 20 − 0.79 |
0.99 |
| FR90= − 15.28 SI10,20 + 1.99 |
0.99 |
BM – Bulk modulus (GPa), CI – Compression index, SI – Spring-back index, SM – Shear modulus.
* DS
70 = 14.11 SI
10, 20−0.79, DS
70 = Diametral strength at 70 MPa compaction pressure and SI
10, 20 = Spring-back index at 10 MPa pressure and 20 MPa/min loading rate
Compression index, spring-back index, and shear modulus were found most suitable for predicting the diametral strength (R2> 0.80), i.e., explains 80% of the variations. All of the six spring-back index values at three different pressures and two loading rates were found to be suitable for predicting with diametral strength of tablets formed at 70 and 90 MPa. Tablets’ diametral strength vs. powder formulations’ spring back index (determined at 20 MPa/min loading rate; Pandeya and Puri, 2011) at 90 MPa tabletting pressure is presented in Fig. 6 To explain the relationship between the tablets’ diametral strength, axial penetration strength, and indentation hardness with powder formulations’ spring-back index, an elastic energy based approach was used. This is given in a later section entitled Elastic Energy Explanation of Tablet Quality Relationship with Powder Spring-back Index.
Axial Penetration Strength:
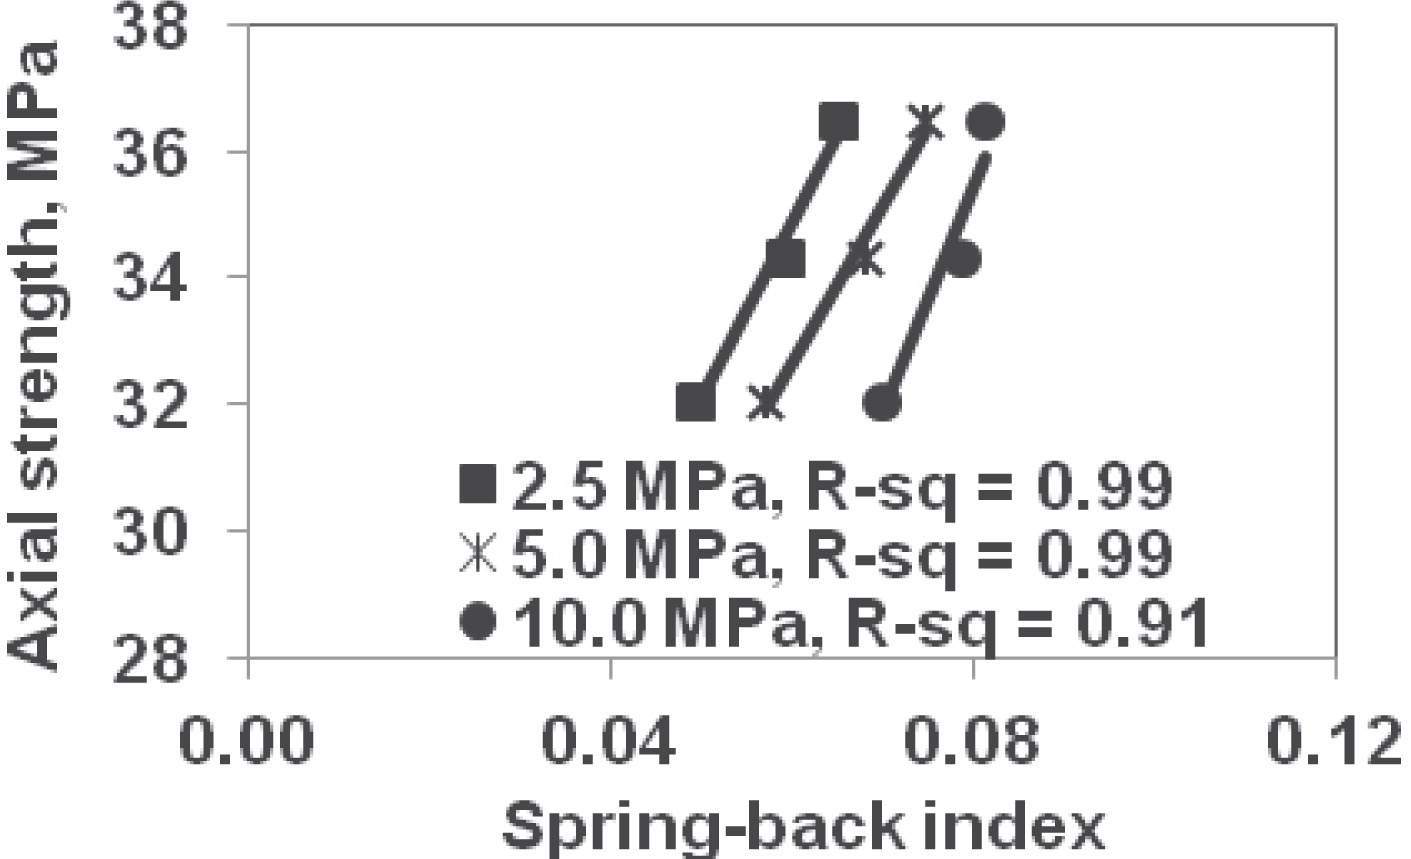
Compression index, spring-back index, and shear modulus (at 2 MPa stress difference) at higher loading rate had good relationship (R2>0.80) with axial penetration strength of tablets formed at 90 MPa. Tablets’ axial penetration strength vs. powder formulations’ spring back index (determined at 20 MPa/min loading rate) at 90 MPa tabletting pressure is presented in Fig. 7.
Indentation Hardness:
Compression index, spring-back index, and shear modulus were found most suitable for predicting the indentation hardness. All six values of spring-back index and five values of shear modulus correlated well with indentation hardness of tablet formed at 70 and 90 MPa. Tablets’ indentation hardness vs. powder formulations’ spring back index (determined at 20 MPa/min loading rate) at 70 MPa tabletting pressure is presented in Fig. 8.
Friability:
Bulk modulus, compression index, spring-back index, and shear modulus at higher loading rate were found suitable for predicting the friability. Tablets’ friability vs. powder formulations’ spring back index (determined at 20 MPa/min loading rate) at 90 MPa tabletting pressure is presented in Fig. 9.
In summary, all four tablet quality indexes evaluated in this study, namely, diametral strength, axial penetration strength, indentation hardness, and friability, were most correlated with the spring-back index of powder formulations in low to medium pressure regime ( <10MPa). Therefore, in the ensuing section, the spring-back index is used as the basis for explaining the tablet quality relationships via the elastic energy approach.
4.4 Elastic energy explanation of tablet quality relationship with powder spring-back index
Spring-back index is the measure of elastic recovery of the powder mass after the pressure is removed. The recovery includes contributions of both the solid particles and inter-particle void spaces. As powder retains some memory of its elastic response in early stages of compaction ( <10 MPa herein), this implies that a powder’s elastic property could be related to the elastic response of tablet quality metrics. To explain and prove this hypothesis, an energy based approach is proposed and validated. During tablet formation, force or pressure is applied through a punch, which inputs energy into the powder mass. When the compaction force is released, part of the energy is recovered in the form of elastic energy. The overall energy balance for the tablet compaction process can be written as:
where,
-
ET = Total Energy Input
-
EC = Energy Used in Compression (Includes Energy utilized in movement and rearrangement of particles, overcoming the friction between the particle and friction between the die wall and particles)
-
EE = Elastic Energy Recovered
To establish the energy based approach, tablets were loaded and unloaded similarly as in the case of diametral strength, axial penetration strength, and indentation hardness tests. However, during this study, the force was applied as close as practically feasible to, but below, the failure of the tablet. To ensure the contact of the probe with the tablets, initial force of 2.2 N was applied, before starting the test. Next, force and displacement during both loading as well as unloading were plotted. The area under the curve was used to estimate the energy. The loading and unloading curves for the case of diametral strength, axial penetration strength, and indentation hardness tests are given in
Fig. 10a, b, and c, respectively. The elastic energy was calculated by numerical integration to obtain the area under the unloading curve, i.e., shaded area in
Fig. 10a, b, and c, respectively. The plots between the diametral strength, axial penetration strength and indentation hardness and their respective elastic energy are given in
Fig. 11a, b, and c. Corresponding plots between these tablet qualities and spring-back index values are also shown in
Fig. 11a, b, and c, respectively. Spring-back index was used in these relationships since it had the highest R
2 value compared with other measured mechanical properties. From the figures it is clear that with increase in the hardness or strength values, the elastic energy also increased in all cases. The R
2 values for these relationships were greater than 0.84. This indicated that tablet’s elastic energy can be directly related to the tablet’s physical properties, i.e., both are related.


An explanation follows for the observed strong relationships between spring-back of powder formulations with the tablet parameters. For an elastic material, energy under identical loading and unloading conditions (i.e., same loading rate and peak strain value in case of strain (displacement) controlled device) must be the same, i.e., elastic energy is the highest. As the inelasticity of material increases, the elastic energy magnitude decreases, i.e., is lower. When the binder content is zero in the formula, i.e., no binder, the bonding as noted in literature is hypothesized to occur between particles welding at points of contacts via melting followed by solidification (German 1994). This leaves only a limited amount of recoverable energy. However, when the binder is added in dry mixture state, it promotes the formation of secondary structures that are larger in size than the primary particles. The secondary structures bond to each other leading to the formation of the tablet. Akin to granulation, these larger, irregularly shaped secondary structures store greater elastic energy (such as during bending and distortion), which is released through rebound during unloading. The elastic energy of tablets formed with 0%, 5%, and 10% binder contents is shown in Fig. 11a, b, and c. In all cases the elastic energy of 5% and 10% is greater than 0% binder tablets. Furthermore, as the binder content is increased from 5% to 10%, there is an overabundance of binder in the mixture; while the secondary structures are formed as hypothesized, there is excess binder. This excess binder manifests its soft and pliable native characteristics compared with other constituents, i.e., has a portion of energy that goes into the excess binder that is not recovered during unloading. Therefore, there is a decrease in elastic energy, which is true for all three metrics: diametral strength, axial penetration strength, and indentation hardness. In fact, the order of spring-back index value at 0%, 5%, and 10% binder content is consistent with the order of elastic energy. This provides a strong evidence of the feasibility of using elastic response in early stages of compression (<10 MPa) to predict tablet’s mechanical quality metrics.
Conclusions
In the present study, the fundamental mechanical properties of powder formulations determined at medium pressure were related with the various physical properties of the tablets. Powder formulations’ mechanical properties such as bulk modulus, compression index, spring-back index, shear modulus and failure stress were determined using a cubical triaxial tester. Tablets were formed using the same formulations and their properties such as diametral strength, axial penetration strength, indentation hardness, and friability were determined.
Diametral strength, axial penetration strength and indentation hardness increased with compression pressure. Friability decreased with compression pressure. The diametral strength axial penetration strength and indentation hardness increased with the binder content up to 5% thereafter it decreased or remained same when the binder content increased from 5 to 10%.
Statistical relations were developed between tablets’ quality parameters and the powder mechanical properties at different binder contents and loading conditions. Spring-back index and compression index were found most suitable for predicting diametral strength, indentation hardness, and friability for the formulation used in the study. In case of the axial penetration strength, compression index, spring-back index, and shear modulus at higher loading rate had good relation for tablets formed at 90 MPa. An elastic energy-based approach was successfully used to explain the relationship of tablet quality parameters: diametral strength, axial penetration strength and indentation hardness, with spring-back index.
The positive outcome of this feasibility study suggests that the approach of relating mechanical properties of powder formulations in the low to medium pressure range (<10 MPa) vs. tablet physical quality parameters could be used for other similar formulations. Although the study focused only on binder content, the approach could be applied and tested for other ingredients. In closure, the initial results of this research are promising and have the potential for application in industries involved in powder compaction.
Author’s short biography
Anuranjan Pandeya

Anuranjan Pandeya is currently working as a post doctoral scholar at Penn State University. Dr. Pandeya has been involved in research in the area of powder mechanics, particle characterization and size reduction behavior of powders. He worked for industries and research institute prior to joining Ph.D. Dr. Pandeya has coauthored several papers in the area of powder and particulate science. He also presented paper in various national and international professional meetings and gave technical talks to industries and research institutes. The research work reported in the paper is based on the work done during his Ph.D. at Penn State.
Virendra M. Puri

Virendra M. Puri, University Distinguished Professor, has researched in the field of powder science and engineering for over three decades. He served as the Acting Director of the Particulate Materials Center and has co-authored numerous publications. Professor Puri is co-inventor and holder of patents in powder flow, deposition, and compaction and has copyright for multi-purpose computational software on powder processing. He has been invited to serve on Editorial Boards, International Advisory Boards, and Chairpersons of several bulk solids-related publications and professional activities. Professor Puri is Co-Editor-in-Chief of Particulate Science and Technology. He has received several teaching and research awards.
References
- Ameye, D., Keleb, E., Vervaet, C., Remon, J. P., Adams, E. and Massart, D. L. (2002): Scaling-up of a lactose wet granulation process in Mi-Pro high shear mixers, European J. of Pharmaceutics and Biopharmaceutics, 17, pp.247–251.
- German, R. M. (1994): “Powder metallurgy science”, 2nd Edition. Princeton, NJ: Metal Powder Industries Federation, 279 p.
- Kamath, S. and Puri, V. M. (1997): Measurement of powder flow constitutive model parameters using a cubicle triaxial tester, Powder Technology, 90, pp.59–70.
- Kuentz, M. and Leuenberger, H. (2000): A new approach to tablet strength of a binary mixture consisting of well and a poorly compactable substance, European Journal of Pharmaceutics and Biopharmaceutics, 49, pp.151–159.
- Li, F. and Puri, V. M. (1997): “Development, testing, and verification of a medium pressure flexible boundary cubical triaxial tester” ASAE Paper No. 97-4104, American Society of Agricultural Engineers (ASAE), St. Joseph, MI, 12 p.
- Leuenberge, H. and Rohere, B. D. (1986): Fundamentals of powder compression. I. The compactibility and compressibility of pharmaceutical powders, Pharmaceutical Research, 3, pp.12 – 22.
- Mittal, B. and Puri, V. M. (2005): Rate-dependent elasto-viscoplastic constitutive model for industrial powders. Part 1: Parameter quantification, Particulate Science and Technology 23, pp.249–264.
- Pandeya, A. (2009): “Relating mechanical properties of dry and granulated pharmaceutical powder formulations with tablet quality parameters” PhD Dissertation, The Pennsylvania State University, University Park, PA, 313 p.
- Pandeya, A. and Puri, V. M. (2008): “Comparison between mechanical properties of dry blended and granulated pharmaceutical powder formulations”, ASABE Technical Paper No. 083540, American Society of Agricultural and Biological Engineers (ASABE), St. Joseph, MI, 22 p.
- Pandeya, A. and Puri, V. M. (2011): Rate-dependent mechanical properties of dry blended pharmaceutical powder formulations for tabletting applications, Powder Technology, 207, pp.26–34.
- Riippi, M., Antikainen, O., Niskanen, T. and Yliruusi, J. (1998): The effect of compression force on surface structure, crushing strength, friability and disintegration time of erythromycin acistrate tablets, European J. of Pharmaceutics and Biopharmaceutics, 46, pp.339–345.
- Tabor, D. (2000): “The Hardness of metals”, Oxford University Press, London, 175 p.
- Tye, C. K., Sun, C. and Amidon, G. E. (2005): Evaluation of the effects of tableting speed on the relationships between compaction pressures, tablet tensile strength, and tablet solid fraction, Journal of Pharmaceutical Sciences, 94, pp.465–472.
- Wu, C. Y., Best, S. M., Bentham, A. C., Hancock, B. C. and Bonfield, W. (2005): A simple predictive model for the tensile strength of binary tablets, European Journal of Pharmaceutical Sciences, 25, pp.331–336.


;%0A%09%09%09newWindow.document.open();%0A%09%09%09newWindow.document.write('<img src=%22./Graphics/30_2013020_12.jpg%22>');%0A%09%09%09newWindow.document.close();%0A%09%09)
;%0A%09%09%09newWindow.document.open();%0A%09%09%09newWindow.document.write('<img src=%22./Graphics/30_2013020_13.jpg%22>');%0A%09%09%09newWindow.document.close();%0A%09%09)