Abstract
The generalisation of scientific findings between differently sized silos is a challenge faced across many industries. One obstacle is the scaling of material properties (e.g. particle size), process parameters (e.g. the powder feeding rate) and dimensions (e.g. silo diameter and height) to obtain significant results1). The second issue for a meaningful scaling law is maintaining the dynamic similarity between two differently sized silos. A common phenomenon observed when filling alumina storage silos is called air current segregation (ACS,) and was investigated in detail in Zigan et al.2). This paper is now a continuation, exposing the developed scaling rule to a challenging test by replacing alumina with sand particles and the continuum air with water. Results of the scaling tests show that the proposed dimensionless groups do not capture the complete physics. One reason is that using terminal velocity in the scaling law as a physical parameter to lump in fluid and material properties over-simplifies the problem. Another finding is that the particle dynamics in the water model is somehow different from experiments in the air silo.
1. Introduction
Scaling is important when investigating a physical phenomenon such as ACS which causes severe powder handling problems in industry. Experimental findings have to be scientifically justified to convince industry to change process parameters. One approach is to apply dimensional analysis (DA) by keeping material, process and equipment parameters dynamically and geometrically similar1). Dynamic similarity can be preserved in differently sized silos when particle, process and equipment parameters are scaled according to a scaling rule. The scaling rule presented in Zigan et al.2) (first paper applying the scaling rule) is believed to be able to scale process and equipment parameters between differently sized silos. However, the scaling of material properties such as particle size hampers the use of the DA approach when, for example, scaling to a small size causes a change in the flow behaviour from free flowing to cohesive. The consequences of amending the flow characteristic of powders are changes in the particle dynamics in the silo. To satisfy the scaling law, the material and process parameters have to be adjusted to maintain dynamic similarity between differently sized silos1). This adjustment includes changes of the particle size and the fluid properties. Changing the fluid in which particles settle affects the hydrodynamics of the solid-fluid phase flow. A particle settling in a surrounding fluid will create a disturbance in the fluid. This disturbance creates a convection flow which influences the flow of particles. The particles are separated from each other and settle as single particles in the fluid3). The settling of particles is described by their terminal velocity, and the velocity distribution of the differently sized particles is the most influential parameter for segregation effects4). The settling of particles in a fluid is scientifically well understood even though it is still difficult to predict the particle settling velocity accurately. The prediction of the particle settling velocity depends on calculating the drag coefficient which is directly linked to the Reynolds number of the settling particle5). Hazzab et al.6) define the drag force Cd as:
|
C
d
=
(
ρ
s
−
ρ
f
)
g
V
ρ
f
(
V
t
/
2
)
A | (1) |
where
ρs is the density of the particle and
ρf the density of the fluid, g gravity and
Vt is the volume of the particle.
A is the projected area following the flow, and
Vt is the terminal velocity. Equation (
1) shows that the particle density influences the drag force and consequently the terminal velocity. The density of a bulk of particles can vary when dealing with porous particles such as alumina.
2. Theoretical Model
The calculation of the terminal velocity follows the approach suggested by Turton et al.7) For convenience, a dimensionless particle diameter defined in equation (2) and a dimensionless terminal velocity defined in equation (3) are calculated to estimate the terminal velocity of a single particle settling in the fluid.
|
d
*
d
=
(
ρ
f
(
ρ
s
−
ρ
f
)
g
μ
2
)
1
3 | (2) |
where
d* is the dimensionless diameter,
d is the particle diameter of a defined mass fraction and
μ is the viscosity.
|
V
t
*
V
t
=
[
ρ
f
2
μ
(
ρ
s
−
ρ
f
)
g
]
1
3 | (3) |
where
V
t
* is the dimensionless terminal velocity.
The dimensionless terminal velocity can be calculated using the following empirical relation in equation (4)7):
|
log
10
V
t
*
=
−
1.64758
+
2.94786
∗
log
10
d
*
−
1.09703
∗
log
10
d
*
2
+
0.17129
∗
log
10
d
*
3 | (4) |
The terminal velocity is calculated to scale the material and process parameters between differently sized experiments. The scaling rule proposed by Zigan et al.
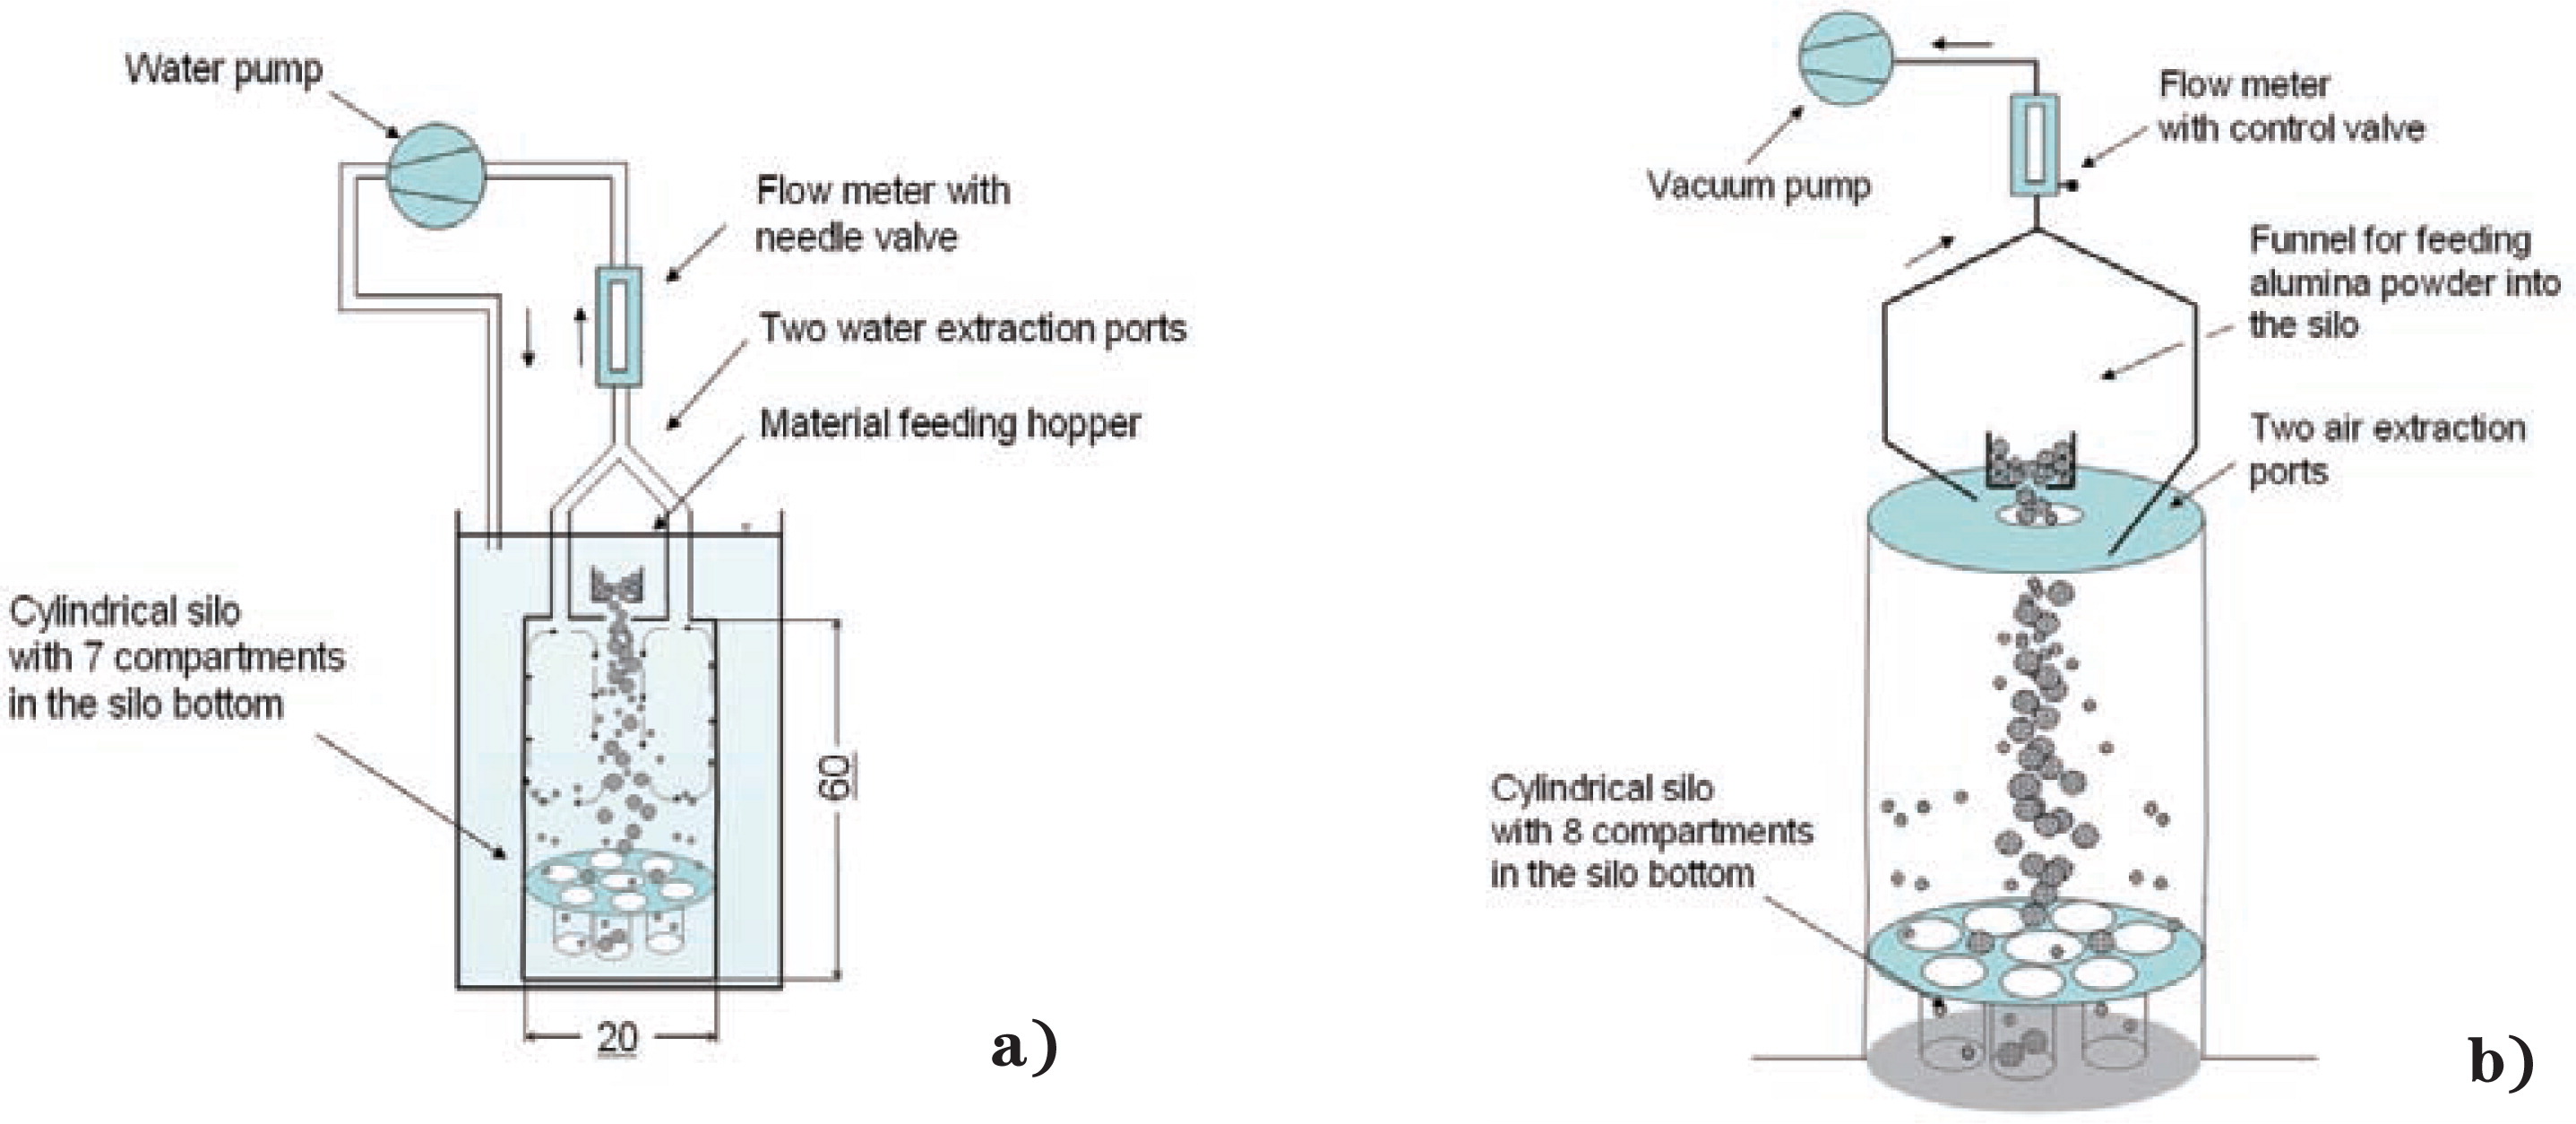
2) was applied to predict segregation for different process parameters and silo dimensions. The experimental designs of the air-alumina silo and the sand-water silo are shown in
Fig. 1 The scaling rule is reproduced in equation (
5):
|
I
s
=
f
(
E
S
,
R
2
V
t
S
) | (5) |
where
E is the air extraction rate,
S the powder feeding rate,
R is the silo dimension (e.g. radius) and
Vt is the terminal particle velocity.
The segregation index as defined in equation (6) includes the particle mass and the particle size distributions over all compartments of the experimental silo as shown in Fig. 1:
|
I
s
=
(
∑
i
M
i
M
L
×
[
c
i
−
c
L
c
L
]
2
)
0.5 | (6) |
where
ci is the mass fraction of fines in the single compartment
i,
Mi is the mass of powder in compartment
i,
cL is the mass fraction of fines over all compartments and
ML is the total mass in all compartments. This paper extends the research work of Zigan et al.
2) and tests the scaling rule in differently sized silos with different materials and process parameters. The comparison of results in differently scaled silos requires an empirical relationship to compare experimental data. The method of least sum squares was selected to correlate experimental data
2).
3. Prediction Model
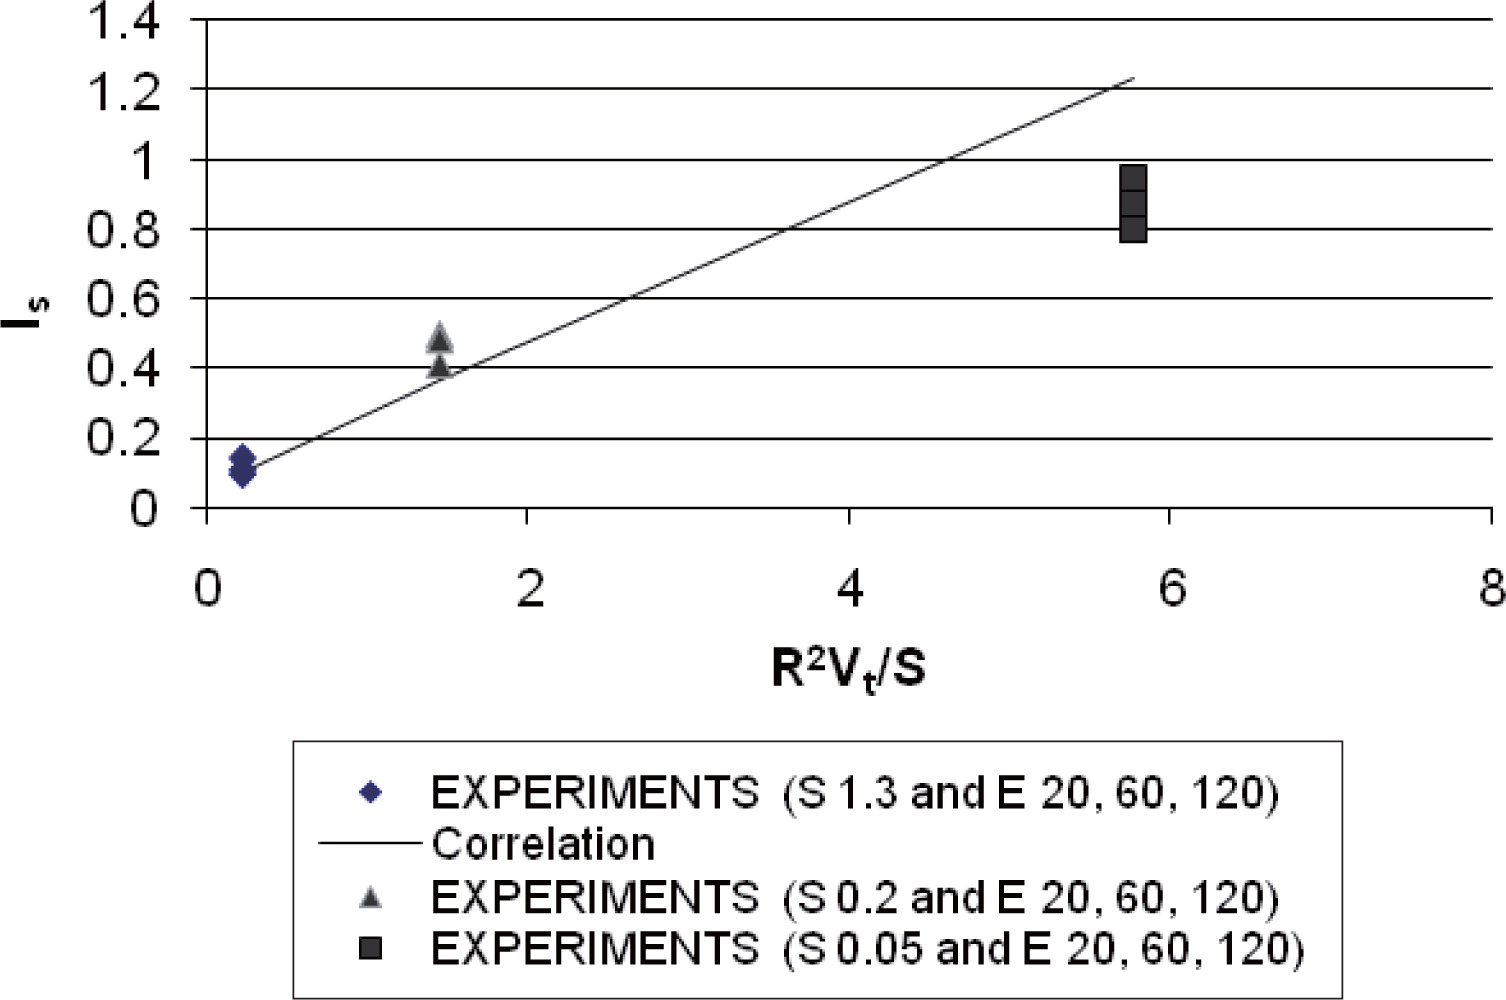
The development of a theoretical model predicting ACS in silos is useful when process parameters are changing, e.g. variable feeding rate to an industrial storage silo. The prediction model for ACS in silos is based on the method of least sum squares fitting for experimental data. A set of experimental data2) is correlated and the linear relationship between the dimensionless groups is then plotted in a graph. When plotting the correlated values for two dimensionless groups in a graph, the third dimensionless group should remain unchanged. In the experiments2), the geometry (e.g. radius of the silo) and material properties (e.g. Vt of the particles) are kept constant. Keeping the ratio of the dimensionless group (E/S) the same as the dimensionless group (R2Vt/S) requires adjusting the air extraction rate (E) according to the changes of the powder feeding rate (S). The log10 of the dimensionless group (E/S) is plotted vs the log10 of the dimensionless group (Is) as shown in Fig. 2. One of the advantages of choosing a power law formulation for the correlation is that it always results in positive values for IS.

Data from three different feeding rates (0.05, 0.2 and 1.3 kg/min) and three different air extraction rates (20, 60 and 120 L/min) are correlated to obtain a linear relationship between the two dimensionless groups. For each of the three lines in Fig. 2, linear equations such as equation (7) were found by the method of least squares. The values of α1 and α2 in equation (7) are constants and are estimated in the next step.
|
log
10
I
s
=
α
1
+
α
2
⋅
log
10
(
E
S
) | (7) |
Since all the trend lines have nearly the same slope in
Fig. 2, it was decided to use the average value of
α2 from the three lines. The average value obtained for
α2 is 0.024. The values for
α1 were calculated by applying equation (
8) and then fitted to the three lines by the method of least squares.
|
α
1
=
log
10
I
s
−
α
2
⋅
log
10
(
E
S
) | (8) |
The resulting values of a1 are then plotted versus the third dimensionless group S/R2Vt (Fig. 3). Finally, values for the constants α1, α2 as well as different powder feeding and air extraction rates are computed using equation (9). Equation (9) can be utilised to predict the segregation behaviour of a material when process parameters are altered. Experimental data are taken from Zigan et al.2) Plotting the third dimensionless group, which includes the geometry of the silo (R) and the material/ fluid properties (Vt), vs the dimensionless group (Is) provides an indication of how well the theoretical model predicts segregation in the silo (Fig. 4). Fig. 4 shows that the predicted values agree well with the experimental data for high feeding rates. For lower feeding rates, the prediction model does not work very well. This can partly be explained by the characteristic of the particle jet which became more dilute with lower powder feeding rates2).

|
log
10
I
s
=
0.197
xS
R
2
v
t
+
0.015
+
0.024
⋅
log
10
(
E
S
) | (9) |
The resulting correlation shown in equation (9) can also be applied to predict segregation in differently sized silos and by using Fig. 4, the segregation tendency of powders in differently scaled experiments can be compared.
In the next section, the validity of the scaling law presented in equation (5) will be tested. The testing of the scaling law is challenging since material and process parameters have to be scaled according to equation (5) to keep dynamic and geometric similarity.
4. Experimental Model
Two dimensionally similar sets of experimental silos scaled by a factor of two are used to validate the scaling rule. The first experimental apparatus is the air-alumina silo which is set up in the same way as described in Zigan et al.2) The only difference is that the silo bottom contained only one central compartment and one outer ring with 7 catchments as shown in Fig. 1. The cylinder of the larger alumina-air silo has a diameter of 0.4 m and a height of 1.2 m. Two air extraction ports at the top plate are connected to the main vacuum line and extract air from the experimental silo. The set air flow rate is 16 L/min. A total mass of 1000 g alumina is fed centrally into the silo. The funnel in the experiments uses a flow reduction plate with one opening to create a dense particle jet. The alumina is fed at 0.8 kg/min into the silo.
Fig. 1 also shows the set-up of the scaled-down experiment. The air is replaced by water. The water silo is smaller than the air silo by a factor of two. The cylindrical silo is completely submerged in water. All geometric dimensions have to be scaled down from the alumina-air silo to keep dimensional and dynamical similarity between the two experiments. The alumina is replaced by sand. Sand is inert when submerged in water and particles have an almost spherical shape. The density of sand particles is around 2650 kg/m3 compared to the density of alumina 1500 kg/m3. In the sand experiment, the silo height is 0.6 m and the silo diameter is 0.2 m. A total mass of 250 g sand is fed into the silo. The mass reduction is necessary because the 7 catchments in the bottom cannot accommodate more material. The mass flow rate into the silo is around 0.2 kg/min. A centrifugal pump extracts water from the silo and pumps it back into the vessel. A needle valve with a flow range of 20 to 270 L/h1 is used to keep the fluid extraction rate at 4 L/min. After all sand settled at the silo bottom, the water is drained and the sand collected from the seven catchment areas in the silo. Then the sand is dried in an oven. After the sand was completely dry, the particle size and the mass fraction in each compartment was measured.
1 1 L/h around 2.7×10
−7m
3/s
5. Material Properties
Industrial supplied alumina was sieved in eight fractions where the largest particle size was 90 microns. The cumulative mass fraction of alumina is shown in Fig. 5. The content of fines was around 20 per cent. The size reduction of the alumina powder did not affect the material flow behaviour. The alumina powder is slightly more cohesive but still free flowing. The fraction of particles larger than 90 microns was sieved off from the alumina because the corresponding size of the sand particles with the same terminal velocity would otherwise become too large for the experimental set-up.

The mass fraction of sand was kept similar to the mass fraction of alumina and the particle size distribution of the sand particles was estimated using the representative values for the calculated terminal velocities of the alumina fractions in each size interval. Values are presented in Table 1. The cumulative mass fraction of the alumina powder was obtained by particle size analysis using the laser diffraction method.
Table 1
Particle fraction of alumina and sand, and the corresponding single particle terminal velocities
| Particle size [micron] |
Particle mass [g] |
Terminal velocity for single particles [m/s] |
| Sand |
Alumina |
Sand |
Alumina |
Sand |
Alumina |
| 90 |
10 |
2.3 |
1.1 |
0.005 |
0.005 |
| 180 |
21 |
2.3 |
2.1 |
0.02 |
0.02 |
| 290 |
30 |
4.7 |
4.2 |
0.04 |
0.04 |
| 480 |
42 |
8.1 |
7.9 |
0.08 |
0.08 |
| 550 |
50 |
9.5 |
12.1 |
0.09 |
0.09 |
| 800 |
60 |
15.9 |
19.3 |
0.13 |
0.13 |
| 1200 |
72 |
24.4 |
30.3 |
0.19 |
0.19 |
| 2000 |
90 |
33.0 |
45.2 |
0.28 |
0.29 |
The terminal velocities of sand and alumina were plotted vs the cumulative mass distributions as shown in Fig. 6. It can be noticed that there is good agreement of the terminal velocity for the sand and alumina particles in each size interval.
6. Results and Discussion
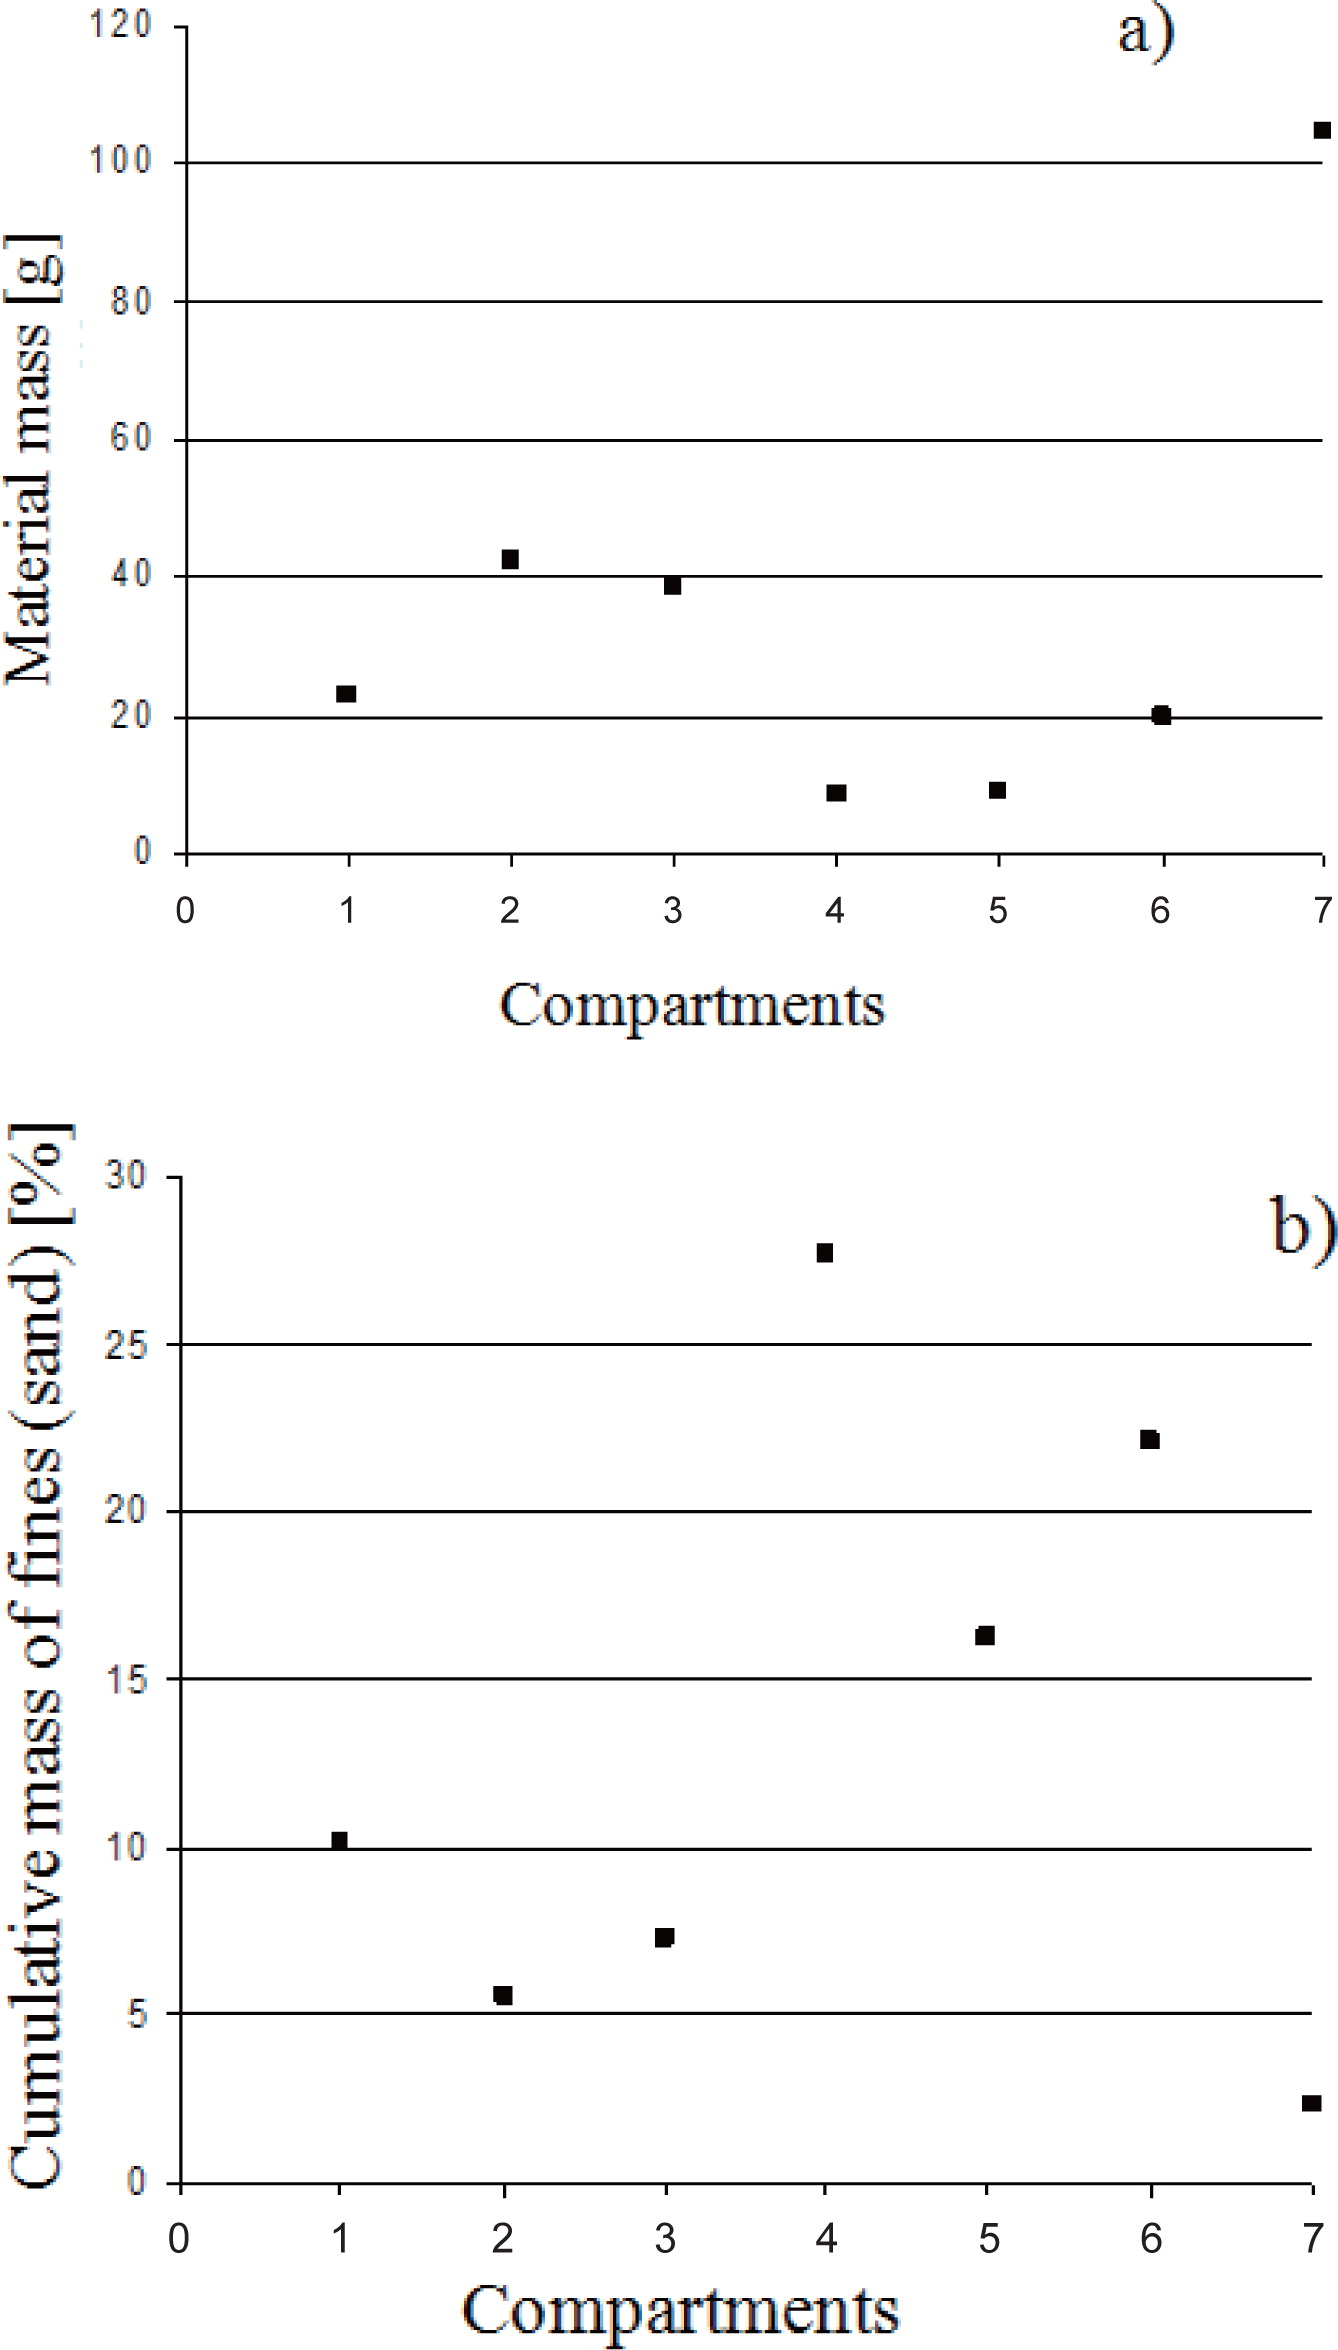
First, the experiments in the water silo were analysed. It was observed that the particle dynamics in the mixed convection flow was mildly influenced by the fluid extraction at the silo top of the water silo. Further, it could be seen that the particles settled in a dilute particle jet with large gaps between the particles. This observation of the particle jet justified using the single particle settling velocity for calculating the material/fluid properties for the scaled-down experiment. The sand which accumulated in the compartments was analysed. The sieve analysis of the dry sand in the outside compartments showed that around 57 per cent of the total sand mass settled in the outer ring (compartments 1–6). This confirmed the observation that the particle jet carried a large fraction of sand particles to the periphery of the silo. The particle mass in the outer compartment ring varied between 10 and 40 g, and a particle mass of 104 g accumulated in the central compartment (number 7).
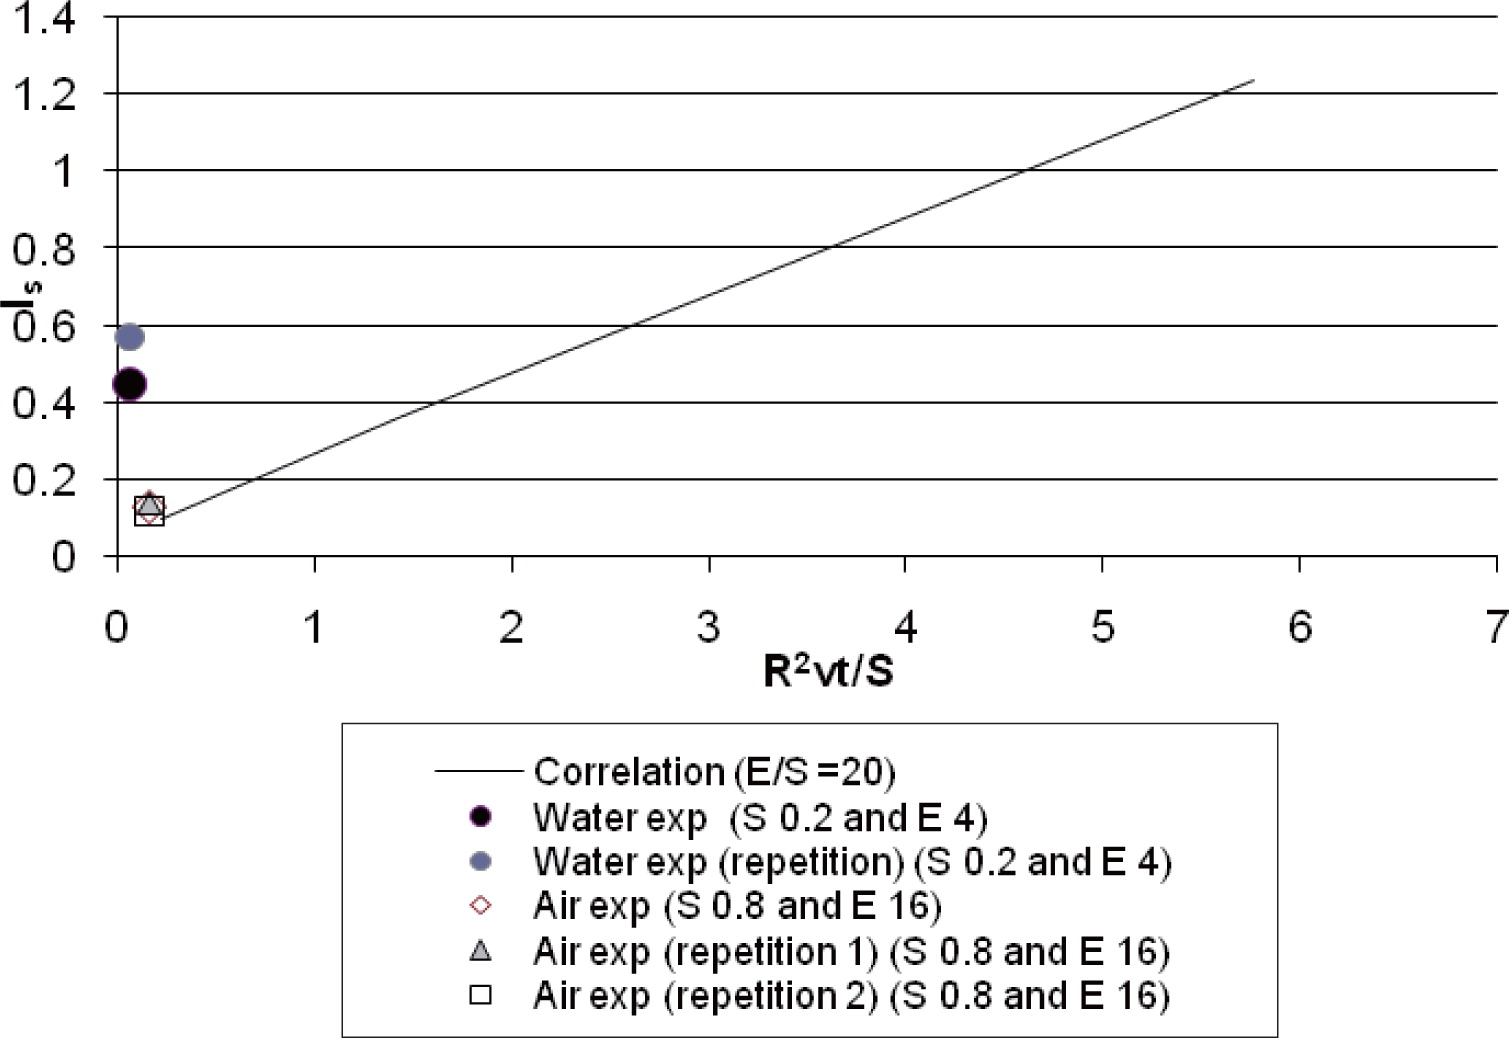
The sand particle size distribution in the different compartments and the results from the fines content analysis are shown in Fig. 7. The calculated segregation index (equation 6) for the sand-water experiment was 0.45. The water experiment was repeated and a segregation index of 0.57 obtained.
Next, the alumina from the air experiment was analysed. The analysis of the alumina material in the outside compartment showed that only 3 per cent of the total powder mass accumulated in the periphery of the silo. The total powder mass in the outer compartment ring was around 36 g and the fines content was around 28 per cent as shown in Fig. 8. The calculated segregation index for the alumina-air experiment was 0.14. The experiment was repeated twice and segregation indexes of 0.13 and 0.12 were obtained. It was observed during the experiments in the alumina-air silo that the particle jet was dense and the particle dynamics were different to the sand-water experiment.

The difference in the particle jets can be partly explained by the fact that the particle jet in the water experiment broke up right after the sand entered the silo. The settling behaviour of sand in water was affected by the properties of the material and the fluid. However, not all of these properties could be considered in the dimensional analysis.
Fig. 9 indicates that the physics of the particle jet had a strong impact on material segregation. For a dilute particle jet, higher segregation values were obtained. One solution to address the issue of permeability of the particle jet could be the introduction of another dimensionless group. The additional dimensionless group could allow for physical effects caused by varying particle jet densities.
7. Conclusions
The scaling rule presented and tested in this paper was able to provide quantitative information about the change in segregation due to amendments of process parameters such as powder feeding and air extraction rates. Changing material properties was a challenging test for the scaling rule because the sand particle jet showed a different behaviour compared with the alumina jet. To address the difference in the particle jets, a new dimensionless group could be added to the scaling rule. The difference in the particle dynamics caused the accumulation of larger sand particles at the periphery of the silo. Values for the segregation index confirmed this observation. The segregation index could be useful as an optimisation tool to fine-tune process parameters in order to minimise segregation in storage silos.
A correlation was developed to compare segregation of different materials in multiple-scale experiments. The correlation predicted well the segregation index for the alumina-air experiment. For the sand-water experiment, the correlation under-predicted segregation. The correlation could be used in industry to predict segregation when changing process parameters such as the powder feeding rate.
Notation
| ACS |
Air current segregation |
| DA |
Dimensional analysis |
| ci |
Mass % of fines in compartment i |
| cL |
Mass % of fines averaged over all compartments |
| E |
Air extraction rate, m3/s |
| Is |
Segregation index |
| Mi |
Powder mass in compartment i, kg |
| ML |
Feed powder mass, kg |
| R |
Dimension (radius), m |
| S |
Powder feeding rate, m3/s |
| Vt |
Terminal particle velocity, m/s |
Acknowledgements
I would like to thank Dr. Krystin Zigan for her continuous support as well as Prof. R. B. Thorpe, Prof. U. Tuzun and Prof. G. G. Enstad for their guidance and encouragement, and the great suggestions of many other colleagues from the University of Surrey are much appreciated. I am very grateful for the very useful discussions and the support provided by AOS in Stade, Germany, and Postec/ Tel-Tek, Porsgrunn, Norway.
Author’s short biography
Stefan Zigan

After graduating as a chemical engineer, Stefan worked as a process design engineer in the aerospace and car manufacturing industry. He did a PhD in multiphase flows minimising segregation in industrial storage silos. Stefan’s research focuses on scaling and understanding flow and flow assurance problems in multiphase flows. He applies modelling techniques such as CFD and DEM as well as experiments to study phenomena in granular materials and fluids. He has a special interest in sustainable energies and energy storage systems (e.g. lithium ion batteries). He is a board member of the non-profit organisation Phalison, which organises knowledge and technology transfers with the Bolivian government to train researchers in Bolivia in lithium technologies and energy storage systems. He is also a member of the scientific board of the Bolivian National Evaporite Deposits Division and the IchemE (PTSIG). Stefan is a lecturer in thermofluids at the University of Greenwich.
Amit Patel

He graduated in chemical engineering from the Imperial College of London with a further year of study, elevating this to a Master’s degree. Amit returned to academia to pursue a doctorate from the University of Greenwich, successfully defending his thesis in November 2011. Amit’s current interests lie in the computational modelling of cohesive powder flows. Empirical models are limited to cases where powder, equipment and environment-related variables remain decoupled.
References
- 1) van der Meer, E. H., Thorpe, R. B. and Davidson, J. F. (1999): Dimensionless groups for practicable similarity of circulating Fluidised beds, Chemical Engineering Science, 54, pp.5369–5376.
- 2) Zigan, S., Thorpe, R. B., Tuzun, U., Enstad, G., and Battistin, F. (2008): Theoretical and experimental testing of a scaling rule for air current segregation of alumina powder in cylindrical silos, Powder Technology, 183 1 pp.133–145.
- 3) Mograbia, E. and Bar-Ziv, E. (2005): Dynamics of a spherical particle in mixed convection flow field, Aerosol Science, 36, pp.387–409.
- 4) Mitali, D., Meikap, B. C. and Saha, R. K. (2008): Characteristics of axial and radial segregation of single and mixed particle system based on terminal settling velocity in the riser of a circulating fluidized bed, Chemical Engineering Journal, 145, pp.32–43.
- 5) Zhiyao, S., Tingting, W., Fumin, W. and Ruijie, L. (2008): A simple formula for predicting settling velocity of sediment particles, Water Science and Engineering, 1, pp.37–43.
- 6) Hazzab, A., Terfous, A. and Ghenaim, A. (2008): Measurement and modelling of the settling velocity of isometric particles, Powder Technology, 184, pp.105–113.
- 7) Turton, R. and Levenspiel, O. (1986): A short note on the drag correlation for spheres, Powder Technology, 47, 1, pp.83–86.

;%0A%09%09%09newWindow.document.open();%0A%09%09%09newWindow.document.write('<img src=%22./Graphics/30_2013026_10.jpg%22>');%0A%09%09%09newWindow.document.close();%0A%09%09)
;%0A%09%09%09newWindow.document.open();%0A%09%09%09newWindow.document.write('<img src=%22./Graphics/30_2013026_11.jpg%22>');%0A%09%09%09newWindow.document.close();%0A%09%09)