2. Classification of filter and collection behaviour
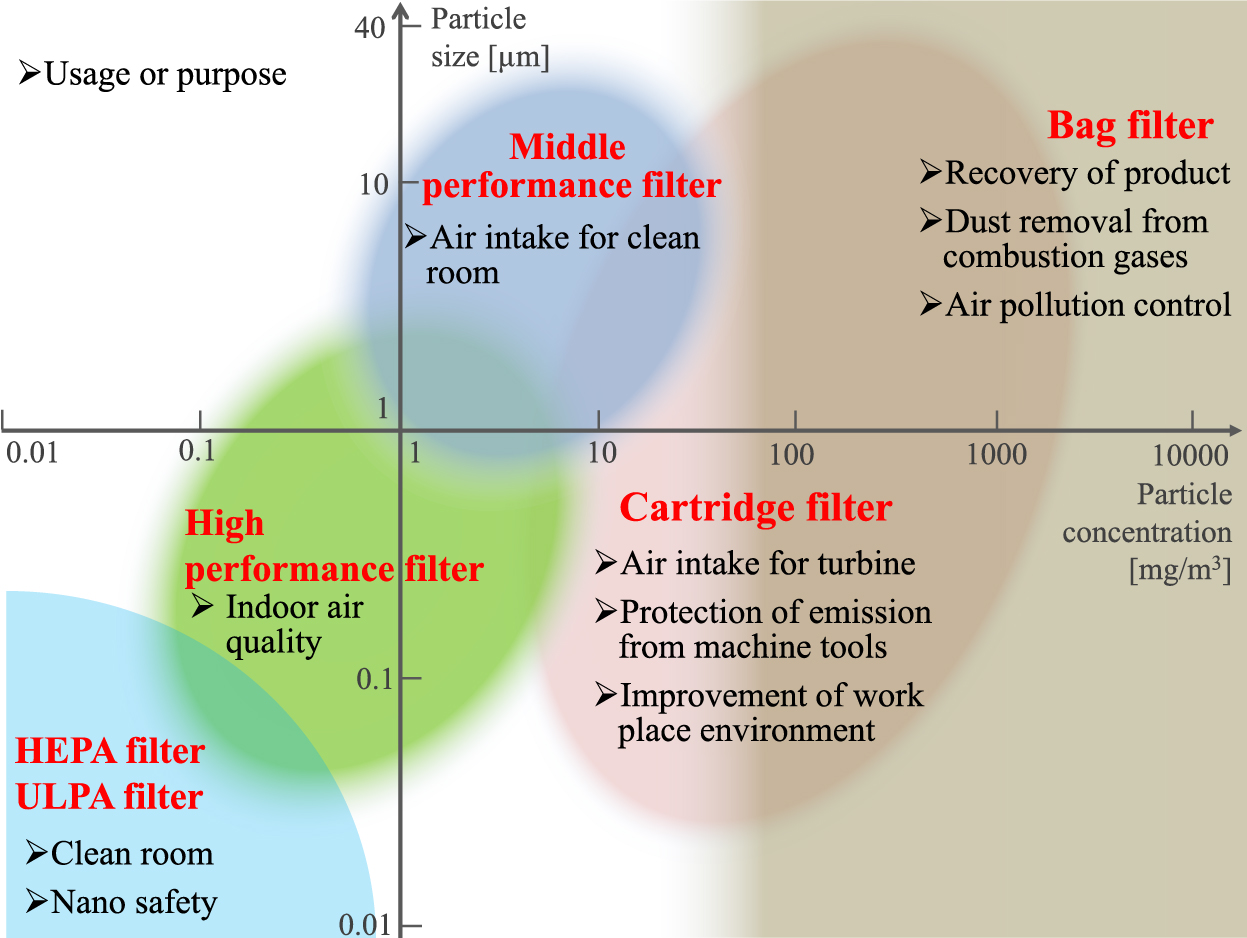
Fig. 1 shows a rough sketch of covering area of those filters. As seen from the figure, the covering area of filters ranges broad in both particle size and concentration, i.e., particle size ranges from order of several ten micron meters to nano meters and particle concentration from more than several dozen g/m3 to several particles/m3 or less. In the figure, applicable area of each filter is shown by different colors and main usages or purposes of each filter are also written in individual area.
The area of air filters locates at lower concentration range. Covering particle size and concentration range of air filter depends on the filter performance, i.e., middle efficiency filter covers larger size and high particle concentration area, high efficiency filter locates at the middle, and high efficiency particulate air (HEPA) filter and Ultra low Penetration air (ULPA) filter, locate very fine size and low concentration area.
Most important feature of air filters is that they collect particles inside the medium. Once filter becomes dust loaded, especially for the case of solid particles, they stay and accumulate on the fiber. As a result, pressure drop across the filter rises with filtration time and particles accumulated inside the filter is too hard to remove them, i.e., regeneration of filter is extremely hard and thus air filter is usually discarded. Hence to increase the holding capacity of filter is an important issue. Collection of very fine particle like nano-size particle is another important issue for them.
Bag filter locates at the highest dust concentration range as high as ten g/m3 or more, and cover whole particle size range. Cartridge filter is a kind of new type of filter and its coverage area overlaps almost but a little lower concentration compared with bag filter. Different from air filters, they are used at high particle concentration area, especially to recover powder products from industrial processes to suppress particulate emission of flue gas. Of course initial particle collection by a fresh filter takes place inside the filter, but it soon shifts to surface collection. Captured particles form a dust layer and it plays the actual collection medium, which collect particles almost perfectly regardless of particle size. Since dust layer becomes thicker with time and increases the flow resistance, it has to be removed occasionally to maintain continual operation. This also requires the filter medium to have sufficient mechanical strength against pressure drop.
Although two types of bag filter such as nonwoven and woven bag filters have been used for dust collection, nonwoven type bag filter is popularly used so that it increases practical importance now. Hence, discussion about woven type bag filter is eliminated in this article.
Table 1 compares the indices of 3 typical filters. They are different in many items like fiber size, thickness, packing density and etc. But they are still similar in using independent fibers to collect particles. Hence, they can be regarded as “air filters”.
Table 1
Comparison of indices of filters.
| Item |
HEPA filter |
Cartridge filter |
Nonwoven bag filter |
| Fiber material |
Glass, polymer |
Polymer |
Polymer |
| Fiber length |
Short |
Long (filament) |
Short, long |
| Fiber size |
Fine (< 2 μm) |
Coarse (10~20 μm) |
Coarse (10~20 μm) |
| Thickness |
Thin (< 0.2 mm) |
Middle (0.4~0.7 mm) |
Thick (> 1 mm) |
| Packing density |
Low (< 0.15) |
High (> 0.25) |
High (> 0.25) |
| Fiber mass per area |
Low (< 100 g/m2) |
Middle (100~300 g/m2) |
High (300~900 g/m2) |
| Process |
Paper making |
Thermal-compression |
Needle punching |
| Shape |
Sheet (pleated) |
Sheet (pleated) |
Cylinder, envelop |
| Principal mechanism of particle collection |
Depth filtration |
Surface filtration |
Surface filtration |
| Re-generation |
Non cleanable, discard |
Cleanable, Re-use |
Cleanable, Re-use |
If a fresh air filter is operated for a long time, its collection behavior changes to 3 stages with time as,
Stage 1: Particles are collected by any fibers in the filter (inner filtration I). Rigorously, this stage is the period until first particle is collected but in practice, it is regarded as the period when pressure drop and/or collection efficiency of the filter stay almost the same.
Stage 2: Particles are collected by both fresh and dust loaded fibers in the filter (inner filtration). In this stage, gas flow pattern near the dust loaded fiber changes due to the change of apparent fiber shape and thus filter collection efficiency and pressure drop increase rapidly.
This stage can be defined as the period between the starting time of pressure drop and filter efficiency increase, to the time before clogging of the filter.
Stage 3; Particles are collected on the filter surface and forms porous dust cake, pore size of which is about same size with incoming particles (surface filtration). In this stage, particles arrived to the filter are collected by the dust cake almost perfectly regardless of particle size and pressure drop increases linearly.
Air filters used at Stages 1 and 2 are middle and high performance filters, and HEPA and ULPA filters. Main purpose of the usage of air filter, especially HEPA and ULPA filter, is to make clean air into much cleaner air. To achieve this, it uses fine fibers to enhance fine particle collection. Although it can use for a long time because of low inlet particle concentration, it cannot use no longer than the holding capacity of the filter, which is unknown but does not exceed its void. Hence to increase the holding capacity is one of important subjects for air filter. Nano-size particle removal is another important issue for air filter, too.
Cartridge and bag filters are used at higher dust concentration. Important issue for them is how to reduce the amount of emission accompanying to cleaning process of dust cake from filter surface.
By the injection of cleaning air, most dust cake is removed to the dirty side of filter but small amount of dust is emitted from the clean side of the filter, by the back flow of cleaning air and dirty gas because almost no dust remains on and in the filter, i.e., emitted amount strongly depends on the collection performance of the filter itself. Furthermore some dust remains and forms firm deposit in the filter. Finally it effects on the life time of the filter.
2.1 Particle collection at Stage 1
This stage can be defined as the period when particle collection takes place on a clean fiber, i.e., no particle is collected on the fiber. Hence strictly speaking, this situation holds only at the point of the usage of the filter, but practically it is considered as the time duration no significant changes in filter efficiency and pressure drop are raised due to captured particles in the filter.
Capturing dynamics of particles is the basic of air filtration and thus it has been investigated from various view point. Hence many books and reviews have been published (Fuchs N.A., 1964; Davies C.N., 1966; Yeh H.- C. and Liu B.Y.H., 1974a, b; Kirsch A.A. and Stechkina I.B., 1978; Brown R.C., 1993; Friedlander S.K., 1977, 2000; Hinds W.C., 1999).
2.1.1 Filter efficiency E and single fiber collection efficiency η
When a fresh air filter is composed of same size circular fibers and they are arranged perpendicular to the mean gas flow and are packed uniformly, filter efficiency is expressed by Eqn. (1) (Davies C.N., 1953)
|
E
=
1
-
exp
(
-
4
π
α
1
-
α
L
d
f
η
)
| (1) |
In Eqn. (1), parameters other than η are related to filter itself. Hence, filter efficiency E can be estimated only by knowing the value of η for given filtration condition.
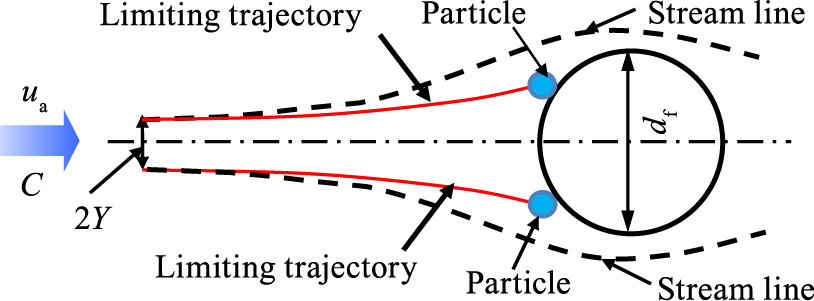
Single fiber collection efficiency η is defined as the mass ratio between particles captured on the fiber and total income particles in the projection area of the fiber in a unit time. Hence when the limiting particle trajectory is uniquely determined by solving the motion equation of particle such as collection by inertia, interception and gravity and so on, η is determined by Eqn. (2) by finding the inlet height of limiting trajectories, shown in Fig. 2.
|
η
=
(
C
u
a
·
2
Y
)
/
(
C
u
a
d
f
)
=
Y
/
(
d
f
/
2
)
| (2) |
ua in Eqn. (2) is the approaching velocity of particle to the fiber and is 1/(1 − α) times of filtration velocity u.
For the case of diffusion, deposition rate is calculated by knowing the concentration profile of particle near the fiber surface by solving convective diffusion equation or Langevin equation.
From the previous studies, it is known that single fiber collection efficiency is a function of following dimensionless parameters.
|
Reynolds number:
R
e
=
ρ
g
d
f
u
μ
| (3) |
|
Stokes number:
S
t
k
=
C
C
ρ
p
d
p
2
u
9
μ
d
f
| (4) |
|
Peclet number:
P
e
=
d
f
u
D
BM
| (5) |
|
Gravitational parameter:
G
=
ρ
p
d
p
2
g
18
μ
u
| (6) |
|
Interception parameter:
R
=
d
p
d
f
| (7) |
|
η
=
η
(
R
e
,
S
t
k
,
P
e
,
G
,
R
)
| (8) |
Eqns. (3) to (7) express the degree of influence of flow field near the fiber, particle inertia, diffusion, gravity and interception, respectively.
2.2 Single fiber collection efficiency by mechanical effect
2.2.1 Inertia and inertia-interception ηI, ηIR
Collection efficiency is calculated from limiting trajectory for a given set of Stk, R and Re. Early studies were performed for the impingement of mass particle to the fiber at potential and viscous flow fields (Landahl H.D. and Hermann R.G., 1949; Davies C.N. and Peetz C.V., 1956; Yoshioka, N. 1967a).
Davies C.N., (1953) also gave an approximate expression for Re = 0.2 as,
|
η
IR
=
0.16
{
R
+
(
0.25
+
0.5
R
)
S
t
k
-
0.0263
R
·
S
t
k
}
| (9) |
However, flow field changes significantly by neighboring fibers, i.e., fiber packing density α (Kuwabara S., 1959; Happle, J., 1959). Fuchs N.A. and Stechikina I.B. (1963) first used Kuwabara flow model. Then flow calculation based on so-called “Kuwabara cell” became popular. Brown R.C. (1984, 1986) solved a flow through fibers in parallel by Fourie series analysis at low Re. Yoshioka N. (1969a), Emi H. et al. (1973, 1977) discussed the effect of α on ηIR in broad Re region.
Fig. 3 compares calculated inertia-interception efficiencies ηIR for R = 0.1 but different α such as 0 and 0.1. Clearly seen from the figure, difference of ηIR at small Re is large but decreases with Re.
Wong J.B. et al. (1956) measured collection efficiency of 0.4–1.3 μm sulfuric acid particle by a glass mat and compared with their theory. Friedlander S.K. (1957, 1958) correlated η with Stk, R and Re. Effect of fiber diameter, packing density and etc. on ηIR was discussed by Iinoya K. et al. (1965, 1970), Kimura N. and Iinoya K. (1965), Kimura N. (1969b), Makino K. and Iinoya K. (1969b), Lee K.W. and Liu B.Y.H. (1981). Yoshioka N. et al, (1967a, c, 1969a), Nguyen X. and Beeckmans J.M. (1975), Emi H. et al. (1973, 1977) calculated ηIR for various Stk, R and Re, and compared their experimental efficiency in Fig. 4.

Clearly seen form the figure, increasing trend of ηIR looks little unusual at small and large Stk, i.e., ηIR is large for large R but at intermediate Stk, ηIR for small R is larger than that for larger Stk. This unusual change is explained by considering that Stk is the product of Re and R2 as shown in the following equation, i.e., changing Stk in the experiment also changes the flow, i.e., Re simultaneously. Significant contribution of each parameter appears at different and thus this is the reason of the inversion in ηIR in intermediate Stk.
|
S
t
k
=
C
c
9
ρ
p
ρ
g
d
f
u
ρ
g
μ
(
d
p
d
g
)
2
=
K
·
R
e
·
R
2
| (10) |
When particles do not have inertia, they move along with gas stream and are collected on a fiber by interception. Collection efficiency in this situation was solved analytically by Langmuir I. (1942) for viscous flow (Lamb H., 1932) and potential flow, given by Eqns. (11) and (13), respectively.
Viscous flow Re = 0
|
η
R
=
1
2
h
[
2
(
1
+
R
)
ln
(
1
+
R
)
+
1
1
+
R
-
(
1
+
R
)
]
| (11) |
Here, h is hydrodynamic factor for an isolated fiber and is expressive as,
|
h
L
=
2
-
ln
R
e
(
Lamb
’
s factor
)
| (12) |
Potential flow Re = ∞
|
η
R
=
(
1
+
R
)
-
1
1
+
R
| (13) |
Stechkina I.B. and Fuchs N.A. (1966) obtained Eqn. (11) by using Kuwabara’s hydrodynamic factor hK in a group of parallel fibers (Kuwabara S., 1959).
|
h
K
=
-
1
2
ln
α
+
α
-
α
2
/
4
-
3
/
4
| (14) |
Yoshioka N. and Emi, H. (1967b) also derived an approximate expression of Eqn. (11) as,
|
η
R
≅
1.25
2
h
R
1.82
| (15) |
Lee K.W. and Liu B.Y.H. (1981) also derived a similar expression as
Kimura and Iinoya (1965) obtained Eqn. (17) from velocity distribution in the boundary layer on a cylinder.
|
η
R
≅
1
3
R
e
1
/
2
R
2
| (17) |
Kirsh A.A. et al. (1975), Brown R.C. and Wake D. (1991) and Hubbard J.A. et al. (2012) studied interception efficiency at different conditions. For the case of interception-gravity, efficiency also depends on flow direction, Yoshioka et al. (1972) obtained analytical expressions by taking account of orientation of filter and flow as shown below,
Horizontal flow (filter is placed vertical)
|
η
GR
=
1
+
R
1
+
G
2
1
+
(
R
2
/
h
G
)
2
×
{
R
2
[
1
/
(
1
+
R
)
2
-
1
+
ln
(
1
+
R
)
2
]
2
h
2
G
}
+
G
| (18) |
Vertical down flow
|
η
GR
=
1
+
R
1
+
G
{
1
2
h
[
1
(
1
+
R
)
2
-
1
+
ln
(
1
+
R
)
2
]
+
G
}
| (19) |
Potential flow Re = ∞
Horizontal flow
|
η
GR
=
(
1
+
R
)
4
G
2
+
[
(
1
+
R
)
2
-
1
]
2
(
1
+
R
)
1
+
G
2
| (20) |
Vertical down flow
|
η
GR
=
1
1
+
G
[
G
(
1
+
R
)
-
1
1
+
R
+
(
1
+
R
)
]
| (21) |
When G = 0, Eqns. (18) and (19) become Eqn. (11) and Eqns. (20) and (21) become Eqn. (13). Thomas J.W. et al. (1971) also discussed the effect of gravity.
2.2.3 Diffusion, diffusion-interception ηD, ηDR
Particle collection by diffusion and diffusion-interception effect is important for very fine particles, especially nano-size particles.
For mass point particles, most of analytical expressions obtained for viscous flow are proportion to Pe−2/3 as (Langmuir I., 1942; Friedlander S.K., 1957; Natanson G.L., 1957b; Stechkina I.B. and Fuchs N.A., 1966; Kirsch A.A. and Fuchs N.A., 1968; Lee K.W. and Liu B.Y.H., 1981).
|
η
D
=
A
h
1
/
3
P
e
-
2
/
3
| (22) |
(Langmuir, Friedlander, Natanson, Lee and Liu)
|
η
D
=
2.9
h
K
1
/
3
P
e
-
2
/
3
+
0.62
P
e
-
1
| (23) |
(Stechkina and Fuchs)
Natanson derived the following expression for potential flow (Natanson G. L., 1957b)
|
η
D
=
2.26
P
e
-
1
/
2
| (24) |
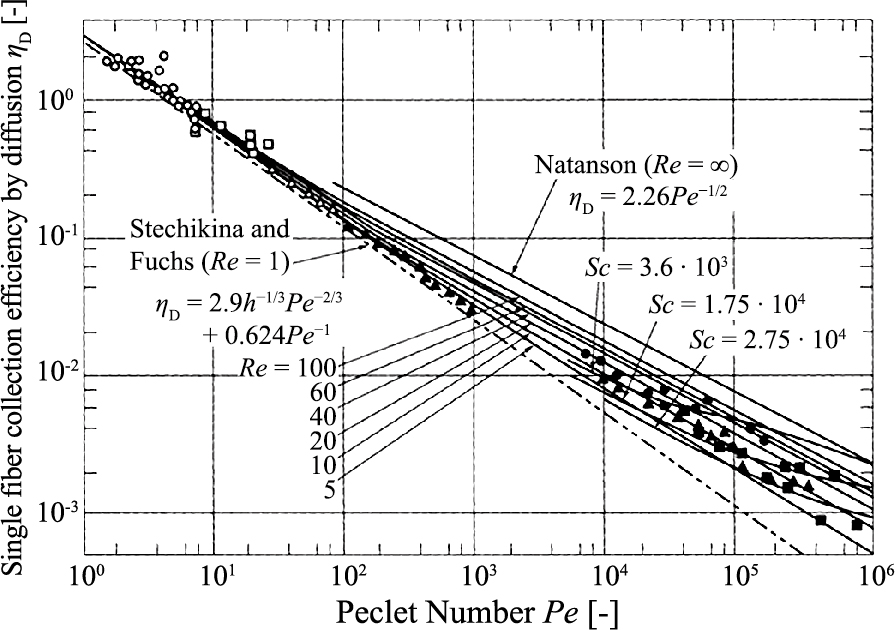
Emi H. et al. (1982a) numerically calculated ηD at different Re and Sc shown in Fig. 5. It is remarkable that exponent of Pe changes from −2/3 to −1/2 as Re increases from 0 to infinity, which coincides with exponents in Eqns. (21) and (23). Ingham D.B., (1981) also obtained similar result.
Collection efficiency for R ≠ 0, ηDR is very different from ηD (Lee K.W. and Liu B.Y.H., 1982; Kanaoka C., 1988). Fig. 6 shows the calculated ηDR for various R (Kanaoka C., 1988). As seen from the figure, ηDR increases with decreasing Pe and becomes constant for each R at large Pe. Pich J. (1966), Smutek M. (1972), Kirsh A.A. et al. (1973), Van Osdell D. et al. (1990), Shapiro M. et al. (1991) discussed the effect of gas slip near a fiber.
Dahneke B. (1971) suggested the possibility of thermal rebound of nanoparticles. Wang H. and Kasper G. (1991) have developed a theory predicting a thermal rebound of particles smaller than 10 nm, it has been examined theoretically and experimentally.
Theoretically, it has been discussed from coefficient of restitution and adhesion energy (Sato S. et al., 2007; Mouret G. et al., 2011) and Givehchi R. and Tan Z. (2014) discussed the effect of capillary force and existence of a thermal rebound but it has not been clearly demonstrated the existence of a thermal rebound.
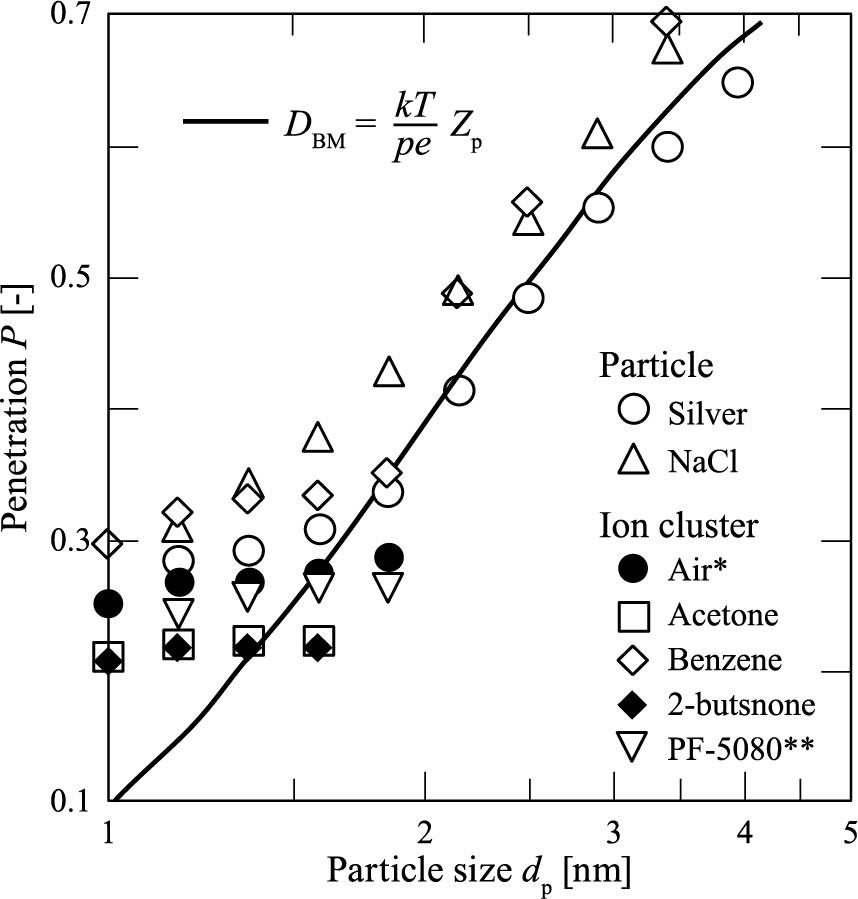
Experimentally it has been examined by various combinations of particles (material and size), collection media (material, fiber diameter) and operation conditions many researchers such as Scheibel H.G. and Porstendörfer J. (1984), Van Osdell D.W. et al. (1990), Otani Y. et al. (1995), Skaptsov A.S. et al. (1996), Ichitsubo H. et al. (1996), Wang H.-C. (1996), Alonso et al. (1997), Kim C.S. et al. (2006), Kim S.C. et al. (2007), Japuntich D.A. et al. (2007), Steffens J. and Coury J.R. (2007a, b), Wang J. et al. (2007), Heim M. et al. (2005, 2010), Podgórski A. et al. (2006), Huang S. et al. (2007), Rengasamy S. et al. (2008), Shin W.G. et al. (2008), Golanski L. et al. (2009), Van Gulijk C. et al. (2009), Yamada S. et al. (2011). Reduction of efficiency was observed below 2 nm by only a few experiments. Fig. 7 shows the experimental penetration by Ichitsubo et al. (1996). Givehchi R. and Tan Z. (2014, 2015) precisely reviewed the thermal rebound.
In the actual filtration, every mechanism contributes to the capture of particle simultaneously. Hence collection efficiency taken account of all mechanisms has to be used for the estimation of actual filtration. Emi et al. estimated ηIDGR for an isolated fiber by taking account of the contribution of individual efficiency at given filtration condition.
Fig. 8(a) and (b) shows the predicted contour charts for fiber diameter of 1 and 10 μm (Emi H. et al., 1973). In the figure, each line is the line of equal collection efficiency and efficiency of contour line gets small from outside to inside. Furthermore, ηIDGR has a minimum efficiency ηmin against filtration velocity u and particle size, dp by keeping dp and u constant, respectively. ηmin appears at the transition region of two collection mechanisms and shifts to higher u and lower dp, shown by the dashed arrow lines in both figures.
2.3 Filter efficiency
2.3.1. Particle size at minimum collection efficiency (MPPS)
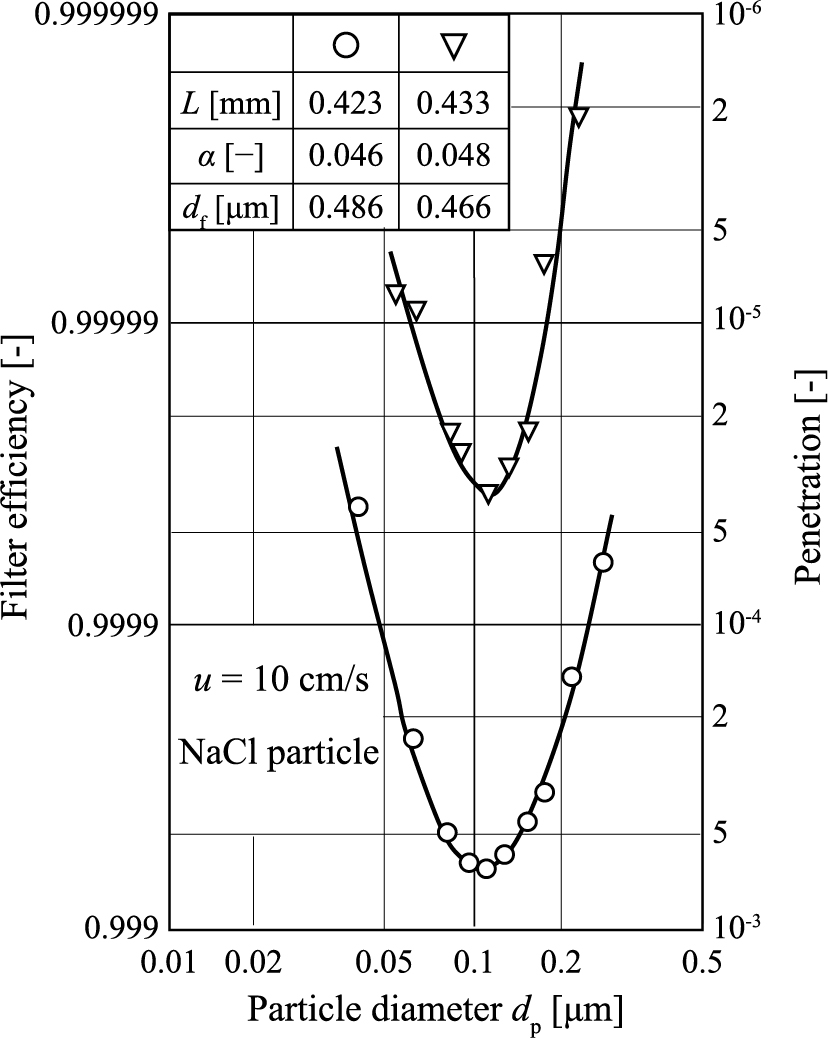
As described above, η has minimum at certain filtration condition. This is especially important for high performance air filter like HEPA and ULPA filter. Fig. 9 shows filter efficiency of two HEPA filters against particle size (Emi H. and Kanaoka C. 1981; Emi H. et al., 1982b). In the figure, collection efficiency is higher than 99.9 % at any particle size and minimum efficiency appears around 0.1 μm and both penetrations differs more than an order of magnitude. Particle size at minimum collection efficiency (MPPS) is an important indicator of air filter since single fiber efficiency at MPPS is the lowest and thus the filter efficiency is higher than that at MPPS. Fig. 10 shows behaviour of collection efficiency near MPPS of HEPA and fibrous mat filters (Emi H. et al., 1982b) and Fig. 11 is an experimental correlation of MPPS with filtration velocity and fiber diameter. As seen from the figures, MPPS decreases as filtration velocity and fiber diameter decrease. Stechkina I.B et al. (1969), Wake D. (1989), Dhaniyala S. and Liu B.Y.H. (1999a, b), Podgórski A. et al. (2006) reported MPPS by different type of filters and particles.
Nanoparticle collection is an important issue. Hunt B. et al. (2014) calculated a single fiber collection efficiency of nanoparticles based on a mean first-passage time method. Wang J. et al. (2008a, b) demonstrated the superiority of a single layer nano-fiber filter against ordinary filter below 100 nm because of slip flow. Gopal R. et al.(2006), Yoon K. et al.(2006), Yun K.M. et al.(2007), Ma H. et al. (2010), Podgorski. A. et al. (2011), Kuo Y.Y. et al. (2014), Kao T.-H. et al. (2016) tested by spunbond nano filters. Bao L. et al. (2015) compared the penetrations of nanofiber filter and HEPA filters shown in Fig. 12. Their MPPS is also plotted in Fig. 11 appearing smaller than ordinary filter. It decreases with filtration velocity and is almost parallel with previous result.
2.4 Effects of filter structure, particle shape, fiber shape on filter performance
In actual filtration, filter and particles are very different from ideal. Effects of fiber size distribution were studied by Kirsh A.A. et al. (1975, 1978), Brown R.C. et al. (1987), Brown R.C. and Thorpe A. (2001). Concerning the effect of fiber orientation and packing was done by Overcamp T.J. (1985), Otani Y. et al. (1998), Bao L. et al. (1998), Dhaniyala S. and Liu B.Y.H. (2001), Endo Y. et al. (2001), Steffens J. and Coury J.R. (2007b), Mouret G. et al. (2009), Podgorski A. et al. (2009, 2011), Hunag S.-H. et al. (2010), Fotovati E. et al. (2010), Yamada S. et al. (2011), Eryu K. et al. (2011), Soltani P. et al. (2014), Shou D. et al. (2015), Kanaoka C. et al. (1984a, 2016, 2017).
Fig. 13 shows the effect of neighboring fiber on η in a parallel arrayed model filter by Kanaoka C. et al. (1984a). η for constant HT is higher than that for constant HL, suggesting HT affects efficiency more than longitudinal interval.
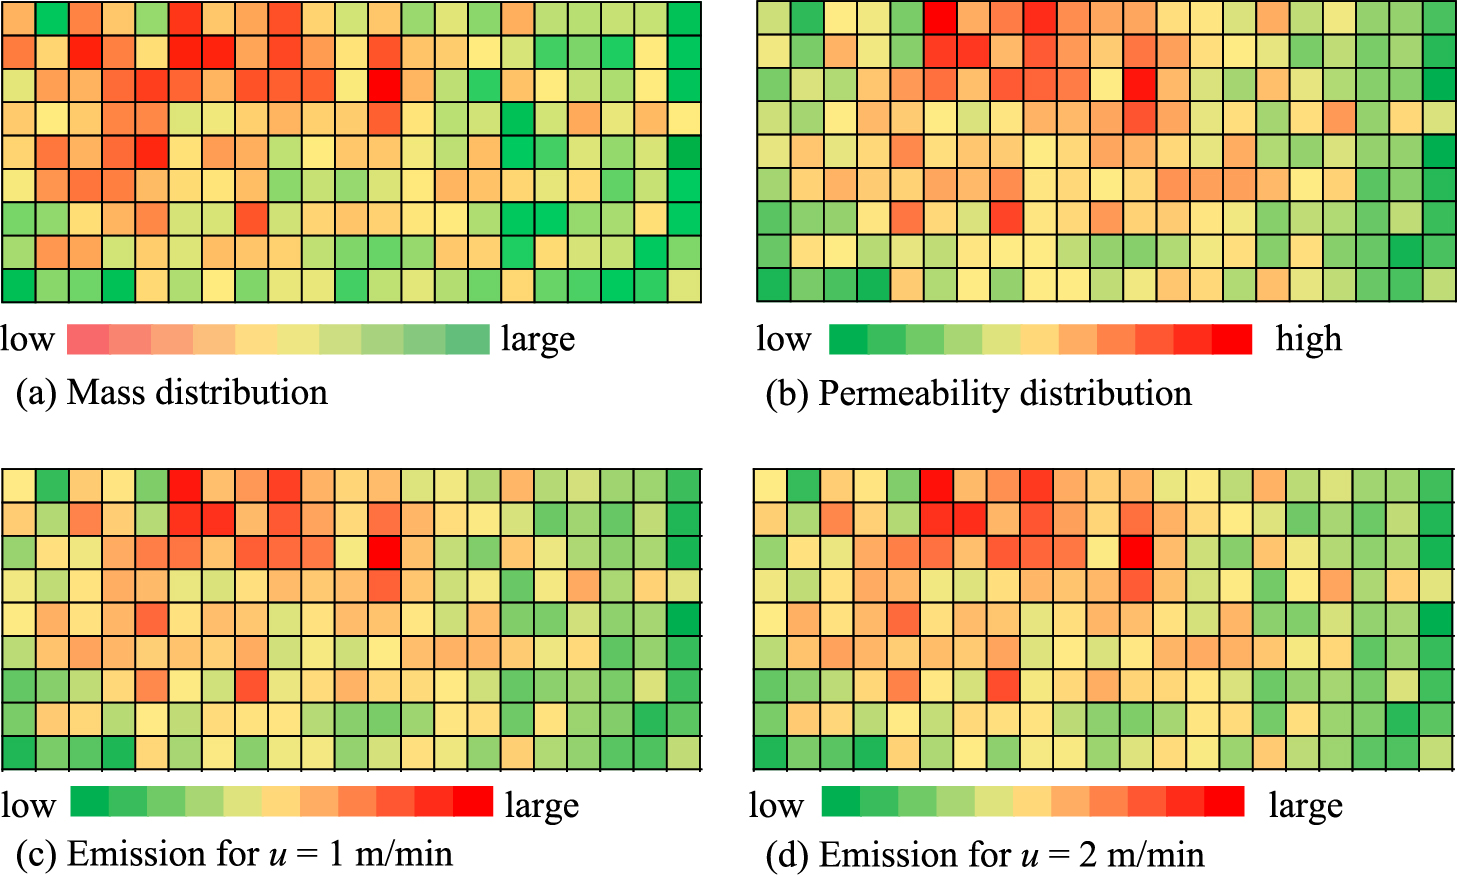
Fig. 14 shows the experimental distribution of fiber mass, permeability and particle emission at filtration velocities of 1 and 2 m/min of PTFE filter media with 63 cm × 147 cm. They were measured 7 cm × 7 cm cells. In the figure (a), cell with reddish color indicates smaller fiber mass and greenish larger mass. Contrarily reddish color in figures (b), (c) and (d) indicates high or large and greenish low or small. Their color distribution coincides with each other. This means that smaller is the fiber mass, higher and larger are permeability and particle emission from the filter.
On the influence of fiber shape, Kimura N. and Iinoya K.(1969a), Inagaki M. et al. (2001), Wang W. et al. (2012), Wang K. and Zhao H. (2015), Zhu C. et al.(2000). Boskovic L. et al. (2005, 2007, 2008), Jin X. et al. (2017) investigated for various shapes of fibers.
2.5 Single fiber collection efficiency by electrostatic effect
Collection performance by electrostatic effects depends on the charging states of particle and fiber and existence of external electric field.
For no external electric field, collection of charged particles by charged fibers was studied by Kraemer H.F. and Johnstone H.F. (1955), Yang S. and Lee, G.W.M.(2005), and charged particles by uncharged fiber by Natanson G.L.(1957a), Lundgren D.A. and Whitby K.T. (1965), Yoshioka N. et al. (1968), Takahashi T. and Kanagawa A. (1975).
For the case of existence of electric field, collection of uncharged particles was studied by Zebel G. (1965), Iinoya K. et al. (1965), Kirsch A.A. (1972), Takahashi T. and Kanagawa A. (1978), Makino K. and Iinoya K. (1968, 1969a), and charged particles by Zebel G. (1965), Takahashi T. and Kanagawa A. (1978), Zhao Z.-M. (1991), Pnueli D. et al., (2000) and Sanchez A.L. et al. (2013).
After Turnhout J.V. (1976) invented an manufacturing method of electret filter, electret fibrous filter has been used popularly as a high performance air filter. Investigation about its collection mechanisms has been carried out from various view points such as collection mechanisms by Emi H. et al. (1987), Pich J. et al. (1987), Romay F.J. et al (1998), filtration performance of various particles by Baumgartner H.-P. and Löffler F. (1986), Kanaoka C. et al., (1987), Otani Y. et al. (1992, 1993), Kim J. et al. (2009), Chazelet S. et al. (2011), effect of charging process and collection performance by Nifuku M., et al. (2001), Kawabe M. et al. (2009), Choi H.-J. et al. (2015), Kilic A. et al. (2015). Time change of electret fiber was investigated by Kanaoka C. et al. (1984b), Lee M., et al. (2002), Choi H.-J. et al. (2014, 2015) and electrification method and process was by Kawabe M. et al. (2009), Kilic A. et al. (2015).
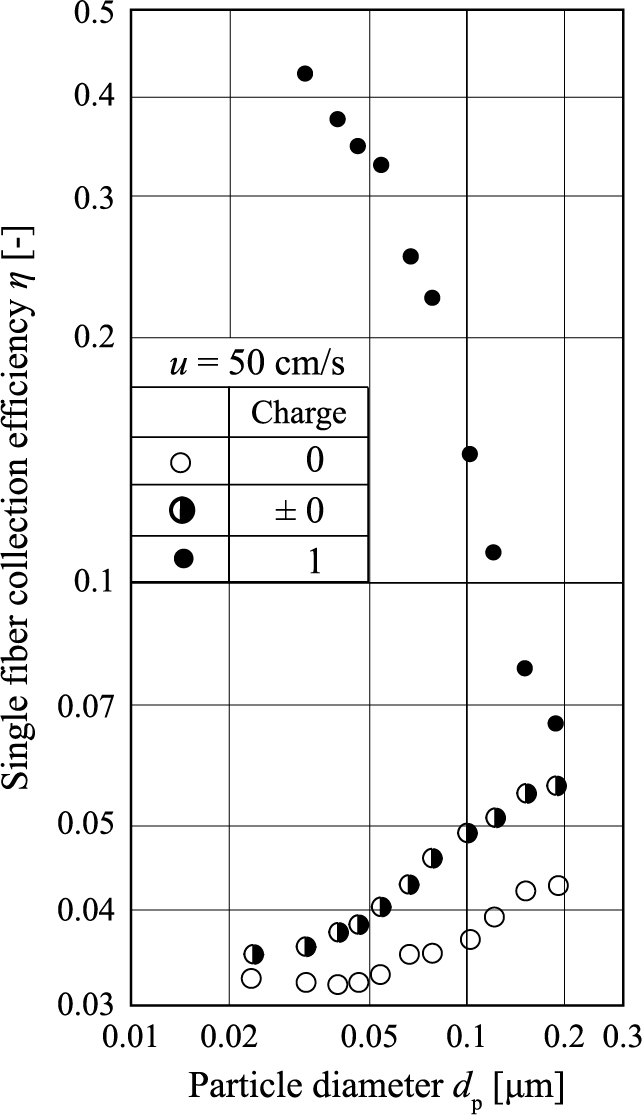
Fig. 15 shows η at different charging states by a rectangular electret fiber (Emi H. et al., 1987). As seen from the figure, since charged particle is captured by Coulomb force, η is very high at small particle and decreases with particle size becomes large. For non-charged and Boltzmann equilibrium particles, they are collected by induced force so that η is low at small size and increases with particle size.
3. Particle collection at Stage 2
Once particle is captured, gas flow in the vicinity of the fiber changes and thus filter performance such as filter efficiency and pressure drop changes with time.
This type of particle collection is utilized mainly in the field of air filtration such as for the creation of highly purified space, ventilation of air and intake air cleaning for internal combustion air and so on.
For the case of collection of solid particles by a fibrous filter, Yoshioka N. et al. (1969b), Kimura N. et al. (1969b, c, 1970, 1985, 1989), Davies C.N. (1970), Kanaoka C. et al. (1980a), Hinds W.C. and Kadrichu N.P. (1997), Bémer D. and Callé S. (2000), Sakano T. et al. (2000), Wang Q. et al. (2016), Hasolli N. et al. (2013a, b) measured evolution of filter performance and analyzed the phenomena based on the measurements.
Yoshioka N. et al. (1969b) applied analysis method of clarifying filtration and obtained analytical expressions for filter efficiency and dust load as,
|
E
=
1
-
exp
(
-
λ
A
C
in
u
t
)
exp
(
-
λ
A
C
in
u
t
)
+
exp
(
A
L
)
-
1
| (25) |
|
m
=
-
1
A
exp
(
-
λ
A
C
in
u
t
)
exp
(
-
λ
A
C
in
u
t
)
+
exp
(
A
L
)
-
1
| (26) |
|
A
=
4
α
η
m
π
(
1
-
α
)
d
f
| (27) |
In the derivation, they assumed collection efficiency of dust loaded fiber ηm as,
|
η
m
=
η
0
(
1
+
λ
m
)
| (28) |
Their experimental result was explained by Eqns. (25) and (26) assuming λ = 5 m3/kg.
Clogging of nano-size particles in HEPA filter was carried out concerning effect of gas slip (Leung W.W.-F. and Hung C.-H. 2008, 2009), particle distribution (Brourrous S. et al., 2014), structure and loading capacity (Contal P. et al., 2004; Kim S.C. et al., 2009), liquid and humidity, hygroscopicity (Payet S. et al.,1992; Contal P. et al., 2004; Gupta A. et al., 1993; Joubert A. et al., 2010; Agranovski I.E. and Shapiro M., 2001) and etc.
Measurements for the case of electret filter were carried out by Baumgartner H.-P. and Löffler F. (1986 and Löffler F. (1987), Brown R.C. et al. (1988), Hiragi S. et al. (1990b), Stenhouse J.I.T. et al. (1992), Walsh D.C. and Stenhouse J.I.T. (1996, 1997a, b), Janssen L.L. et al. (2003), Ji J.H. et al. (2003), Yang S. et al. (2005), Yang S. and Lee, G.W.M. (2005), Huang B. et al. (2006), Yang S. et al. (2007), Ardkapan S.R. et al. (2014), Xiao H. et al. (2014). They found a unique collection behavior relating to deterioration of electrostatic effect with dust load and recovery of collection efficiency afterwards, and discussed influences by various parameters.
At very initial stage, collected particles form dendritic deposit on a fiber because of hindering effect. Accumulation of solid particles on a fiber was observed by Billings C.E. (1966), Bhutra S. and Payatakes A.C. (1979), Kanaoka C. et al. (1982) observed dendritic growth, Myojo T. et al. (1984), Kanaoka C. et al. (1982, 1986, 1990), Hiragi S. et al. (1990a, b), Song C.B. et al. (2006), Kasper G. et al. (2010), Müller T.K. et al. (2014a, b) observed and discussed the effect of re-entrainment of particles.
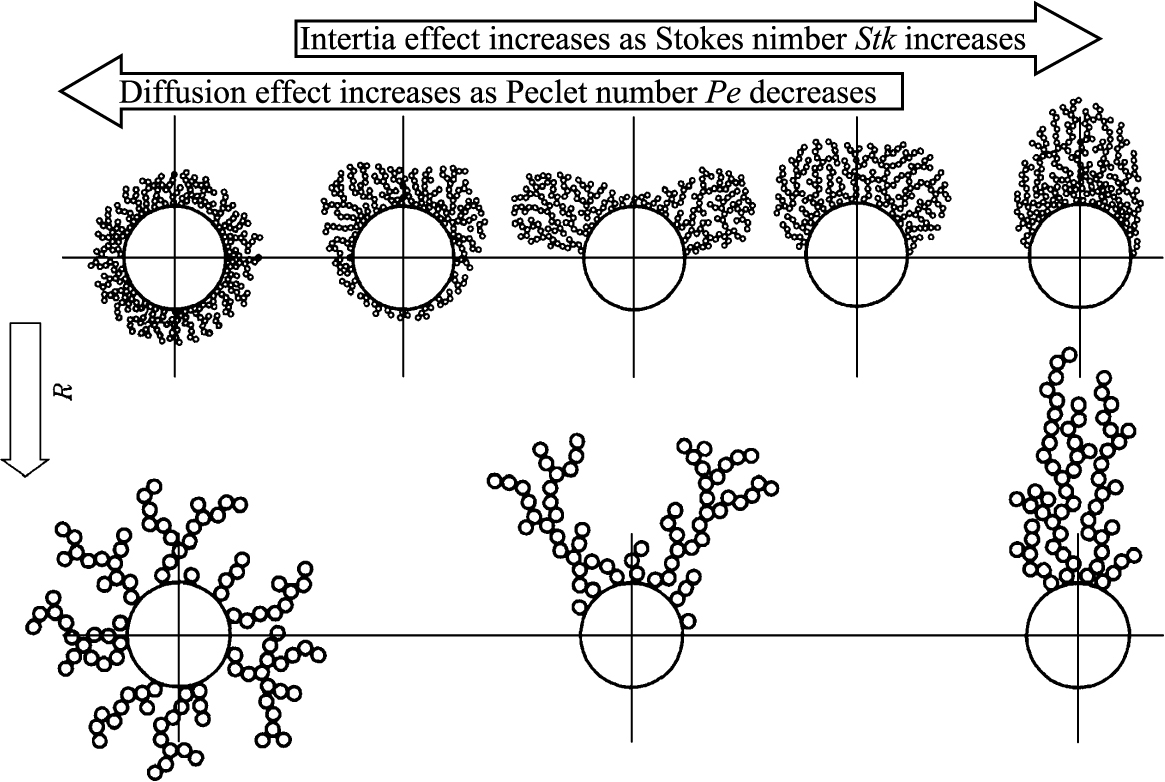
Fig. 16 shows the time change of accumulation of 1 μm particles collected on a 10 μm cylindrical tungsten wire. As seen from the figure, amount of collected particles increases with time so rapidly. Although particles are collected by very strong inertia effect such as Stk = 3.5 and then particles accumulated on the front surface, morphology of particle deposit changes with filtration condition as shown in Fig. 17. In the figure, deposition pattern at Pe = 0 and Stk = ∞ is drawn from theoretical consideration such as distributed uniformly around the fiber for Pe = 0 and sine curve shape in the front side of the fiber for Stk = ∞, respectively.
When particles are captured by inertia and/or interception effect, they accumulate on the front side of the fiber but for the case of diffusion, some of them will be collected in the rear side of the fiber. In general, collected particles form porous accumulates and they become coarser with R.
Payatakes A.C. (1976a, 1977), Payatakes A.C. and Tien C. (1976b), Payatakes A.C. and Gradoń L. (1980), Payatakes A.C. and Okuyama K. (1982) proposed a deterministic model of the formation of chain-like particle agglomerates on a fiber by interception and inertia effects.
Kanaoka C. et al. proposed a stochastic model of the formation of dendrites by interception (1978), inertia (1980b), diffusion (1982, 1983) and electrostatic force (2001). Bahners T. and Schollmeyer (1986), Cai J. and Peterson F. (1989a, b), Wongsri M. et al. (1991), El-shobokshy M.S. et al. (1994), Tanthapanichakoon W. et al. (2003), Sae-lim W. et al. (2006) also simulated the filtration process by different collection mechanism and different fiber property and structure by Monte Carlo simulation method. Schmidt E. (1996) simulated 3D dust structures formation, Karadimos A. and Ocone R. (2003) took into account the effect of change of the flow field by dust loading and develop CFD simulation code, Wang H. et al. (2013) and Przekop R. et al. (2003) used Lattice- Boltzmann two-phase flow model for simulation. Li S.Q. and Marshall J.S. (2007) simulated by DEM based on JKR theory for adhesive elastic contacts, Qian, F. et al. (2013) used CFD–DEM, Dunnett S.J. and Clement C.F. (2006, 2012) used boundary element model (BEM). Kanaoka C. et al. (1978, 1982, 1983) obtained linear expression same as Eqn. (28) from simulation and experiments but value of λ was found as a function of filtration condition as shown in Fig. 18.

Kasper G. et al. (2009) proposed a power law expression for packing density α < 0.04 as,
|
η
m
=
η
0
(
1
+
b
m
c
)
| (29) |
In the above equation, b and c are empirical fit coefficients. The exponent c is on the order of 0.7 ± 0.05 and approaches to 1 for isolated fiber.
Evolution of pressure drop and holding capacity of particles in the filter is practically important. Medjimorec V. et al. (1981), Japuntich D.A. et al. (1994) estimated the drag forces acting on particle dendrites, Hiragi, S. (1990a), Kanaoka C. and Hiragi S. (1990b) proposed a model to predict pressure drop of dust loaded filter based on the observation of dust captured on parallel arrayed model filter at different times. Joubert A. et al. (2011) proposed a model for the pressure drop across HEPA filters during cake filtration in the presence of humidity. Thomas D. et al. (2014) and Bourrous et al. (2016) derived a model of clogging process of nano-size particles based on precise measurement of porosity and thickness of deposit and deposit distribution in the filter as,
|
β
(
x
)
=
m
S
·
k
exp
(
-
k
x
)
ρ
p
{
1
-
exp
(
-
k
x
)
}
| (30) |
Kanaoka C. and Hiragi S. (1990) and Hiragi S. (1990a) proposed to estimate the evolution of pressure drop by a drag theory.
|
F
m
=
C
Dm
d
fm
1
2
ρ
g
u
2
=
C
Dm
C
D
0
·
d
fm
d
f
·
F
0
| (31) |
They determined the evolution of effective fiber diameter dfm and drag coefficient CDm of a fiber by the accumulation of 0.33 μm and 0.8–0.84 μm on a fiber in a parallel arrayed model filter. Then they confirmed it by the experiments using a fan model filter and glass fibrous mat.
By using their proposal, evolution of filter efficiency, pressure drop and dust load distribution for a uniform filter and a gradient filter having packing gradient in flow direction was calculated. Packing density of both filters was assumed to be αf,av = 0.04 for uniform filter and αf(x) = 0.07(x/L) + 0.01) for gradient filter. Fiber diameter and particle size were set the same as Kanaoka et al. (1990). Non-consolidation of loaded dust due to the pressure drop of filter was assumed. Calculation conditions are listed in Table 2.
Table 2
Calculation conditions
| Filter thickness |
L
|
50 mm |
| Fiber diameter |
df
|
30 μm |
| Mean packing density |
αf,av
|
0.04 |
| Particle size |
dp
|
0.84 μm |
| Particle concentration |
Ci
|
100 mg/m3
|
| Filtration velocity |
u
|
50 cm/s |
Fig. 19 shows the calculated evolution of filter efficiency, E and pressure drop, Δ pm of two filters, and loaded mass distributions in Fig. 20.
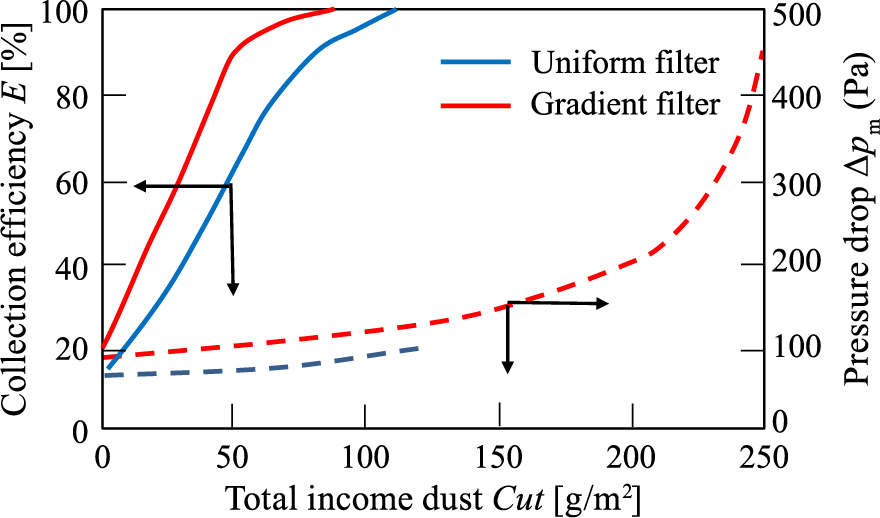

As seen from Fig. 19, E and Δpm of both filters increase with Cut but E and Δ pm of the gradient filter are higher than those of uniform filter from the beginning and reaches 100 % collection efficiency faster. In the figure, pressure drop curve of the uniform filter stops the middle of the graph but that of the gradient filter continues much longer. In this case, gradient filter can operate about 3 times of the uniform filter. This difference is explained by the difference in dust load distribution in the filter, for the case of uniform filter, dust accumulates mainly inlet part, but for the case of gradient filter, maximum load appears at rear part of the filter at beginning and it increases and shifts to front direction with time. Dust holding capacity of the filter can be predicted from distribution curve and expected maximum dust load shown by black and red curves in Fig. 20(b). In this case, holding capacity of the gradient filter is about 3 times larger than the uniform filter. Same change of dust load distribution takes place when fiber has a size distribution in the depth direction. Hence, it can be said that holding capacity and service life time of air filter must be controllable by giving appropriate distribution in fiber packing density and/or size.
4. Particle collection at Stage 3
In this stage, particles are at dust cake formed on the filter media almost perfectly, i.e., forthcoming particles will be collected almost perfectly. Bag and cartridge filtration is the technology to utilize this situation. Bag filter is an important technology in the industrial sector. Hence, practical handbook and books have been published such as Billings C.E. and Wider J. (1970), Leith D. et al. (1978), Donovan R.P. (1985), Turner J.H. et al. (1987a, b), Löffler F. et al. (1988), Mukhopadhyay A. (2009a, b).
4.1 Dust cake formation and related phenomena
As described above, particles are removed perfectly at dust cake. However, the practical bag filtration is the repetition of filtration and cleaning of dust cake. As a result, grade efficiency η(dp) of filter changes as shown in Fig. 21. As seen from the figure, η(dp) is fairly low when the filter is fresh, i.e., never used before, but it becomes 100 % regardless of particle size just before dust cleaning, i.e., filter is covered with dust cake. Furthermore, the filter experienced 5 cleaning operations, η(dp) just after 5 cleanings is much higher than that of fresh filter at any particle size. This means η(dp) just after cleaning operation rises a little by the cleaning because of formation of primary dust layer.

After the cleaning operation, large amount of particles are emitted from the filter. Fig. 22 (Yoneda T., 2001) is an example of the time change of exhausted dust concentration from a pilot scale bag filter system. As seen from the figure dust concentration impulsively jumps up and down more than 2 orders of magnitude from basement concentration just after the injection of cleaning pulse air.

Mori Y. et al. (1979) tested 9 different fabrics (fresh and used for each fabric) with 3 different particles and found pressure drop is expressive by the form of Δp ∞ un, n > 1. Pressure drop and filtration velocity show a hysteresis behavior at same dust load. Leith D.H. et al. (1977a, b) investigated recapturing of removed particles due to the strong back flow phenomenon. Hirota M. et al. (1985, 1987) discussed dust collection from the flowability of dust and Ikeno H. et al. (2009) from pressure drop and filter medium. Koch M. and Krammer G. (2008) discussed the effect of permeability distribution on the filter media characterization.
Yamada M. et al. (1987) estimated the mechanical strength of the dust Layer on bag fabric. Schmidt E. and Löffler F. (1990) observed the cross sectional structure of dust cakes by microscopic examination. Saleem M. et al. (2012) discussed the influence of operating parameters on the cake formation.
Ellenbecker M.J. and Leith D. (1980) obtained the effect of dust retention on pressure drop in a high velocity filter, and Cheng Y.-H. and Tsai C.-J. (1998) investigated factors influencing pressure drop through a dust cake during filtration. Silva C.R.N. et al. (1999) estimated cake/fabric adhesion force from filtration and cleaning measurements.
Fig. 23 shows the detail change of outlet dust concentration after cleaning process at different filtration velocity studied by Yoneda T. (1989) for nonwoven filter and Dennis R. and Klemm H.A. (1979a, b) for woven filter. As seen from the figure, decreasing trends of both filters coincide with each other against time and filtration velocity, i.e., outlet concentration decreases steeply at the beginning and slows down and becomes stable in short time. Furthermore, stabilized concentration is lower as filtration velocity is low, despite of the different weaving and cleaning methods.

Leith D. and Ellenbecker M.J. (1982) measured dust emission characteristics of pulse-jet-cleaned fabric filters. Simon X. et al. (2014) also measured downstream particle puffs emitted during pulse-jet cleaning and investigated the influence of operating conditions and filter surface treatment, Fang C. et al. (2015) studied experimental investigation on particle entrainment behavior near a nozzle in gas–particle coaxial jets.
4.2 Cleaning of dust cake on the filter medium
Cleaning of dust cake is one of the most important processes. During filtration period, filter is pressed toward inside. When high pressure compressed gas is injected from the open end of the filter bag for a short time, it expands toward outside.
According to this filter movement, dust cake moves with filter but it is removed just before filter full expanded state of filter. This situation is shown in Fig. 24 observed by the plane type fabric test rig (Kanaoka C. et al., 1994). In the figure, ΔDf and ΔDd stand, displacements measured from clean side and dirty side, respectively. ΔD is defined as ΔD = ΔDd − ΔDf and means the relative displacement of dust cake, i.e., when ΔD = 0, dust cake moves with filter but ΔD > 0, dust cake movement is different form filter motion, i.e., dust cake is removed from the filter. In the figure, after cleaning air is injected, ΔDf increases and ΔDd decreases. This means filter expands outward and filter and dust cake move together at very beginning (between left to middle red lines). Then dust cake moves slightly different from filter with time (between middle to right red lines). Finally, ΔD becomes large rapidly showing the separation of dust cake, which happens at red circle in the figure.

Dennis R. and Klemm H.A. (1980) and Dennis. R. et al. (1981) gave modelling concepts for pulse jet filtration and then analysed the pressure loss for pulse jet filters from the relationship between dust adhesion to the fabric and the opposing force. Leith D. and Ellenbecker M.J. (1980) also presented a theory for pressure drop in a pulse-jet cleaned fabric filter.
Iinoya K. et al. (1979) measured dust dislodging performance of a pulse-jet fabric filter. Humphries W. (1981) investigated the influence of cloth structure on dust dislodgement from fabric filters and discussed the relationship between residual dust load and the structure of filter medium. Kanaoka C. et al. (1994) investigated dust cleaning mechanism of a pulse jet type bag filter. Kanaoka C. and Yao Y. (2003) studied time dependency of the pressure drop in a flat type pulse jet fabric filter. Ikeno H. et al. (2004) studied pressure drop in bag filter based on patched cleaning model, Simon X. et al. (2007) experimentally studied parameters affecting pulse-jet cleaning of bag filters supported by rigid rings. Binnig J. et al. (2011) analysed the cleaning pulse intensity in a surface filter test rig by dimensionless analysis method. Yao Y. et al. (2008) and Mao N. et al. (2008) compared the filter cleaning performance between VDI and JIS testing rigs for cleanable fabric filter. Qian Y. et al. (2015) investigated the effect of filtration operation and surface treatment on pulse-jet cleaning performance of filter bags. Ellenbecker M.J. and Leith D. (1983) measured dust removal characteristics of 3 fabrics with different surface treatment. Makino K. et al. (1976) and Ikazaki F. et al. (1978) studied dislodgement of dust cake by electrostatic effect. Tsubaki J. et al. (1982) and Naito, M. et al. (1984) studied dislodgement of deposited dust layer by applying normal stress. Park B.H. et al. (2010) proposed a preparation and characterization method of porous composite filter medium by polytetrafluoroethylene foam coating to improve separation performance.
4.3 Improvement of system performance
Since bag filter system is composed of many filter elements, its performance depends not only on the performance of individual filter but also on the system design and operation mode.
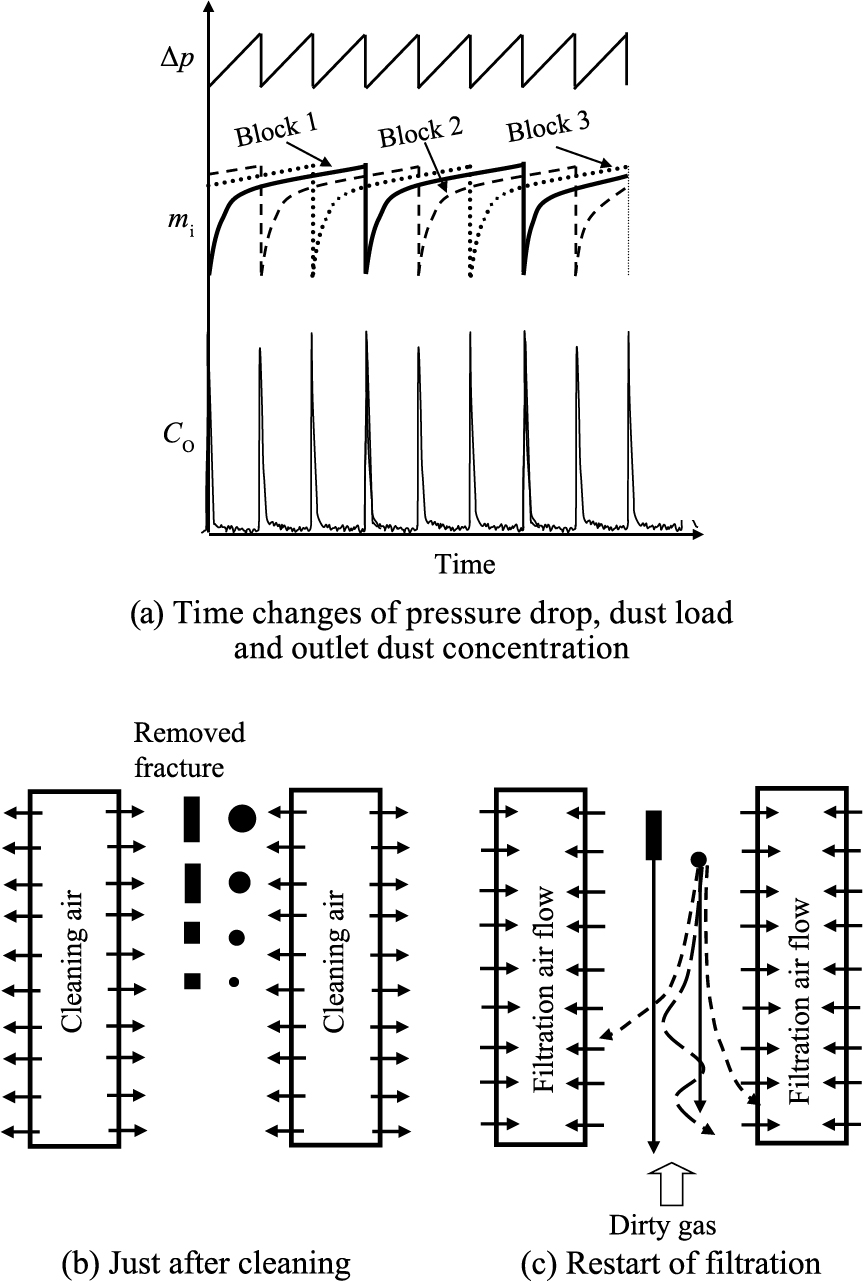
Fig. 25 schematically shows (a) the changes of system parameters and (b) phenomena taking place in a bag filter system with 3 pulse cleaning blocks. (a) shows the time changes of parameters such as pressure drop of filter system Δp, dust load on a bag filter element in within each cleaning block mi and emitted dust concentration from the filter system Co, respectively. Pressure drop of the system drops when cleaning pulse is injected and increases with time until next cleaning operation so that it changes in zig zag shape with time but does not change so much. Concerning dust load mi, by the cleaning operation at block 1, m1 immediately drop down to almost zero but m2 and m3 stay fairly high values and then flow resistance of bag filters in block 1 decreases by the clean operation, m1 increases quickly because of the concentration of gas flow to block 1 but dust load of other two blocks m
2
and m
3
do not change so much. Outlet is concerned, it jumps up at every cleaning process but drops down to very low level quickly and keeps almost the same level until next cleaning operation. (b) and (c) show the phenomena taking place in the filter system accompanying to the cleaning process, i.e., (b) shows the phenomena when cleaning compressed air is injected and (c) represents the situation just after filtration restarted. Since time interval between cleaning operation and restart of filtration is very short, removed dust has to fall down to the dust hopper against dirty gas flow and thus it has to have settling velocity. In another words, shape and size of fractures determine whether or not fractures drop down to the dust hopper or are recaptured by filter again.
Lu H.-C. and Tsai C.-J. (1998) studied to find the optimum design and operation parameters of a pulse-jet baghouse, and Ju J. et al. (2001) proposed a model to estimate the relation between filtration velocity and dust load in each cleaning cycle until reaching steady operation mode.
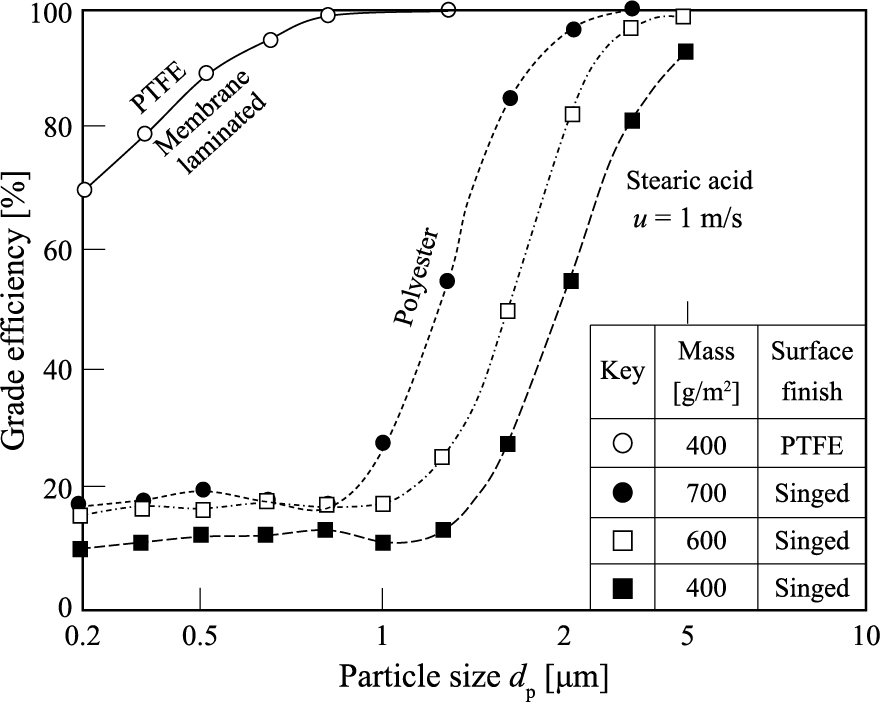
Improvement of collection performance of filter media is another important issue to improve the system performance. Fig. 26 is the comparison of filter collection efficiency by the difference of fiber mass and surface treatment. As seen from the figure, collection efficiency increases fiber mass from 400 to 700 g/m2. However, collection efficiency of membrane laminated filter shows very high efficiency at any particle size despite that fiber mass of the basement filter is only 400 g/m2.
4.4 Particle collection by cartridge filter
Cartridge filter was first developed as an air intake filter for vehicle engine and has been now used popularly even at high particle concentration region. Because of pleated and compact structure, filtration area per system volume can be larger than an ordinary cylindrical filter media and thus filter system size becomes small. However, cartridge filter has many problems relating to its structure.
Chen D.R. et al. (1995) and Chen D.R. and Pui D.Y.H. (1996) tried to optimize pleated filter designs by using a finite-element numerical model. Wakeman R.J. et al. (2005) analyzed the effects of medium compression, pleat deformation and pleat crowding are analyzed. Ming L. et al. (2010) experimentally studied 6 pleated fabric cartridges with different base media and geometrical dimensions in a pulse-jet cleaned dust collector. Then they evaluated the effect of cleaning methods and concluded that clean-on-demand mode performed better for filters with a low pleat ratio (< 4.0). Lo L. et al. (2010a, b) numerically and experimentally studied pleated fabric cartridges during pulse-jet cleaning. Joubert A. et al. (2010) evaluated the influence of humidity on the clogging pleated HEPA filters. Park B.H. et al. (2012) studied the influence of pleat geometry on filter cleaning in PTFE/glass composite filter. Bemer D. et al. (2013) studied clogging and cleaning cycles of a pleated cartridge filter by ultrafine particles. Hasolli N. et al. (2013a, b) evaluated the filtration performance of depth filter media cartridges as function of layer structure and pleat count. Bourrous S. et al. (2014) measured the nano-particles distribution in the pleated filters during clogging. Li J. et al. (2015) studied the improvement of dust cleaning effect by the installation of cone in a pleated filter cartridge during pulse-jet cleaning. Feng Z. and Long Z. (2016) simulated unsteady filtration. Kim J.-U. et al. (2017) evaluated the effective filtration area of a pleated filter bag in a pulse-jet bag house and found that effective filtration area decreases considerably due to its geometric configuration and dust clogging between pleat. Chen S. et al. (2017) studied the effect of pleat shape on reverse pulsed-jet cleaning of filter cartridges by CDF analysis and concluded that the shape of pleats has its effect on the pressure drop across pleated cartridges and pleat tip opening improves the uniformity of pressure on inner surfaces of pleats. Finally, they concluded trapezoidal pleat shape is a better candidate for pleating filter cartridges.


;%0A%09%09%09newWindow.document.open();%0A%09%09%09newWindow.document.write('<img src=%22./Graphics/36_2019006_27.jpg%22>');%0A%09%09%09newWindow.document.close();%0A%09%09)