4. Performance
The morphology (i.e. single or aggregated) and dispersion homogeneity of filler nanoparticles in a polymer can vary significantly leading directly to stark differences of nanocomposite performance. Prior to nanocomposite synthesis, the engineer must evaluate not only which particle size and shape to use but also its aggregation state (Camenzind A. et al., 2010a). In contrast to an agglomerate in which nanoparticles are only loosely bound by van der Waals and electrostatic forces (Iijima M. and Kamiya H., 2009), an aggregate consists of sintered, and therefore rigidly-connected, particles (Eggersdorfer M.L. and Pratsinis S.E., 2014). Separating agglomerates to individual nanoparticles, e.g., by ultra-sonication (Schulz H. et al., 2008), makes them attractive for enabling high optical transparency (Chau J.L.H. et al., 2007) as their small size minimizes light scattering (Caseri W., 2000). Aggregated nanoparticles, on the other hand, can be better for enhancing the mechanical stability (Camenzind A. et al., 2010b) or facilitating the formation of a percolating network as needed for electrode preparation (Kovacs G. et al., 2009).
Unfortunately, overcoming agglomeration (Fig. 5a) of single and aggregated nanoparticles is challenging (Iijima M. and Kamiya H., 2009), even with ultra-sonication. They form primarily because of strong attraction between particles as well as incompatible surface chemistry with the polymer (Caseri W., 2000). Lengthier and more energy-intense processing can reduce agglomeration as has been shown during visibly transparent dental composite preparation (Schulz H. et al., 2008). This is of utmost importance due to their negative impact on performance. In Al2O3-PDMS nanocomposites (Yi P. et al., 2014), for example, the thermal conductivity reached saturation already at 5 wt% nanoparticle content. Also a carbon black filled acrylate (Bhawal P. et al., 2018) showed significant reduction in mechanical strength due to undesired particle agglomeration. Both of these studies highlight that lower filler content can mitigate agglomeration which, however, reduces the performance enhancement given by nanoparticles. For example, at 10 wt% the carbon black was dispersed evenly but was insufficient for enhancing the electrical conductivity (Bhawal P. et al., 2018). Similarly, agglomerating sheets of reduced graphene oxide in poly(methyl methacrylate) (PMMA) caused the tensile strength, Young’s modulus and elongation-at-break to deteriorate significantly beyond 1 wt% nanoparticle content so that less had to be incorporated (Poddar M.K. et al., 2018).

Superior material homogeneity (i.e. less agglomeration) is obtained when the surface chemistry of nanoparticles is compatible (Wang Z. et al., 2014) with that of the polymer (Fig. 5b). Simple functional groups, such as hydroxyls (Liu S. et al., 2016), or more intricate oligomers (Wang G. et al., 2017) on the filler surface have shown effectiveness. However, this usually involves surface modification of the nanoparticle which can be rather tedious such as when encompassing multiple steps and polymerization (Chen Z. et al., 2015).
Compatible surface chemistry facilitates formation of a layer of immobilized polymer (yellow halo in Fig. 5b) around the filler nanoparticles (Camenzind A. et al., 2010a). In silicone rubber this layer is referred to as “bound rubber” (Litvinov V.M. et al., 2002). This layer of mechanically more rigid polymer ranges in thickness from a few (Camenzind A. et al., 2010b) to tens (Checchetto R. et al., 2014) of nanometers. Small nanoparticles are especially good candidates for obtaining proportionally large amount of immobilized polymer due to their high SSA (Camenzind A. et al., 2010a). In fact, this is reflected already during fabrication by the significant increase of blending solution viscosity at relatively low nanoparticle filler content (Camenzind A. et al., 2010b).
Even more rigid polymer-filler interface is formed by enabling crosslinking between them (Fig. 5c). It is rather uncommon, though, but has been realized, for example, in superparamagnetic hydrogels (Campbell S.B. et al., 2013) that crosslink upon mixing of modified poly(N-isoprpylacrylamide) with the functionalized filler nanoparticles. The hydrogel compressive strength and modulus increased significantly at moderate crosslinking density that was directly proportional to nanoparticle content. An increase in Young’s modulus was observed also in crosslinked nanocomposites containing BaTiO3 (Pu Z. et al., 2017). In contrast, there is little difference in dielectric performance compared to those nanocomposites without crosslinking (Niu Y. et al., 2015). Furthermore, the elasticity and tensile strength decreased with filler content (Pu Z. et al., 2017) making the nanocomposite inferior to conventional elastomers (Yue Y. et al., 2013). Similar doubts hold true for an epoxy - CNTs composite (Choi J.H. et al., 2017) because the claimed improvement of filler dispersion and thermal conductivity can be obtained without crosslinking (Yi P. et al., 2014).
Benefits obtained for adding nanoparticles to polymers depend on various factors briefly discussed in the preceding text. In the following, the influence of nanoparticle type and content in the polymer will be highlighted for different properties.
4.1 Mechanical
Nanoparticle addition to a polymer can be an excellent method for mechanical reinforcement of the polymer matrix (Yoshikai K. et al., 2002). This conclusion is drawn often from the increasing mechanical modulus with nanoparticle content (Camenzind A. et al., 2010b). This, however, is only partially true as it depends on polymer type that can be classified, for example, according to the temperature-dependent mechanical storage modulus (Fig. 6) obtained by dynamic mechanical analysis (DMA) (Hu X. et al., 2010). In such a thermoplastic analysis enables clear differentiation between three temperature-dependent physical states (red line in Fig. 6) separated by glass transition (Tg) and melting temperature (Tm) (Sperling L.H., 2005).
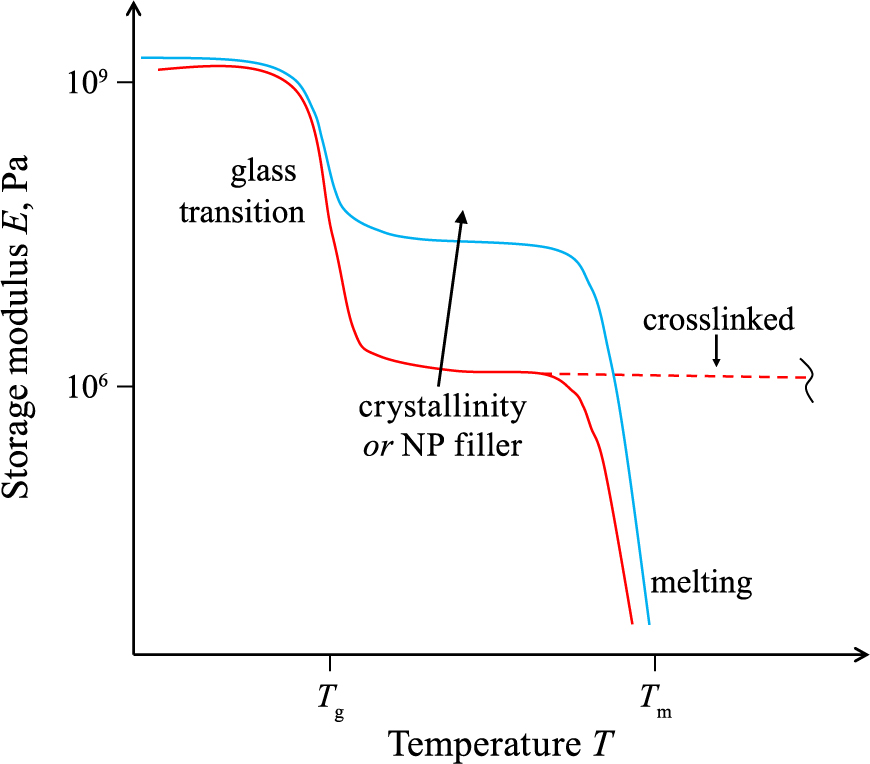
Below Tg (i.e. common employment range) the mechanical modulus is rather constant, around 109 Pa. Its magnitude for various polymers is quite similar as it originates from the intermolecular attractive forces between molecular chains and their individual covalent bonds (Sperling L.H., 2005). Accordingly, semi-crystalline polymers (blue line in Fig. 6) exhibit only slight increase of the modulus (Shieh Y.-T. et al., 2010).
At Tg the motion of molecular chains increases leading to a decay of the modulus by about three orders of magnitude for fully amorphous (glassy) polymers (red line). Semi-crystalline ones (blue line) exhibit a smaller reduction of the modulus as polymer crystallites restrict that motion (Shieh Y.-T. et al., 2010). The Tg varies from < 0 °C to > 100 °C (Mark J.E., 2009) and depends even on polymer molecular weight (Blattmann C.O. and Pratsinis S.E., 2016) and film thickness (Singh L. et al., 2004).
Between Tg and Tm the mechanical modulus of glassy polymers plateaus (Sperling L.H., 2005) and decreases once more upon transiting to a melt (i.e. at Tm). This transition from a glassy state to a melt occurs more gradually for amorphous than semi-crystalline thermoplastics since crystallites remain intact up to Tm. In the presence of crosslinks (e.g., elastomers such as silicone rubber), this transition does not occur (dashed red line in Fig. 6) since polymer motion is kept restricted by the covalent bonds between chains (Sperling L.H., 2005). As a result, the mechanical modulus remains stable until polymer decomposition.
Mechanical stabilization of the polymer by addition of nanoparticles is analogous to semi-crystalline thermoplastics: Below Tg filler nanoparticles have a marginal effect (López D. et al., 2001). The Tg, however, may be shifted from that of the pure polymer depending on polymer-nanoparticle interactions (Pu Z. et al., 2017). Higher/lower Tg indicates better/worse compatibility (Zhu A. et al., 2008) due to formation of either immobilized polymer (Fig. 5) or free-volume (loosely organized polymer chains), respectively (Pu Z. et al., 2017). Loading poly(vinyl chloride) with 2 wt% of SiO2 nanoparticles increased the Tg by 2.5 °C when good interfacial compatibility exists and decreased it by 1.5 °C for incompatible interfaces (Zhu A. et al., 2008). Increasing the Tg can be desirable as it may reduce polymer aging (Cangialosi D. et al., 2013). For poly(lactic acid) (PLA), for example, aging has detrimental effects on is mechanical stability (Ghazaryan G. et al., 2016). The addition of ZnO (Lizundia E. et al., 2016) and CNTs (Lizundia E. and Sarasua J.R., 2012) improve PLA aging. This effect is reversed, however, upon nanoparticle agglomeration.
The largest effect of the nanoparticle filler on the modulus of the polymer (Fig. 6) occurs in the glassy state (i.e. between Tg and Tm). Analogous to semi-crystalline polymers, the modulus increases with nanoparticle content (Bhawal P. et al., 2018). Therefore, nanocomposites employed at temperatures above Tg profit most from addition of nanoparticles. This is exemplified by the storage modulus of ethylene methyl acrylate that improves by less than an order of magnitude below its Tg when adding 50 wt% (~37 vol%) carbon black (Bhawal P. et al., 2018). Above Tg, however, the modulus is increased by almost two orders of magnitude by such addition. A similar observation is made in silica-filled styrene-butadiene rubber (Yoshikai K. et al., 2002). There the modulus increases by 66 and 1200 % below and above Tg, respectively. In a semi-crystalline polymer nanocomposite the nanoparticles can stabilize the polymer directly (Camenzind A. et al., 2010b) and/or stimulate its crystallization (Cortes L.Q. et al., 2014).
Tensile stress-strain relations (Fig. 7) reveal the mechanical durability at a given temperature (usually 20–25 °C). Fig. 7a shows the general stress-strain curves of three thermoplastics of varying nanoparticle content below their Tg. The Young’s modulus (i.e. linear slope at small strain) increases with nanoparticle content (Lizundia E. et al., 2016) in agreement with DMA (Fig. 6). In contrast, the strain-at-break (i.e. maximal strain before rupturing) decreases with particle content indicating that the nanocomposite becomes more brittle (Deshmukh K. et al., 2017). For low content of homogeneously dispersed nanoparticles (Fig. 7a: red solid line), a ductile behavior beyond the linear elastic region still can be observed before material failure (Luong N.D. et al., 2011). At high content (Fig. 7a: green broken line), strong agglomeration and/or poor interfacial compatibility (Fig. 5a), however, lead to material failure prior to surpassing the linear elastic region (Lizundia E. et al., 2016). For PLA strong embrittlement is already observed when filled with only 0.25 wt% (~0.6 vol%) of ZnO nanorods (Lizundia E. et al., 2016). This contrasts to nanocomposites with functionalized exfoliated graphite in PMMA (Wang J. et al., 2012) and polyimide (Luong N.D. et al., 2011) at 1 wt% (~0.54 vol%) and 0.75 wt% (~0.49 vol%), respectively, as they still possess some ductility beyond the linear elastic region. Their low nanoparticle contents indicate quite clearly, though, that strong embrittlement will set in already after adding rather little filler amount.

In contrast to this typical tensile stress-strain behavior shown in Fig. 7a, some studies report that embrittlement of the thermoplastic nanocomposite is preceded by a prior enhancement of the ductility. The strain-at-break of PLA, for example, increased by about 0.5 % when adding 0.18 vol% of Ag NWs (Doganay D. et al., 2016). More nanoparticles (0.24 vol%) led to common embrittlement. This improvement was attributed to the homogeneous filler dispersion achieved by the positive effect of the poly(vinylpyrrolidone) coating on the Ag NWs resulting in a compatible interface (Doganay D. et al., 2016).
Unlike earlier mentioned PMMA-graphite nanocomposites (Wang J. et al., 2012), the strain-at-break of PMMA filled with graphene oxide nanosheets increased by 4 % (Poddar M.K. et al., 2018). However, the latter contained merely 0.4 wt% (0.21 vol%) of fillers in contrast to the brittle PMMA-graphite nanocomposite (0.9 wt% exfoliated graphite) made by Wang J. et al. (2012). At comparable nanoparticle content (1 wt%), Poddar et al. (2018) reported a similar strong embrittlement by filler particle agglomeration.
Thermoplastic nanocomposites exhibit a characteristic increase of the yield strength (= maximal stress prior to plastic deformation) at low nanoparticle content (Fig. 7a: red solid line) (Deshmukh K. et al., 2017). However, agglomeration and poor polymer-nanoparticle compatibility lead to reduction of the yield strength (green broken line) (Zhu A. et al., 2008). The effect is, therefore, quite similar to the decreasing nanocomposite ductility (discussed above) with nanoparticle filler content.
Fig. 7b shows the general tensile stress-strain relation of silicone rubber nanocomposites (above Tg) containing different loadings of nanoparticles (Yue Y. et al., 2013). These crosslinked nanocomposites exhibit significant improvement in Young’s modulus, yield strength and strain-at-break. In Fig. 7b this improvement is seen by comparing the solid red line with the blue dot-broken one. In quantitative terms, the strain at break of silicone rubber (Yue Y. et al., 2013) improves from ~160 to ~380 % by adding silica nanoparticles (~12.5 vol%). More silica (~19.3 vol%) leads to further increase of the elastic modulus but deteriorates the strain-at-break (330 %). This embrittlement is shown schematically in Fig. 7b (green broken line). Decreasing the nanoparticle size while maintaining the same volume loading increases the modulus and strain-at-break (Camenzind A. et al., 2010b). This arises from the increasing bound rubber fraction that forms when incorporating smaller filler nanoparticles.
Cross-linked polyurethane (PU) nanocomposites are similar to those containing silicone rubber as host polymer with respect to exhibiting an increasing modulus and ultimate strain with nanoparticle addition (Çakmakçı E. et al., 2014). However, they become less elastic upon nanoparticle addition. For example, the strain-at-break decreases by 540 % (= 286 %–826 %) when adding 8.7 vol% of BaTiO3 (Yin G. et al., 2017) whereas the Young’s modulus increases to 30.5 MPa (+ 50 %). Analogous observations are made in PU nanocomposites containing hexagonal boron nitride (Çakmakçı E. et al., 2014) and magnetite nanoparticles (Das B. et al., 2013).
4.2 Thermal
Polymers are poor heat conductors due to their low thermal conductivity k (usually < 0.4 W m−1 K−1). But their flexibility and good conformability to uneven or rough surfaces as well as the ability to apply them to hard-to-reach areas make them attractive for heat conductors in electronics. Adding high-k nanoparticles (e.g., boron nitride, CNT, graphene, metals) to polymers improves their thermal conductivity. For example, adding Al2O3 nanoparticles (10 vol%) nearly doubles the k of an epoxy (Moreira D.C. et al., 2016). More alumina leads to entrapped air, nanoparticle agglomeration and poor interfacial contact between polymer and particles that restrict additional enhancement of k. Such upper limit of the k is also observed in PMMA containing BN nanosheets (Pullanchiyodan A. et al., 2017) and PDMS with Al2O3 nanoparticles (Yi P. et al., 2014) due to entrapped air and filler agglomeration, respectively. The importance of the nanoparticle-polymer interface for ensuring homogeneous dispersion and intimate contact with the matrix is shown nicely by CNT filled epoxy nanocomposites (Choi J.H. et al., 2017). That work clarifies that selecting the proper organic linker between polymer and CNT is crucial for a superior k.
Direct contact between high-k fillers diminishes the heat transfer resistance leading to an increase of the nanocomposite k. Such nanocomposites have been realized, for example, by infiltration of poly(styrene) (PS) into a porous BN nanotube film (Zhi C. et al., 2009). This improved the k of PS by more than 20 times. In fact, very high (> 1) and low (< 1) aspect ratio nanoparticles are best (White S.I. et al., 2010) for creating an interconnected nanoparticle network within a polymer. Fig. 8a shows the enhancement of thermal conductivity (Δk) as a function of nanoparticle aspect ratio from literature (according to symbol shape and color). Nitrides (squares) are most common due to high k and extensive availability of BN nanosheets/platelets. Oxides (diamonds) mainly consist of spherical Al2O3 or TiO2 nanoparticles whereas high aspect ratio Ag and Cu NWs are the most frequently used metals (triangles). Carbon-based nanoparticles (circles) are mostly CNTs. Due to the slight correlation between nanoparticle aspect ratio and composition, this dataset (Fig. 8) may exhibit an unavoidable material bias that should be kept in mind when interpreting it.
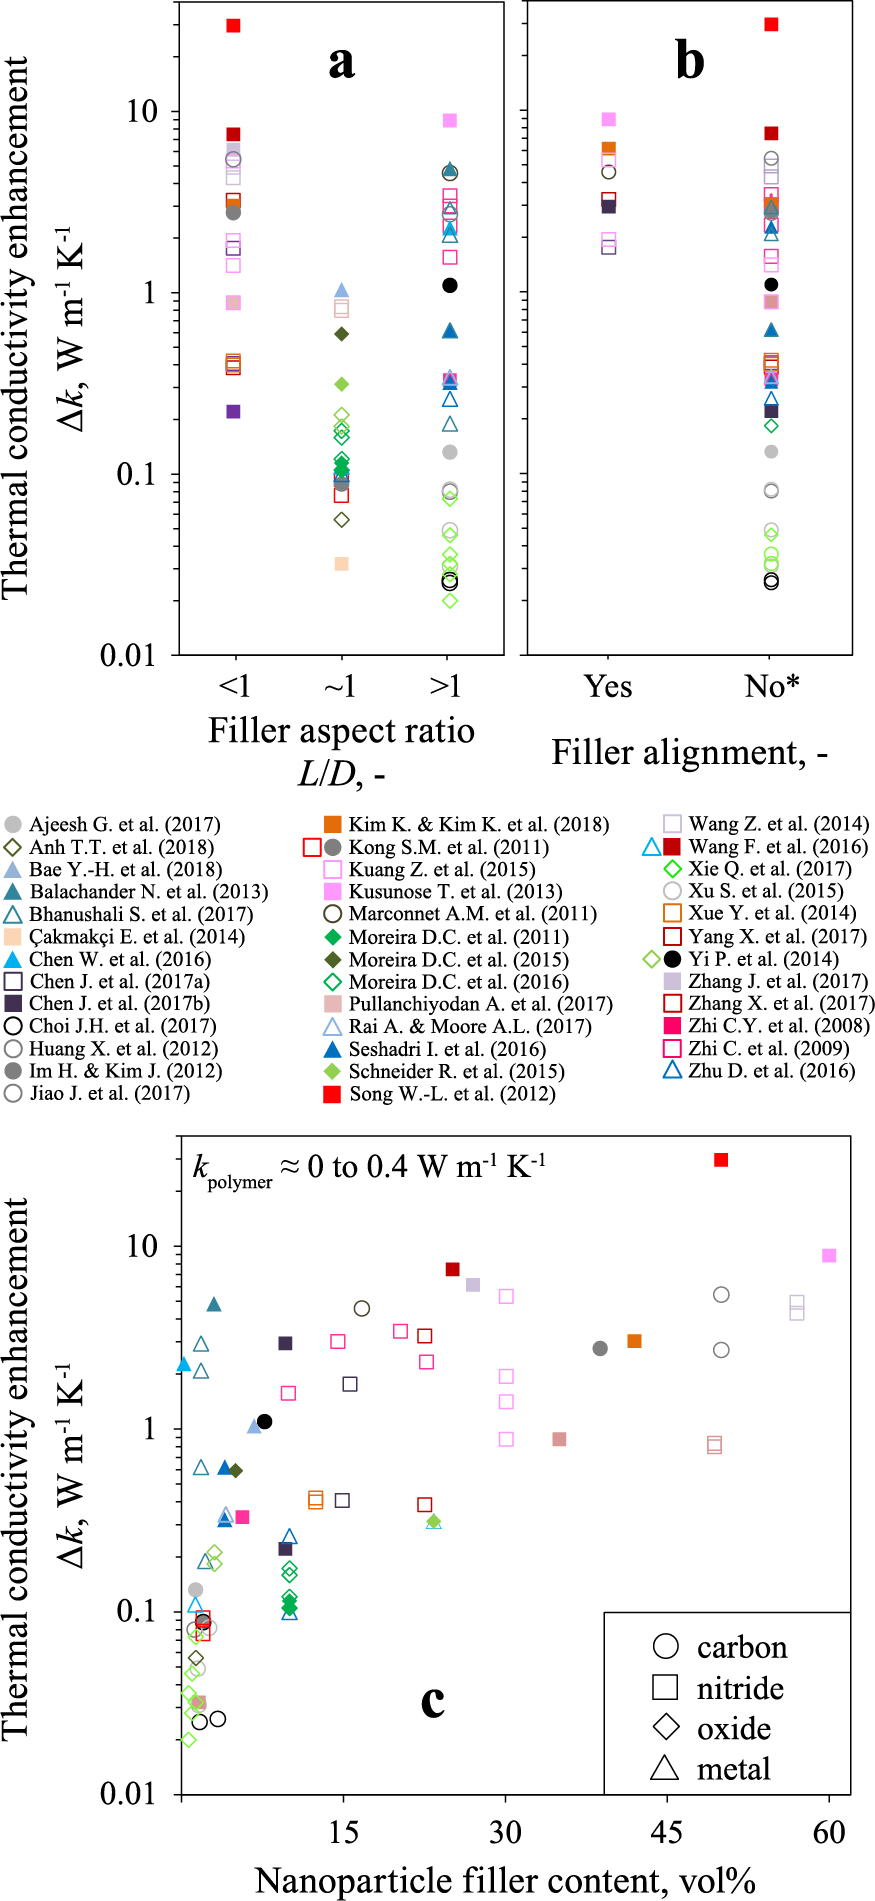
In general, the least improvement of k is obtained in general with spherical nanoparticles with which the maximum reported Δk of the nanocomposite just barely surpasses 1 W m−1 K−1 (Fig. 8a). This agrees well with their inferior ability to form a percolating network (Rivière L. et al., 2016). According to Fig. 8a it is difficult to distinguish if nanoparticles with aspect ratios < 1 (platelets) or > 1 (wires) are better fillers for thermal conducting nanocomposites since their achievable Δk ranges are largely overlapping. Elongated carbon-based nanoparticles, however, seem to be the worst high aspect ratio fillers as inferred from their low Δk. Their characteristic high phonon scattering at the nanoparticle interface is a likely cause (Marconnet A.M. et al., 2011).
Reduction of the heat transport resistance is controlled not only by aspect ratio but also by the quantity of nanoparticle-nanoparticle and nanoparticle-polymer junctions. Minimizing these junctions, such as by nanoparticle filler alignment in the direction of heat transfer, is ideal for increasing Δk (Zhang X. et al., 2017). For example, randomly embedded BN nanosheets (12.5 vol%) in PDMS tripled the k of the polymer to 0.53 W m−1 K−1 (Chen J. et al., 2017a). By aligning these nanosheets, Chen et al. (2017a) additionally improved this k by more than three times (1.75 W m−1 K−1) in the anticipated heat transfer direction. Perpendicular to the alignment direction, the k was similar to that of the nanocomposite with randomly dispersed BN. This suggests that enhancement of k through alignment of the nanoparticles does not deteriorate the corresponding perpendicular heat transfer.
A greater overview concerning the effect of filler alignment on Δk is shown in Fig. 8b. The data do not consider polymer nanocomposites with spherical nanoparticle fillers as they cannot be aligned. A consistently high Δk (> 1 W m−1 K−1) is obtained for polymer nanocomposites with aligned nanoparticles (Fig. 8b). However, unaligned fillers are capable of promoting similar high Δk which may question the efficacy. A possible explanation is that nanoparticle alignment is not anticipated but can occur freely due to the filler aspect ratio, high viscosity of the mixing solution and/or polymer nanocomposite manufacturing method (Zhang X. et al., 2017). Unnoticed and/or not reported nanoparticle alignment (indicated by asterisk) remains disguised even for attentive readers of those manuscripts.
Figs. 8a, b neglect a crucial aspect that is expected to lead to strong variation and discrepancy: Nanoparticle content. In fact, most researchers increase the nanoparticle content as much as possible (Yi P. et al., 2014) to encourage high thermal conductivity. Fig. 8c shows Δk as a function of nanoparticle filler content. Differentiation is made between the material categories shown in Fig. 8a.
Fig. 8c clearly shows that obtaining single-digit Δk by adding nanoparticles is realistic. But the amount of nanoparticles for achieving this increase varies dramatically. For example, a BN nanosheet-loaded poly(phenylene sulfide) (~49 vol%) increased the k by 0.84 W m−1 K−1 (Yang X. et al., 2017) whereas poly(vinyl butyral) required only 9.9 vol% of BN nanotubes (Zhi C. et al., 2009) to obtain greater Δk (1.57 W m−1 K−1). But a PDMS filled with Au NWs (Balachander N. et al., 2013) surpassed this value (Δk = 4.84 W m−1 K−1) with even less nanoparticles (3 vol%). This underlines the strong variation among nanocomposites that can be reduced, in some instances substantially, by selection of a different nanoparticle filler material.
Metallic nanoparticles (frequently high aspect ratio ones, Fig. 8a) are added only in small quantities (< 10 vol%) to obtain a Δk > 1 W m−1 K−1. In fact, metals seem to be the best choice for obtaining a high k with the least nanoparticle volume content. When plotting Δk as a function of weight-based filler content, i.e. wt%, no differentiation between the material types can be recognized (Blattmann, C.O., 2019).
Metal oxides (mostly spherical, see Fig. 8a) are added up to a similar volume content as metals (generally < 10 vol%). The obtained enhancement in the k, however, is significantly lower (Δk < 0.6 W m−1 K−1). On the one hand, this may be caused by their inferior nanoparticle aspect ratio (usually L/D = 1) discussed in connection with Fig. 8a. However, just as decisive is the difference in thermal conductivity of the nanoparticle materials: The k of silver and copper (430 and 400 W m−1 K−1, respectively) is more than ten times higher than that of alumina or titania (35 and 10 W m−1 K−1, respectively) (Rumble J.R., 2018). In fact, this deviation by about an order of magnitude agrees quite well with the similarly lower Δk of the corresponding polymer nanocomposites (Fig. 8c).
Carbon- and nitride-based nanoparticles lead to similar Δk that generally level off below 5 W m−1 K−1 at around 10–20 vol% filler content. This content threshold is approximately equal to the amount up to which metals and oxides are added (Fig. 8c): Coincidence? It could suggest an ideal range up to which the greatest gain is obtained before being counterbalanced by deteriorating effects such as the difficulty to compound, filler agglomeration and nanocomposite embrittlement (Schneider R. et al., 2015).
Hexagonal boron nitride (most common nitride in Fig. 8) has an in-plane thermal conductivity (~ 400 W m−1 K−1 (Jo I. et al., 2013)) similar to silver and copper (2018). This is mirrored in Fig. 8c by the Δ k of the nanocomposites since both metal and nitride filled polymers reach values of similar maxima (1 to 10 W m−1 K−1). Accordingly, it is expected that polymers with CNTs (3000 W m−1 K−1 (Kim P. et al., 2001)) or graphite (1950 W m−1 K−1 (2018)) exhibit higher k. However, these carbon containing polymer nanocomposites do not excel in performance. Even in thin nanocomposite films containing 16.7 vol% of aligned CNTs the k barely reaches 5 W m−1 K−1 in the in-plane direction (Marconnet A.M. et al., 2011). The authors reason the deviation from theory with the imperfection of the CNTs, e.g., those with defects, inhomogeneous conductivity and imprecise morphology, that largely reflects the challenging manufacture of these nanoparticles in pristine quality (Nessim G.D., 2010). Additional deterioration in nanocarbon filled polymers stems from the heat transfer mechanism that leads to proportionally more grave losses at the polymer-filled junctions between nanoparticles (Kim P. et al., 2001).
4.3 Dielectric
Conventional capacitive energy storage is realized by a ceramic sandwiched between two electrodes. High dielectric constant ceramics are most attractive since these increase the theoretical energy density of the capacitors that are used in light-weight and rapidly accessible electricity storage. Their low breakdown field strength (i.e. low breakdown voltage), however, prevents the realization of these high energy densities (Barber P. et al., 2009). In contrast, polymer dielectrics have a rather low dielectric permittivity but offer high breakdown strength. By merging polymer and ceramics into a nanocomposite it is anticipated to make use of the benefits of the individual constituent. It is important to highlight, here in specific, that nanocomposites are more attractive than microcomposites since thinner dielectric films should enable higher energy densities.
Fig. 9a shows the permittivity enhancement, i.e. permittivity of the nanocomposite (ɛNC) normalized to that of the polymer (ɛP), as a function of nanoparticle filler content (evaluated at 1 kHz). The data shown in Fig. 9 were extracted from literature (symbol shape and color) that comprises primarily of barium titanate (BaTiO3) nanoparticles in poly(vinylidene fluoride) (PVDF). The unavoidable composition bias stems from the high dielectric permittivity of the constituents, their commercial availability and the ability to manufacture these nanocomposites by solvent blending. To identify possible effects resulting from the nanoparticle aspect ratio, differentiation is made between spheres (circles, L/D = 1) and wires/rods (squares, L/D > 1). Platelets/sheets (L/D < 1) are not considered in Fig. 9 as they are uncommon for this application.

The permittivity enhancement increases with nanoparticle content (Fig. 9a). This increase is lower for polymer nanocomposites filled with spherical than elongated (L/D > 1) nanoparticles. At 20 vol% nanoparticle content, for example, ɛNC/ɛP ranges from 1.5 to 5.2 for spheres and from 2.6 to 34.3 for wires/rods. The spread of ɛNC/ɛP becomes even more obvious at 40 vol%: 2.2–12.0 and 2.2–71.8 for spheres and wires/rods, respectively. The differing data spread is most likely the effect of filler source since spherical nanoparticles (frequently dp = 100 nm) are often from the same commercial suppliers whereas elongated ones are synthesized by small entities or individual laboratories. The latter possess greater leverage for tuning/optimizing the particles according to method, infrastructure and skill of the engineer and, therefore, leading to more significant variability. Although wires/rods exhibit greater spread of ɛNC/ɛP than spheres, marginal differences are observed between these nanoparticle shapes (Fig. 9). This is seen from the strong overlap of squares and spheres. Only few published reports give reason to believe that elongated nanoparticles are superior fillers for dielectric nanocomposites. And these are difficult to assimilate as they exhibit different filler aspect ratios L/D (= 13.7 to 2000), nanocomposite compositions, preparation techniques and nanoparticle alignment direction.
However, some researchers explicitly investigated the effect of nanoparticle aspect ratio such as the solution blended BaTiO3 (3.6 vol%) - PVDF nanocomposite (Pan Z. et al., 2017). In that work ɛNC/ɛP increases from 1.3 to 1.8 to 2.1 with increasing nanoparticle aspect ratio (L/D = 1, 30 or 100). In fact, similar findings are shown also for a nanocomposite with 10 vol% BaTiO3 nanoparticles in a PVDF co-polymer where ɛNC/ɛP improves from 1.7 to 2.9 upon increasing the nanoparticle filler aspect ratio from 1 to 25 (Feng Y. et al., 2015). A rather small improvement of ɛNC/ɛP (1.03 versus 1.20), however, is observed in an epoxy filled with 1.3 vol% of TiO2 when increasing the L/D of the nanoparticles from 1 to 100 (Xie Q. et al., 2017). In that case, the comparatively lower permittivity enhancement may stem from the absence of nanoparticle surface functionalization. In fact, the effect of nanoparticle surface functionalization is just as important (Niu Y. et al., 2015), if not even more crucial (Wang D. et al., 2014) than the aspect ratio: Adding an organic coating around the nanoparticles reduces agglomeration in the polymer but can induce a lower dielectric permittivity in comparison to when using the pristine (i.e. untreated) counterpart (Niu Y. et al., 2015). A thin coating layer (e.g., fluorination (Liu S. et al., 2015), hydroxylation (Liu S. et al., 2016)) may be most desirable to minimize lowering of the ɛNC (Wang D. et al., 2014) while still encouraging the formation of a good polymer-nanoparticle interface (Wang L. et al., 2016) and minimal agglomeration.
The composition of filler nanoparticles effects in substantial variation of ɛNC/ɛP. The ɛNC of polymer containing silica (Paredes M. et al., 2016), titania (Xie Q. et al., 2017) and BaTiO3 (Pan Z. et al., 2017) increases in this sequence due to the identically increasing dielectric constant (Barber P. et al., 2009) of these oxides. More easily overlooked, however, is that each phase of BaTiO3 (Schädli G.N. et al., 2017) exhibits a unique dielectric permittivity. This is investigated, on the one hand, with a polycarbonate filled with 16.8 vol% cubic BaTiO3 nanoparticles that leads to a permittivity enhancement of 3.8 (Thanki A.A. and Goyal R.K., 2016). Exchanging the cubic with tetragonal BaTiO3 nanoparticles improves the ɛNC/ɛP to 5.9.
In addition to the dielectric permittivity, the performance of a composite capacitor is determined by its losses due to conduction of charges and material heating (Thanki A.A. and Goyal R.K., 2016). This is characterized by the dielectric loss (tan(δ)) that should be as low as possible. Fig. 9b shows the dielectric loss ratio tan(δNC)/tan(δP) as a function of nanoparticle content in the polymer (evaluated at 1 kHz). Frequently, the tan(δNC) is larger than tan(δP) so that the dielectric loss ratio becomes greater than 1. This, however, is undesired as it reflects a deterioration in comparison to pristine polymer (Barber P. et al., 2009). Although significant spread of data is observed in Fig. 9b, most of the ratios are < 10 and increase with nanoparticle content.
The tan(δNC)/tan(δP) inferred loss occurs for one part due to electrical charge dissipation through the nanocomposite (Xie Q. et al., 2017). The formation of a percolating nanoparticle network is the leading factor that increases the charge transfer (Norkhairunnisa M. et al., 2012). As a countermeasure, multilayered dielectrics exhibiting lower nanoparticle content in the direct vicinity of the electrodes have been proposed (Hu P. et al., 2013). These electrode-adjacent layers act as charge transfer barriers which effectively retain the dielectric loss nearly identical to that of the polymer.
Dielectric losses also stem from poor interfacial interaction between nanoparticle and polymer as this prevents immobilized polymer formation (Tanaka T. et al., 2005), facilitates agglomeration (Hou Y. et al., 2015) and can lead to entrapped air (Liu S. et al., 2014). This highlights, once again, that chemical modification of the nanoparticle surface must be well tuned: Here, to balance the desired reduction of the dielectric loss with the undesired inferior permittivity (Wang D. et al., 2014).
Depending on nanoparticle fabrication (Tohma T. et al., 2002), the dielectric loss of the filler may be smaller than that of the polymer. This results in tan(δNC)/tan(δP) being less than unity and decreasing with nanoparticle content. This is obtained, for instance, in a nanocomposite filled with alumina-encapsulated BaTiO3 nanofibers (Pan Z. et al., 2017). The authors claim that the alumina coating reduces the interfacial polarization at the nanoparticle interface, acts as electrical insulator and facilitates homogeneous nanoparticle dispersion. All of these supposedly lead to the lower dielectric loss. The effect on tan(δNC)/tan(δP) < 1, however, is likely to stem primarily from the BaTiO3 nanofiber core as it improves the dielectric loss ratio most significantly.
In contrast to coating individual filler nanoparticles, Hu et al. (2013) could reduce the dielectric loss by preparing multilayered nanocomposite films. There the outer layers contain TiO2 nanoparticles while the central one is filled with Mn-doped Ba0.3Sr0.7TiO3. This assembly enables a gradual increase of permittivity towards the central nanocomposite layer due to the lower ɛ of TiO2 than that of Mn-doped Ba0.3Sr0.7TiO3. The permittivity gradient is considered beneficial for reducing the losses that originate from polarization at interfaces of materials with starkly different ɛ (i.e. polymer and ceramic).
Fig. 9b shows that polymers containing high aspect ratio nanoparticles can be divided according to their dielectric loss: tan(δnc)/tan(δp) > 1 or ≤ 1. The former is expected since high aspect ratio nanoparticles more readily form a percolating network (Wang M. et al., 2015) that facilitates charge transfer especially when aligned (Zhang D. et al., 2017). Nanowire alignment, however, may also be a probable reason why some polymer nanocomposites exhibit a tan(δNC)/tan(δP) ≤ 1. It was observed, for example, that solvent cast films with nanowires exhibited a preferential orientation (Hu P. et al., 2013) in the in-plane direction, i.e. perpendicular to charge transfer. That is effective in lowering the dielectric loss. In fact, all nanocomposites in Fig. 9b that contain nanowires and exhibit a tan(δNC)/tan(δP) ≤ 1, were prepared by casting from solutions of polymer (PVDF-based) in dimethylformamide (DMF). In fact, only Feng Y. et al. (2015) (included in Fig. 9b) employed this approach and obtained nanocomposites with tan(δNC)/tan(δP) > 1. This work also happens to be the only one that refrained from nanoparticle surface modification: A predicament of filler agglomeration (Wang G. et al., 2017).
This subsection began with mentioning that an undeniable reason for selecting a polymer nanocomposite as a dielectric over the pure ceramic is because of the low breakdown strength (Eb) of the latter. This intrinsic property of the ceramic unfortunately cannot be masked with a polymer but it can be subdued. Fig. 9c shows the breakdown strength ratio of the nanocomposite to the unfilled polymer (Eb,NC/Eb,P). This ratio decreases with filler content so that quite frequently the Eb,NC is less than half of the Eb,P when 20 vol% nanoparticles are added. Although significantly lower than the pure polymer (PVDF: Eb,P ≈ 300–400 V μm−1), this is still reasonably higher than the pure ceramic (BaTiO3: Eb ≈ 10 V μm−1). Fig. 9c indicates that the decreasing Eb-ratio is independent of nanoparticle aspect ratio as can be inferred from the strongly overlapping symbols.
Especially below 10 vol% nanoparticle content (Fig. 9c), some authors claim an increase of Eb. This is the case, for example, in multilayered nanocomposites containing a concentration gradient of BaTiO3 nanoparticles (Wang Y. et al., 2018). There the low nanoparticle content in the outermost nanocomposite layers were found to effectively scatter, absorb and/or dissipate the kinetic energy of passing electrons enabling Eb,NC/Eb,P to become > 1. In the absence of the gradient, the nanoparticle agglomerates facilitated charge transfer and decreased the breakdown strength as in most dielectric polymer nanocomposites. Consistent with Wang Y. et al. (2018), a BaTiO3-poly(styrene) nanocomposite also exhibited an increasing breakdown strength up to about 10 vol% nanoparticle content but only when nanoparticle fillers were dispersed homogeneously in the polymer (Wang D. et al., 2014). This improved Eb was attributed to the efficient scattering and trapping of electrons by nanoparticles that mitigates charge transfer.
4.4 Electrical conductivity
Dielectric polymer nanocomposites aim to block charge transfer (see subsection 4.3) as electrical conductivity leads to losses. An electrically conductive path in nanocomposites for heat dissipation (see subsection 4.2) in electronics can be undesirable as well, as it can lead to shorts in the device circuitry. This subsection, however, focuses explicitly on making polymers electrically conductive by adding nanoparticle fillers.
Electron propagation through a polymer relies on a conductive path (Blattmann C.O. et al., 2015). Upon adding a sufficient amount of nanoparticles, i.e. the percolation threshold (pc), they form paths of interconnected particles (Mutiso R.M. and Winey K.I., 2012). Quite frequently, though, these path-forming particles are just barely touching or still are separated by a thin polymer gap. The only means for electrical conductivity is by tunneling (Mutiso R.M. and Winey K.I., 2012) of the electrons through this resistive polymer. Electron tunneling leads to a characteristic S-shaped curve of the conductivity as a function of nanoparticle content (Karttunen M. et al., 2008): Higher filler content induces narrowing of the tunneling gaps and more directly contacting nanoparticles (Norkhairunnisa M. et al., 2012) and thus gradually increasing the conductivity.
The electrical conductivity of the polymer nano-composite relies on nanoparticle composition. Fig. 10a shows the saturated electrical conductivity (σ) of the polymer nanocomposite reported in literature (symbol shape, color and fill) categorized according to nanoparticle filler type. The electrical conductivity in Fig. 10 ranges from 10−10 to 104 S cm−1 depending on nanoparticle filler type. However, significant variability is seen for each type separately so that pinpointing an optimal one is difficult. One recognizes, though, that silver-based nanoparticles are capable of inheriting the highest electrical conductivity to the polymer but still less than that of metallic copper.

The strong scatter of the σ in Fig. 10a stems from the variable filler quality (Almudever C.G. and Rubio A., 2015), manufacture difficulties (Mao Y. et al., 2016) and material/manufacture compromises that need to be undertaken (Mapkar J.A. et al., 2013). Synthesis of CNTs, for example, leads to a mixture of conducting and semiconducting nanoparticles whereas the conductivity of the former depends on doping, diameter, density and chirality (Almudever C.G. and Rubio A., 2015). Furthermore, in addition to agglomeration occurring with all nanoparticles, slender elongated ones (i.e. tubes, wires, fibers) can deform (Steinmann W. et al., 2013) or even fracture (Triambulo R.E. et al., 2014), for example during manufacturing (e.g., ultrasonication, compounding), possibly leading to conductivity reduction.
High conductivity variability in graphene-polymer nanocomposites can be due to the largely differing techniques applied for exfoliating and oxidizing the graphite powder: Hummer’s method (Hummers W.S. and Offeman R.E., 1958) can lead to nanocomposites with reasonably high conductivity (Stankovich S. et al., 2006). Nanocomposites with similar electrical performance, however, can also be prepared with microwave exfoliated graphite (Kujawski M. et al., 2010). Most common, though, is graphite processing by a modified Hummer’s method followed by thermal shock (Zheng W. and Wong S.-C., 2003). At about 3 vol% filler content in PMMA (Zheng W. and Wong S.-C., 2003) or poly(amide) (Pan Y.-X. et al., 2000) these nanocomposites (both containing oxidized graphene prepared by modified Hummer’s method) exhibit an electrical conductivity of 20 μS cm−1 or 1 mS cm−1, respectively: A rather big difference indicating how crucial is the nanoparticle filler quality.
The polyol process used for Ag NW synthesis (Coskun S. et al., 2013) leads to a thin polymer coating that encapsulates the nanowire. This coating inevitably acts as an insulator so that electron tunneling through it is unavoidable. Such organic layers, however, are required to prevent nanowire agglomeration in the polymer (Geng Y. et al., 2008). Generally, a compromise needs to be found with respect to adding a thin and yet effective coating to the conductive nanoparticles. For example, carbon nanofibers with surface treatment exhibit inferior electrical conductivity than pristine nanoparticles (Mapkar J.A. et al., 2013) but induce superior nanocomposite mechanical stability due to their more homogeneous dispersion. In a CNT-epoxy nanocomposite (Geng Y. et al., 2008), however, this unwanted reduction of the σ is diminished by selecting a non-covalently bound surfactant rather than a covalently-binding silane functionalization. Preparation of nanocomposites by polymer infiltration (Fig. 3e) allows one to circumvent the use of these organic coatings (Sotiriou G.A. et al., 2013) or, at least, remove them by thermal annealing the nanoparticle film before embedding. Annealing a Ag NW film (Coskun S. et al., 2013) not only removes the insulating coating but also sinters the nanoparticles at their junctions further enhancing electrical conductivity.
Nanoparticles of doped metal oxide semiconductors, such as Sb:SnO2, are attractive fillers for preparing electrically conductive and transparent nanocomposites. The conductivity of these polymer nanocomposites depends largely on the amount of Sb doping in the nanoparticles (Kojima M. et al., 1993) and their synthesis technique. The latter determines, for example, the valence state of antimony (i.e. Sb3+, Sb5+) (Müller V. et al., 2009). With respect to doping content, it has been shown that sintered 4 at% Sb in SnO2 nanoparticles prepared in solution leads to a film exhibiting a σ > 100 S cm−1 (Müller V. et al., 2009). When prepared by spray pyrolysis, however, σ is greatest when only adding 2 at% of Sb (Jain G. and Kumar R., 2004). But others (Kleinjan W.E. et al., 2008) use more heavily doped Sb:SnO2 (~13 at%) according to the maximal conductivity (0.03 S cm−1) obtained at that Sb content. These nanocomposites exemplify once more the origin of the σ variability.
According to Fig. 10a it is difficult to determine a priori from the nanoparticle materials how high the σ of the polymer nanocomposite will be. For electrostatic dissipation (σ > 10−6 S cm−1), however, most of these fillers are well suited (Mapkar J.A. et al., 2013). Electromagnetic interference shielding requires σ > 0.1 S cm−1 (Mapkar J.A. et al., 2013) whereas for high-end electronics the σ must be as high as possible to reduce ohmic heating. For the latter, Ag-based nanoparticles are usually the best filler for polymers (Fig. 10a).
In general, carbon-based and Sb:SnO2 nanoparticle fillers are ideal for an electrical conductivity from 10−6 to 10 S cm−1, whereas nanosilver-filled polymers are a reasonable choice for a σ between 10 −3 and 104 S cm−1. The required amount of nanoparticle fillers to reach this electrical conductivity range, however, varies significantly from below 0.1 to above 30 vol%. Fig. 10b shows the percolation threshold (pc) of polymer nanocomposites separated according to nanoparticle type. Likewise to the polymer nanocomposite conductivity (Fig. 10a), the pc deviates strongly between fillers. In contrast, though, rather than a material dependency, the pc is determined by the nanoparticle shape: High and low aspect ratio nanoparticles (CNTs, graphene, Ag NWs) are superior when conductivity should be reached with addition of the least nanoparticle amount to the polymer. Filling polymers with spherical nanoparticles (Ag and carbon NPs) requires the highest filler content. This is in agreement with percolation theory that predicts facilitated percolation for elongated/flat particles over spherical ones (Mutiso R.M. and Winey K.I., 2012). The Ag NW content in poly(styrene), for instance, can be reduced from 9 to 3.4 vol% by increasing the aspect ratio from 8 to 31 (White S.I. et al., 2010). Even more dramatic difference in pc is revealed in a nanocomposite of poly(ether etherketone) containing either spherical Ag NPs or Ag NWs (L/D = 220) (Rivière L. et al., 2016): The pc decreases by more than 10 vol% to 0.55 vol% when using the higher aspect ratio nanoparticle fillers.
The low pc of high aspect ratio nanoparticles has curbed the use of Ag NWs (He X. et al., 2014) and CNTs (Yu Z.B. et al., 2011) for preparing transparent electrodes. In fact, they have become prime candidates for replacing brittle indium tin oxide (Kumar A. and Zhou C.W., 2010) that many modern electronics (e.g., touchscreens) rely heavily on. Such polymer nanocomposites are always prepared as thin films since transparency is inversely proportional to thickness and nanoparticle filler content (Hu W. et al., 2012). Unfortunately, though, the conductivity is directly proportional to thickness and filler content so that a compromise (i.e. conductivity vs. transparency) becomes unavoidable.
Preparation of these nanowire- and nanotube-based (transparent) electrodes is done (Hu W. et al., 2012) predominantly by polymer infiltration (Fig. 3e). This ensures that the nanoparticles are touching or even sintered together (Coskun S. et al., 2013) before embedding in the polymer. A drawback of such electrodes, however, is the rather large fraction of nanocomposite surface area exhibiting no Ag NWs or CNTs for direct electron conduction (Noh Y.J. et al., 2013). These nanoparticle devoid areas are especially suboptimal for devices like photovoltaics (Noh Y.J. et al., 2013) and light emitting diodes (Triambulo R.E. et al., 2014) as they restrict efficient charge propagation from the semiconductor to the electrode.
4.5 Magnetic
A unique property of nano-sized ferromagnetic materials is their decreasing magnetic hysteresis with size (i.e. superparamagnetism) (Wiggers H., 2009). In other words, they are magnetic in the presence of a magnetic field but exhibit no remnant magnetization upon removing it (Nguyen D.T. and Kim K.-S., 2016). In contrast to dielectric and thermal/electric conductivity properties for which conventional bulk materials can be used, superparamagnetism is obtained only with nanoparticles (Nguyen D.T. and Kim K.-S., 2016) or nanocomposites made thereof (Sotiriou G.A. et al., 2013). Fig. 11 shows the saturation magnetization ratio of the nanocomposite (MNC) to that of the nanoparticle (MNP) as a function of filler content. The data points are extracted from published work (symbol shape and color). Iron oxide (magnetite, maghemite) and iron oxide alloys are the most common nanoparticle fillers.

As expected the polymer nanocomposite becomes more magnetic with increasing nanoparticle content. What remains obscure in Fig. 11 is that by adding nanoparticles with a higher MNP, a nanocomposite with greater saturation magnetization is obtained for the same filler content. Or alternatively, less nanoparticles need to be added to the polymer for reaching the same final MNC. This explains why magnetite (MNP = 92 emu g−1 (Dallas P. et al., 2006)) is more attractive than maghemite (MNP = 65 emu g−1 (Li D. et al., 2007)). Metal nanoparticles have a superior MNP over oxides but a protective coating to avoid rapid oxidation is required (Grass R.N. and Stark W.J., 2006). Such a coating, or for that sake, any surface modification, reduces the overall nanoparticle MNP.
Similar to composition, nanoparticle size plays a crucial role since too small nanoparticles exhibit inferior saturation magnetization (Li D. et al., 2007). Li D. et al. (2007) determined that flame-made γ-Fe2O3 reached the maximal MNP when dp = 13 nm. At half the size (dp = 6 nm), the MNP reduced to a third.
Fig. 11 shows that up to about 25 vol% nanoparticle content in a polymer the magnetization ratio already reaches 50 %. This non-linearity is removed, however when presented as a function of weight (Blattmann C.O., 2019) rather than volume content. Indifferent of this non-linearity, it can be recognized that most data are shown for nanoparticle contents below 15 vol% (enlarged area). The range < 5 vol% (encircled) is researched most often. This indicates the realistic upper content limit of superparamagnetic nanoparticles that can be added to the polymer. It agrees well with that of similarly sized (dp < 20 nm) silica nanoparticle in silicone rubber (Camenzind A. et al., 2010b): Above 6.2 vol% nanoparticle content, manufacture becomes difficult due to the accompanying high viscosity of the blending solution. It should be noted, though, that these superparamagnetic nanoparticles are prepared most often via wet-chemistry leading to separate spheres (Sahoo Y. et al., 2005). These are more easily dispersed than fractal-like aggregates like fumed silica (Camenzind A. et al., 2010a). Thus, a higher content of nanoparticle fillers theoretically can be added to the polymer. However, by wise selection of nanocomposite processing, a higher filler content can be achieved also with fractal-like nanoparticles. For example, Sotiriou G.A. et al. (2013) prepared micrometer-thin superparamagnetic PMMA nanocomposite cantilevers with over 10 vol% of flamemade γ-Fe2O3 nanoparticle fillers by polymer infiltration into a stabilized particle film (Fig. 3e).
4.6 Gas permeability
Developing and improving organic electronics for photovoltaics (Gaume J. et al., 2012) and light emitting diodes (Coskun S. et al., 2013) is pursued for the assembly of lightweight, flexible, inexpensive and more environmentally friendly devices. However, some of their components are extremely sensitive to oxygen or water so that under ambient conditions degradation occurs rapidly. To prolong the device life expectancy, their development needs to go hand-in-hand with that of thin transparent gas barriers (Gaume J. et al., 2012).
A completely different field, food packaging, relies just as heavily on inexpensive, consumer-appealing, non-toxic and protective polymers to enable long shelf-life (Duncan T.V., 2011). Restricting gas exchange is a key function of such polymeric films. Produce ripening or fouling during transport and at the grocery store, for example, can be reduced with adequate packaging materials.
Pure polymer films offer some protection against gas molecule penetration that, however, can be improved by adding nanoparticles (Duncan T.V., 2011). Fig. 12a shows the relative gas permeability (permeability of the nanocomposite PNC to that of the unfilled polymer PP) as a function of nanoparticle filler content. The data, extracted from published work (symbol shape and color), differentiates according to nanoparticle aspect ratio: spheres (circles) and platelets (diamonds). A PNC/PP less than unity (< 1) corresponds to an enhanced barrier effect, i.e. reduced gas permeability.
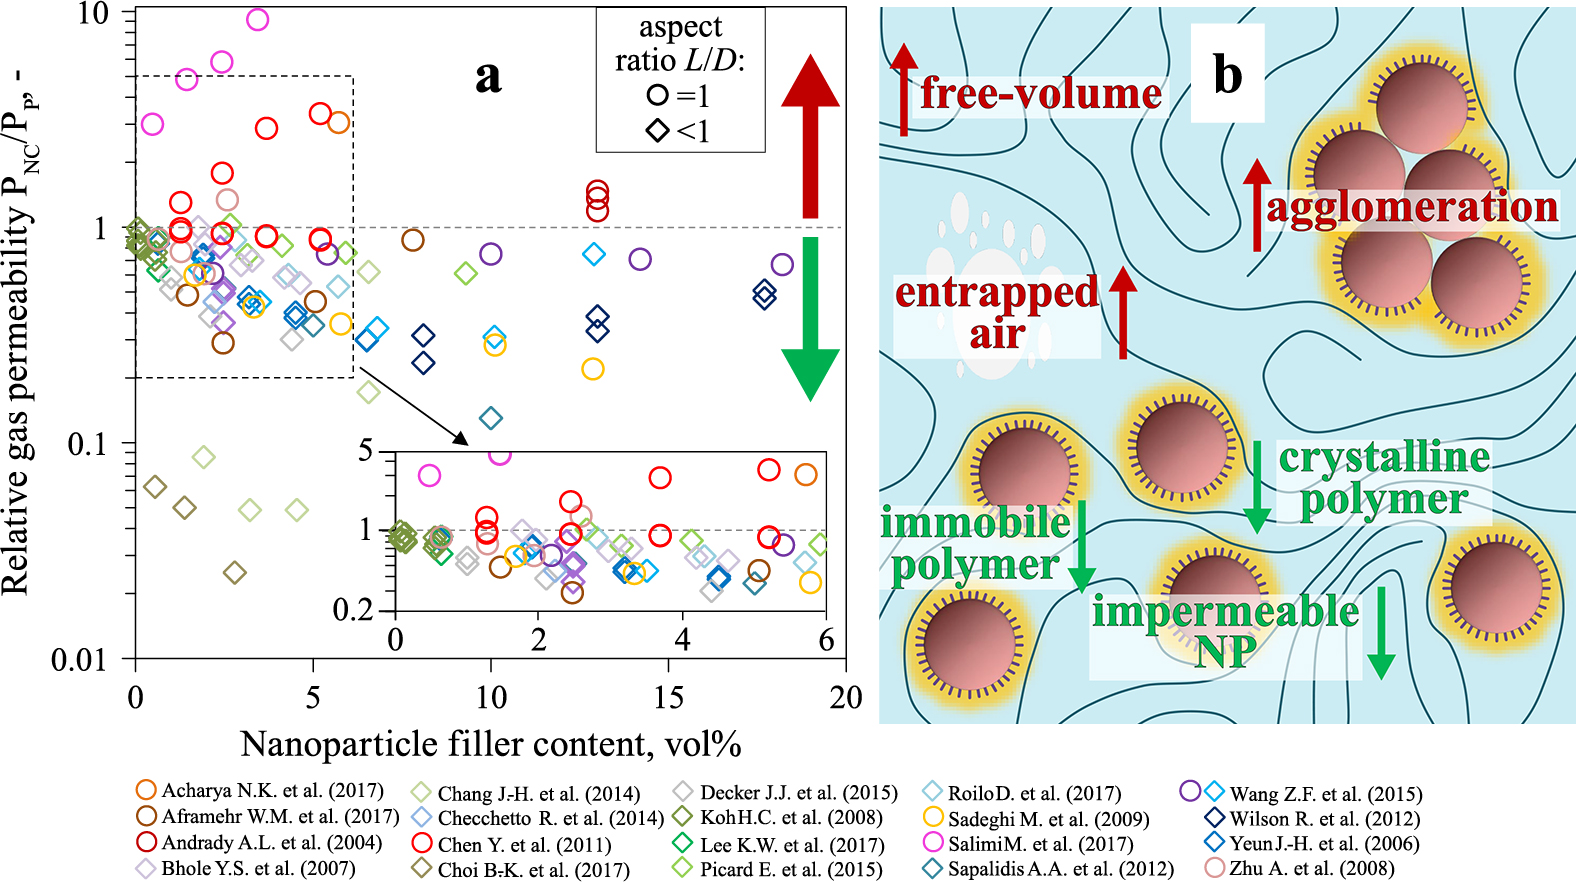
Fig. 12a clearly shows that the addition of nanoparticles most often reduces the relative gas permeability. Nanoplatelets are seemingly more effective than spherical nanoparticles according to the nanocomposite PNC/PP that rarely exceeds unity when adding nanoplatelets. So they are preferred by most researchers as is reflected by the indisputable greater quantity of diamonds than circles in Fig. 12a. This is attributed to the popularity to use natural clay nanoparticles (e.g., montmorillonite, saponite, bentonite) as they are non-toxic, transparent, lightweight and inexpensive (Chang J.-H. et al., 2014). Common employment of clay nanoplatelets also stems from the notion that the impermeable nanoparticle fillers create a tortuous (i.e. indirect) path for the passing gas molecule (Feldman D., 2013). For in-plane aligned platelets this barrier mechanism indisputably occurs but it does not reflect the entire picture. Fig. 12b schematically shows the major influences of nanoparticle fillers on the gas permeability of a nanocomposite. Those that reduce or increase the permeability are labeled with a green downward- or red upward-pointing arrow, respectively. Most of these effects are related to nanoparticle’s influence on the polymer chain mobility: In essence, decreasing the chain mobility reduces PNC/PP.
The addition of 2.2 vol% of exfoliated graphene oxide nanoplatelets to polyethylene was sufficient to reduce the nitrogen permeability to more than half of the pure polymer (Checchetto R. et al., 2014). This reduction of gas permeability is related to the 20 nm thick immobilized polymer that engulfs the nanoparticles and impedes gas molecules from passing. Quite surprising is that the immobilized polymer was formed even though no surface treatment was conducted to encourage nanoparticle-polymer interactions. The opposite effect (i.e. increasing permeability) was shown (Chen Y. et al., 2011) for spherical titania nanoparticles (5.2 vol%) in a thermoplastic PU. Poor interaction between particle and polymer increased the fraction of polymer free-volume, and therefore also the molecular chain mobility, leading to an increase of the nitrogen permeability ratio to > 3.3. After improving the nanocomposite manufacturing, however, the polymer-nanoparticle interaction could be enhanced improving the nanocomposite N2 barrier properties (PNC/PP < 0.9).
Similar to immobilized polymer surrounding nanoparticle fillers (Checchetto R. et al., 2014), polymer crystallites restrict chain mobility suppressing the gas flow. In fact, pure semi-crystalline poly(ethylene terephthalate) (Hu Y.S. et al., 2005) is used on a standard basis for carbonated beverage bottles. Adding nanoparticles to those polymers, however, can influence crystallite formation. For example, the crystallinity of crosslinked poly(vinyl alcohol) (PVA) is increased (Choi B.-K. et al., 2017) by adding graphene oxide nanoparticles because of their crystal nucleating effect on the polymer. This had enabled a steady decrease of the oxygen permeability with filler content. In carbon black filled PLA the nanoparticle nucleating effect also promoted higher polymer crystallinity making subsequent thermal annealing superfluous (Delgado P.A. et al., 2016). There, the enhanced crystallinity was considered to be the primary reason for increasing the mechanical stability.
It cannot be generalized, though, that adding nanoparticles leads to a more crystalline polymer: Well dispersed carbon nanoparticles in PLA enhanced the crystallization rate but had little effect on final crystallinity (Sobkowicz M.J. et al., 2011). There the polymer crystallites were smaller but more numerous. In contrast, a significant reduction of polymer crystallinity was observed in a nanoclay-PVA composite (Sapalidis A.A. et al., 2012). This reduction was attributed to the strong nanoparticle-polymer interfacial interaction that encouraged amorphous immobilized PVA to form rather than polymer crystallites. Nevertheless, this reduced the PNC/PP of the nanocomposite to 0.13 at 10 vol% nanoparticle filler content.
Fig. 12a shows that most work reports nanocomposites with a nanoparticle filler content < 10 vol%. In fact, this happens to be the range up to which the greatest reduction of permeability is observed. At higher contents the benefits are outweighed due to nanoparticle agglomeration (Picard E. et al., 2015), entrapped air (Salimi M. et al., 2017) and highly mobile polymer free-volume (Wilson R. et al., 2012). These unwanted effects frequently occur simultaneously to one another due to impeded nanocomposite processing at high nanoparticle contents.

 https://ror.org/05a28rw58


;%0A%09%09%09newWindow.document.open();%0A%09%09%09newWindow.document.write('<img src=%22./Graphics/36_2019015_13.jpg%22>');%0A%09%09%09newWindow.document.close();%0A%09%09)
;%0A%09%09%09newWindow.document.open();%0A%09%09%09newWindow.document.write('<img src=%22./Graphics/36_2019015_14.jpg%22>');%0A%09%09%09newWindow.document.close();%0A%09%09)