Original Research Papers
Hydrodynamic Study of a Circulating Fluidized Bed at High Temperatures: Application to Biomass Gasification
2019 年 36 巻 p. 271-293

詳細
2019 年 36 巻 p. 271-293
Experimental data on the hydrodynamic behavior of dense and circulating fluidized beds at high temperatures are scarce in the literature. This work deals with the hydrodynamic study of a Fast Internally Circulating Fluidized Bed (FICFB) used for biomass gasification. The first part of this study investigates the influence of the bed temperature (between 20 and 950 °C) and the nature of fluidizing gas (air or steam) on the hydrodynamic parameters of a dense fluidized bed of olivine particles (i.e. minimum fluidization velocity and voidage as well as average voidage). Three olivine batches are used with a mean Sauter diameter of 282, 464 and 689 μm, respectively. Experimental results are compared with different empirical correlations from the literature to evaluate their validity under elevated temperature conditions. Besides, two dimensionless correlations calculating the minimum fluidization velocity and average bed voidage are proposed. The second part of this study focuses on the hydrodynamic behavior of an FICFB operating between 20 and 850 °C. The effect of different process parameters (i.e. bed material nature, air velocity, solids inventory, bed temperature) on the solids circulation flow rate is investigated. It was found that the transport velocity Utr is not affected by the bed temperature and the bed material inventory. It mainly depends on the terminal settling velocity Ut of bed material particles. Besides, key parameters controlling solids flow rate are the combustor gas velocity and the solids inventory. An increase in these parameters leads to a higher circulation flow rate.
High-temperature biomass gasification is a promising alternative to fossil fuel for power generation and the production of fuel via methanation or the Fisher-Tropsch process. The reactive system of biomass conversion is an endothermic process. To maintain a fixed temperature in the reactor, a contribution of energy is required. Two types of technology exist for biomass gasification depending on the method of heat transmission (Gómez-Barea and Leckner, 2010; Ruiz et al., 2013). On the one hand, the heat can be provided by “in-situ” combustion. This process includes the fixed bed gasifiers (up-draft and downdraft) and the “bubbling fluidized bed” gasifiers. In these types of reactors, the biomass undergoes drying, pyrolysis, partial combustion of volatile matters and char and finally gasification of char. On the other hand, the heat can be supplied by the “ex-situ” combustion of char. One of the most promising technologies using “ex-situ” combustion is the Fast Internally Circulating Fluidized Bed (FICFB) (Hofbauer et al., 2002). The facility used in this study is of FICFB type. Its principle relies on the circulation of a medium (sand, olivine or catalyst particles) acting as a heat carrier between an endothermic reactor and an exothermic reactor. In the first one (called gasifier), which operates at around 750 °C–850 °C, biomass is continuously fed into a dense fluidized bed containing the heat transfer medium (olivine particles) fluidized by superheated steam. The biomass thermochemical conversion leads to the production of synthesis gas and a solid carbonaceous residue called char. Bed material (olivine and unconverted char) is continuously discharged through a dump to a transported fluidized bed reactor called “Combustor” that is fed by preheated combustion air. In this reactor, which operates at around 850 °C–950 °C, combustion of part of the char coming from the gasifier induces olivine particle heating. At the outlet of the combustor, olivine particles are separated from flue gas by a cyclone and are returned to the gasifier through a standpipe. Thus, the heat needed for endothermic steam-gasification is provided by the ex-situ combustion of residual char. The FICFB biomass gasification efficiency is strongly dependent on a thermal equilibrium between gasification zone and combustion zone. This equilibrium is controlled by the temperature difference and circulating solids flow rate between the two reaction zones. However, this last parameter also depends on the process operating conditions (i.e. bed inventory, gas velocity, bed temperature), and cannot be imposed. Thus, it appears essential to identify the process key parameters which enable control of the circulating medium flow rate.
Besides, it is well known that the hydrodynamic behavior of an FICFB affects heat and mass transfer and therefore the overall reaction rate. In the literature, current knowledge on the hydrodynamic behavior of dense and circulating fluidized beds was essentially acquired at ambient operating conditions and a lack of information is noticed on the effect of temperature.
1.1 Brief review on bubbling fluidized bed hydrodynamic studyShabanian and Chaouki (2017) recently reviewed the effects of temperature, pressure and interparticle forces on the fluidization characteristics of gas-solid dense fluidized beds for a wide spectrum of particles belonging to group A, B and D of the Geldart classification (Geldart, 1973).
For Geldart class-B particles with no interparticle forces and at atmospheric pressure, the minimum fluidization velocity decreases as the temperature increases (Mii et al., 1973; Pattipati and Wen, 1981; Botterill et al., 1982a; Botterill et al., 1982b; Svoboda et al., 1983; Hartman and Svoboda, 1986; Grace and Sun, 1991; Llop et al., 1995; Formisani et al., 1998). The authors explain this trend by the fact that the increasing viscosity, with a rise in bed temperature, is the controlling factor for class-B particles. Some authors also investigated the effect of mean particle diameter on minimum fluidization velocity (Geldart, 1972; Stubington et al., 1984; Fatah, 1991; Tannous, 1993; Gauthier et al., 1999). The authors agreed to say that minimum fluidization velocity increases with mean particle size. Besides, many authors proposed correlations to estimate the minimum fluidization velocity (Wen and Yu, 1966; Bourgeois and Grenier, 1968; Richardson, 1971; Saxena and Vogel, 1977; Babu et al., 1978; McKay and McLain, 1980; Svoboda et al., 1983; Chitester et al., 1984; Thonglimp et al., 1984; Nakamura et al., 1985; Lucas et al., 1986; Chyang and Huang, 1988; Murachman, 1990; Fatah, 1991 and Tannous et al., 1994). They are listed in Table 1. The correlations proposed were often derived from the Ergun equation (Ergun, 1952) for pressure drop through a packed bed calculation (Equation 1):
| Authors | Particle mean diameter (μm) | Particle apparent density (kg · m−3) | Shape factor ϕ (−) | Fluidizing agent | Bed temperature (°C) | Reactor pressure (bar) | Correlations |
|---|---|---|---|---|---|---|---|
| Tannous et al. (1994) | 725–3900 | 1016–3950 | 0.62–1 | Air | Ambient | 1.013 | Remf = (25.832 + 0.043·Ar)0.5 − 25.83 |
| Wen and Yu (1966) | 2050–6350 | 2360–7840 | 1 | H2O | Ambient | 1.013 | Remf = (33.72 + 0.0408·Ar)0.5 − 33.7 |
| Bourgeois and Grenier (1968) | 86–2510 | 1200–19300 | 1 | Air and H2O | Ambient | 1.013 | Remf = (25.462 + 0.03824·Ar)0.5 − 25.46 |
| Richardson (1971) | Spherical and non-spherical particles | Remf = (25.72 + 0.0365·Ar)0.5 − 25.7 | |||||
| Saxena and Vogel (1977) | 650–704 | 1900–2460 | 0.73–0.98 | Air | 18–427 | 1.79–8.34 | Remf = (25.282 + 0.0571·Ar)0.5 − 25.28 |
| Babu et al. (1978) | 50–2870 | 2560–3924 | 0.63–0.74 | Air–CO2–N2–H2O–Chlorofluorocarbon | Ambient | 1.013–69.914 | Remf = (25.252 + 0.0651·Ar)0.5 − 25.25 |
| McKay and McLain (1980) | 9486–28690 | 1140–1490 | 0.387–0.417 | H2O | Ambient | 1.013 |
|
| Svoboda et al. (1983) | 565–1125 | 1680–3330 | 0.524–0.819 | Air | 20–890 | 1.013 |
|
| Chitester et al. (1984) | 88–374 | 1116–2472 | n.r. | N2 | Ambient | 1.013–6.306 | Remf = (28.72 + 0.0494·Ar)0.5 − 28.7 |
| Thonglimp et al. (1984) | 180–2125 | 1607–7425 | 1 | Air | Ambient | 1.013 | Remf = (31.62 + 0.0425·Ar)0.5 − 31.6 |
| Nakamura et al. (1985) | 200–4000 | 2500 | 1 | N2 | 7–527 | 1–50 | Remf = (33.952 + 0.0465·Ar)0.5 − 33.95 |
| Lucas et al. (1986) | Correlation from data in literature | Remf = (29.52 + 0.0357·Ar)0.5 − 29.5 | |||||
| Chyang and Huang (1988) | 699–6062 | 910–6860 | Air–Argon | 15–830 | 1.013 | Remf = (33.32 + 0.0333·Ar)0.5 − 33.3 | |
| Murachman (1990) | 109–917 | 1480–3910 | 0.77–0.92 | Air | 20–900 | 1.013 | Remf = 0.0016·Ar0.9 |
| Fatah (1991) | 1000–3570 | 3950 | 0.48–0.89 | Air | 15–725 | 1.013 |
|
n.r.: non-reported
| (1) |
where ΔP is the pressure drop (Pa), U is the fluid superficial velocity (m · s−1), ɛ is the bed average voidage (−), L is the bed height (m), μf is the fluid viscosity (Pa · s), ϕ is the shape factor (−), dp is the mean particle diameter (m) and ρf is the fluid density (kg · m−3).
Considering minimum fluidization as the transitional state between fixed bed and fluidized bed, the pressure drop through the fixed bed, defined in Equation 1, is equal to the bed weight per unit area. By using dimensionless Reynolds and Archimedes numbers, the Ergun equation at minimum fluidization leads to Equation 2:
| (2) |
with:
| (3) |
where Ar is the Archimedes number (−), Remf is the Reynolds number at minimum fluidization (−), ɛmf is the minimum fluidization voidage (−), Umf is the minimum fluidization velocity (m · s−1), g is the acceleration due to gravity (m · s−2) and ρp is the particle apparent density (kg · m−3). Equation 2 may be rearranged to Equation 4, where K1 and K2 are constant numbers depending on the minimum fluidization voidage and shape factor.
| (4) |
By solving Equation 4, Remf can be expressed as a function of Ar (Equation 5).
| (5) |
where:
| (6) |
Several authors attempted to estimate C1 and C2 through experimental data at various operating conditions (Table 1). However, studies performed at high temperatures are scarce in the literature. Most of the correlations were established at ambient temperature, as reported in Table 1. However, it is known that the bed temperature greatly influences viscosity and density of gas, thus making the use of these correlations a source of errors.
Regarding minimum fluidization voidage, it was found to slightly increase with bed temperature (Botterill et al., 1982a; Botterill et al., 1982c; Llop et al., 1995; Formisani et al., 1998). Besides, the effect of mean particle size on this parameter is a source of controversy. Through experiments carried out with various bed materials belonging to group A and B of the Geldart classification (coal, sand, glass, coke, ceramic, carborundum, anthracite, cracking catalyst…), different trends were observed (Lewis et al., 1949; Matheson et al., 1949; Agarwal and Storrow, 1951; Van Heerden et al., 1951; Rowe, 1965; Geldart, 1972). When mean particle size increases, minimum fluidization voidage is found: to decrease according to Matheson et al. (1949), Agarwal and Storrow (1951), Rowe (1965), and Geldart (1972), to increase in the work of Van Heerden et al. (1951), and to remain unchanged for Lewis et al. (1949).
Finally, studies about average bed voidage showed that there is no influence of bed temperature for Geldart class-B particles (Botterill et al., 1982a; Botterill et al., 1982c). According to the authors, this parameter only depends on excess gas velocity (U-Umf). The effect of mean particle size on average bed voidage was also investigated with various bed materials (ballotini crystal, cracking catalyst and sand particles) (Lewis et al., 1949; Rowe, 1965; Geldart, 1972). The authors found that the average bed voidage decreases as the mean particle size increases. Besides, several correlations were proposed in order to estimate the average bed voidage (Lewis et al., 1949; Matsen et al., 1969; Thonglimp et al., 1984; Chyang and Huang, 1988; Hilal and Gunn, 2002). These correlations are given in Table 2, and were established from experimental data obtained in gas-solid and liquid-solid reactors, or from the two-phase theory assuming that excess gas regarding minimum fluidization crosses the bed as bubbles.
| Authors | Particle mean diameter (μm) | Particle apparent density (kg · m−3) | Shape factor ϕ (−) | Fluidizing agent | Bed temperature (°C) | Reactor pressure (bar) | Correlations |
|---|---|---|---|---|---|---|---|
| Thonglimp et al. (1984) | 180–2125 | 1600–7425 | 1 | Air | Ambient | 1.013 | ɛ = 1.57·Re0.29·Ar−0.19 |
| Chyang and Huang (1988) | 699–6062 | 910–6860 | n.r. | Air–Argon | Ambient | 1.013 | ɛ = 1.05·Re0.30·Ar−0.17 |
| Lewis et al. (1949) | 100–570 | n.r. | n.r. | H2O | Ambient | 1.013 |
|
| Matsen et al. (1969) | Two-phase theory |
|
|||||
| Hilal and Gunn (2002) | 50–1000 | 1228–11400 | n.r. | Air | Ambient | 1.013 |
|
n.r.: non-reported
Circulating fluidized bed technologies have been used since 1940 for the Fuel Catalytic Cracking process (FCC) (Lim et al., 1995; Grace et al., 1997). In spite of this, the phenomena involved were not investigated until the 1970s (Yerushalmi et al., 1976). Lim et al. (1995) and Berruti et al. (1995) reported that circulating fluidized bed reactors offer several common advantages compared to conventional low-velocity bubbling and turbulent fluidized bed reactors. These advantages are: favorable gas-solids contact efficiency due to high slip between gas and solids, a more uniform distribution of solids due to reduced gas bypassing, reduced axial gas and solids back-mixing, higher gas throughput, independent gas and solids retention time control, improved turndown and possible separate gaseous reactant zones.
A large number of works in the literature are devoted to the identification of the fluidization regimes in risers. Yerushalmi et al. (1976) focused on the identification of transition velocities between bubbling, plugging and turbulent regimes at ambient temperature for class-A particles of the Geldart classification. The authors highlighted two characteristic velocities, Uc and Uk, which correspond to transition and complete turbulent fluidization velocities, respectively. For a gas velocity lower than Uc, bed pressure drop standard deviation increases to a peak as a result of a bubble coalescence phenomenon. Between Uc and Uk, internal solids circulation yields to bubbles breakup and decreases pressure drop standard deviation. Beyond Uk, the pressure drop standard deviation stabilizes and solid particles begin to be carried in the gaseous flow. These two velocities (i.e. Uc and Uk) are easily measurable for class-A particles but are not well-defined for other class particles. Chehbouni et al. (1994) denied the existence of turbulent velocity Uk for Geldart class-B particles. They concluded that the onset of turbulent fluidization is at Uc, and velocity Uk is an artefact due to the use of differential pressure transducers.
There is more than one technique for measuring the transport velocities of particles. Those recorded in the literature include determination of the flooding point (Yerushalmi and Cankurt, 1979), determination of the pressure drop at the bottom of the column as a function of the solids circulation flux at different gas velocities (Yerushalmi and Cankurt, 1979), determination of the maximum solids circulation flux at different gas velocities (Schnitzlein and Weinstein, 1988), and determination of the emptying times of a fast fluidization column (Han et al., 1985). According to Adanez et al. (1993), the last technique is the most attractive because the measurement is simple and quick to conduct.
By measuring the solids flow rate versus the gas velocity, Yerushalmi and Cankurt (1979) also reported the existence of a characteristic particle transport velocity Utr, which corresponds to the onset of a fully transported bed flow.
Several authors attempted to estimate the influence of column diameter as well as solids properties and hold-up on the transition velocities Uc, Uk and Utr at ambient temperature (Fan et al., 1983; Han et al., 1985; Mori et al., 1986; Lee and Kim, 1990; Perales et al., 1991b; Bi and Fan, 1992; Adanez et al., 1993; Tannous, 1993; Chehbouni et al., 1995). Most authors concluded that turbulent transition velocities increase with column diameter, for the same solids static height (Rhodes and Geldart, 1986; Grace and Sun, 1991; Chehbouni et al., 1995). This phenomenon is attributed to the effect of column diameter on bubble size. For a given gas velocity, an increase in column diameter leads to the formation of smaller bubbles which reduces internal solids circulation in the bed and delays the onset of the turbulent regime. Transport velocity Utr also increases with column diameter. The solids static height was found to have a very low influence on turbulent transition and transport velocities (Werther, 1974; Satija and Fan, 1985; Chehbouni et al., 1995). Moreover, an increase in particle size and density leads to higher transition characteristic velocities Uc and Uk and transport velocity Utr (Cai et al., 1990; Chehbouni et al., 1995). Lee and Kim (1990) showed that the transition turbulent fluidization velocity Uc is almost equal to the terminal settling velocity of single particles Ut for class-B particles. Furthermore, very recent studies have proved that the particle size distribution (PSD) has an influence on the transition velocity Uc, which was found to be higher for materials with a wider PSD (Chehbouni et al., 1995; Rim and Lee, 2016). Experimental data showing the influence of bed temperature on transition velocities are scarce in the literature. According to Bi and Grace (1996), a rise in temperature might cause a shift towards lower transition velocities. Besides, some correlations were proposed in the literature in order to estimate the transport velocity Utr (Mori et al., 1986; Lee and Kim, 1990; Perales et al., 1991a; Perales et al., 1991b; Bi and Fan, 1992; Adanez et al., 1993; Tannous, 1993; Chehbouni et al., 1995; Ryu et al., 2003; Goo et al., 2010). These correlations are reported in Table 3, and were established at ambient temperature, for air as the fluidizing agent and for class-B particles.
| Operating conditions at which the correlations were established | ||||||
|---|---|---|---|---|---|---|
| Authors | Particle mean diameter (μm) | Particle apparent density (kg · m−3) | Fluidizing agent | Bed temperature | Class of particles | Correlations |
| Mori et al. (1986) | 56–134 | 729–2400 | — | — | B | Retr = 1.41·Ar0.56 |
| Lee and Kim (1990) | 24–205 | 1250–2500 | Air | Ambient | B | Retr = 2.916·Ar0.354 |
| Perales et al. (1991b) | 325–975 | 2650 | Air | Ambient | B | Retr = 1.41·Ar0.483 |
| Perales et al. (1991a) | n.r. | n.r. | Ambient | Ambient | B | Utr = 1.7·Ut |
| Bi and Fan (1992) | 325 | 660 | Air | Ambient | B | Retr = 2.28·Ar0.419 |
| Adanez et al. (1993) | 80–900 | 1400–2600 | Air | Ambient | B | Retr = 2.078·Ar0.463 |
| Tannous (1993) | 715–2800 | 1016–2650 | Air | Ambient | B | Retr = 1.834·Ar0.448 |
| Ryu et al. (2003) | 181 | 4080 | Air | 25–600 | B |
|
| Chehbouni et al. (1995) | 23.6–5000 | 660–4510 | Air | Ambient | A, B, C and D |
|
| Goo et al. (2010) | 210–380 | 2500 | Air | 20–600 | B | Retr = 2.001·Ar0.405 |
By varying the gas velocity for a fixed circulating solids flow rate, Yates (1996) and Shamlou (2013) defined a characteristic velocity called choking velocity Uch. It corresponds to the transition between dense phase flow and dilute phase flow. These authors showed that Uch increases with particle size and circulating solids flow rate.
Basu and Cheng (2000) investigated the influence of operating parameters on the performance of a CFB equipped with a loop seal. This work was performed at ambient temperature with sand particles (dp = 250 μm). The authors showed that a rise in both the total weight of solid particles in the process (inventory) and the loop seal air velocity leads to an increase in the circulating solids flow rate. Besides, studies carried out by Bull (2008) and Detournay (2011) focused on the hydrodynamic of a circulating fluidized bed biomass gasifier at ambient temperature using olivine (dp = 250 μm) and sand particles (dp = 316 μm) as media. Results showed that gas velocity in the riser (combustor) and total inventory are the main parameters which influence the circulating solids flow rate.
The present work is divided into two parts. The first part aims to determine the influence of operating conditions such as bed temperature (ranging from 20 to 950 °C), mean particle size (between 282 and 689 μm) and fluidizing gas nature (air or steam) on the hydrodynamic parameters of a dense fluidized bed of olivine particles (i.e. minimum fluidization velocity and voidage as well as average voidage). The purpose of the second part is to identify the key parameters controlling the circulating solids flow rate, as well as their effect on solids circulation.
All the experiments were conducted in the FICFB presented below (Fig. 1). The process contains two reactors whose connections enable an interchange of solids. The gasifier (internal diameter = 214 mm) is a dense fluidized bed of bed material particles. For this hydrodynamic study, it is fluidized either by super-heated steam or by air. The bed material is continuously discharged from the gasifier to the combustor through a dump. The combustor (internal diameter = 104 mm) is a transported fluidized bed, fed by preheated air separated into two streams (Fig. 2). The first one, named “primary air”, ensures a dense fluidized bed at the bottom of the combustor. The second stream, called “secondary air”, is used for particle transport. It is fed by an injection cane at an adjustable height. At the top of the combustor, a cyclone is used to separate transported particles from air. Then, solids are recycled back to the gasifier through the standpipe, equipped with an L-valve placed on the base and fluidized by steam or air.

Circulating fluidized bed biomass gasifier (a: pilot plant; b and c: pressure and temperature tap positions in the gasification section and in the combustion section, respectively).
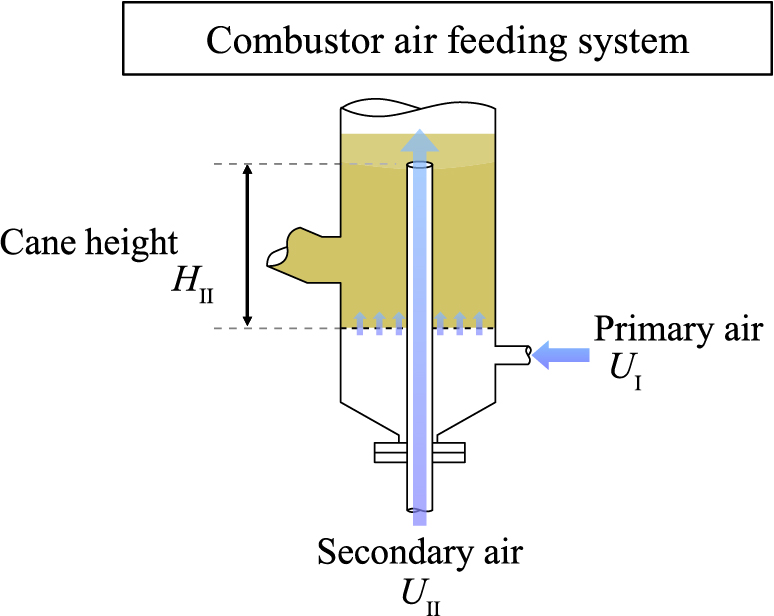
Distribution of combustion air in the combustor.
Gasifier and combustor are surrounded by electric furnaces with 15 and 5.7 kW electric output, respectively. Gasifier and combustor temperatures can be controlled independently by two PID controllers. Nevertheless, carrying out tests at temperatures higher than 500 °C also requires the use of natural gas feeding in the combustor, precisely at 40 cm above the distributor.
The pilot plant is equipped with 23 pressure sensors and 20 temperature sensors (Fig. 1). The circulating solids mass flow rate is measured with a microwave probe (supplier: SWR Engineering, model: SolidFlow 2.0), previously calibrated, located in the standpipe, 50 cm below the base of the combustor cyclone (Fig. 1).
At the outlet of each reactor, a burner associated with a post-combustion chamber heated to 850 °C allows the burning of all combustible gas. Then, gas streams are mixed together in a cylindrical chamber and cooled down in a 5-m multitubular exchanger. A cyclone and a bag filter ensure the filtration of fine particles before rejecting gas into the atmosphere.
2.2 Bed material pretreatment and characterizationMost of the experiments presented in this study were carried out with olivine particles provided by the Austrian manufacturer Magnolithe GmbH as bed material. Nevertheless, some tests were also performed with sand particles. As shown in Table 4, olivine particles are essentially made of magnesium oxide, silicon oxide and iron oxide. The latter reaches 10.5 wt% in our case. Regarding sand particles, they are mainly made of silicon oxide. Before their use as bed material in the gasifier, the particles previously underwent:
| Type of particle | Sand | Olivine batch [200–300 μm] | Olivine batch [300–400 μm] | Olivine batch [400–600 μm] |
|---|---|---|---|---|
| Chemical formula | SiO2 | (Fex, Mg1−x)2SiO4 | ||
| Composition | SiO2: 98.34 % Fe2O3: 0.022 % Al2O3: 1.206 % TiO2: 0.03 % CaO: 0.014 % K2O: 0.745 % |
MgO: 47.5–50.0 % SiO2: 39.0–42.0 % CaO: max. 0.4 % Fe2O3: 8.0–10.5 % |
||
| Skeletal density ρs (kg · m−3) | 2,650 | 3,265 | ||
| Internal voidage χ (%) | 9 | 7 | ||
| Particle density ρP (kg · m−3) | 2,400 | 2,965 | ||
| Aerated bulk density ρBA (kg · m−3) | 1,519 | 1,344 | 1,368 | 1,445 |
| Packed bulk density ρBP (kg · m−3) | 1,643 | 1,500 | 1,513 | 1,643 |
| Mean aerated bulk bed voidage ɛBA (−) | 0.49 | 0.53 | ||
| Mean packed bulk bed voidage ɛBP (−) | 0.45 | 0.48 | ||
| Angle of repose (°) | 33.2 | 29.6 | — | — |
| Compressibility factor: γ = 100 · (ρBP-ρBA)/ρBP (%) | 8 | 10 | 10 | 12 |
| Shape factor (−) | 0.85 | 0.85 | — | — |
| d10 (μm) | 190 | 188 | 337 | 508 |
| d50 (μm) | 305 | 300 | 483 | 709 |
| d90 (μm) | 488 | 475 | 689 | 1,015 |
| d3/2 (μm) | 285 | 282 | 464 | 689 |
| d4/3 (μm) | 324 | 318 | 501 | 741 |
| Cv = (d90-d10)/d50 (−) | 0.98 | 0.96 | 0.73 | 0.72 |
| Specific surface area (m2 · g−1) | — | 0.73 | — | — |
During these stages, carried out in the gasifier, the gas velocity was maintained at 8 times the minimum fluidization velocity (U = 8·Umf) at the considered temperature. After this treatment, the particle size distribution, particle density, skeletal density, aerated bulk density, packed bulk density, angle of repose, internal voidage, specific surface area and shape factor were measured using Laser Diffraction Particle Sizing MS2000, Mercury Porosimetry, Hosokawa analyzer, Helium Pycnometry, BET analyzer and G3 Morphology, respectively. Based on the values of the mean Sauter diameter and particle density reported in Table 4 for both sand and olivine, it can be concluded that the particles used in this work belong to the Geldart class B. Besides, the particles have a low compressibility factor γ (lower than 15 %), meaning that they have an excellent flow. Otherwise, the particles employed are minimally porous, with internal voidage of 9 % and 7 % for sand and olivine particles, respectively.
In this work, Sauter diameter (d3/2) is considered as the mean particle size.
This part of the study focusses on the effect of bed temperature, particle size distribution and fluidization gas nature (air or steam) on minimum fluidization velocity (Umf) and bed voidage (ɛmf), as well as on average voidage (ɛ) of the olivine particle dense fluidized bed. Experiments are performed in the gasifier, isolated from the combustor and the circulation loop. For each test, the total olivine particle inventory in the gasifier is 40 kg. In addition, some tests are carried out in the combustor, isolated from the gasifier and the circulation loop, in order to confirm the conclusions drawn in the gasifier for a reactor with a different diameter. For each test performed in the combustor, the total olivine inventory is 7 kg.
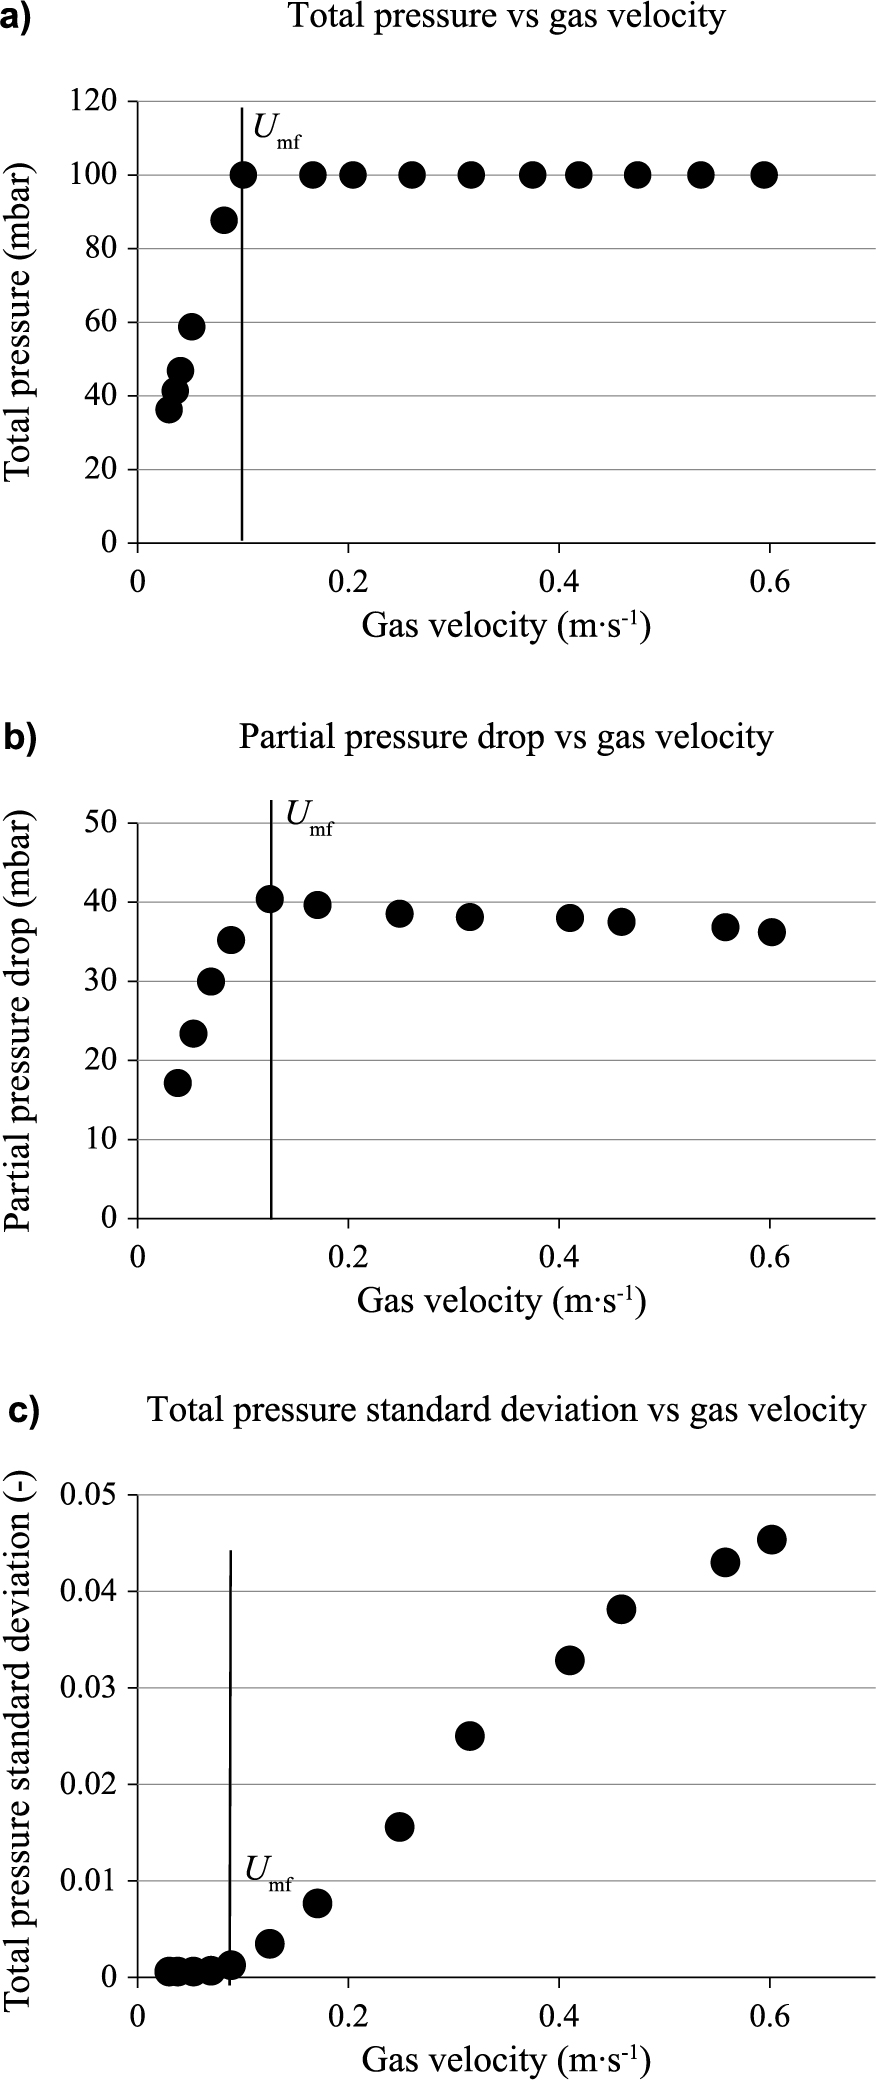
3.1 Determination methodsFor each experiment, the bed was first vigorously fluidized and the pressures along the reactor were measured. Then, the gas velocity was decreased and the pressures were measured again. From the experimental results, the minimum fluidization velocity was estimated through (Botterill et al., 1982a; Murachman, 1990; Fatah, 1991; Tannous, 1993):
Methods used for the determination of Umf.
| (7) |
where σZ is the standard deviation of the parameter Z, Ne is the number of data, Zi is the value of Z at a given time, and
These methods lead to similar results, with a relative error always under 10 %.
From the experimental results, the bed average voidage and minimum fluidization voidage can also be calculated. The bed average voidage is obtained by measuring and plotting the axial pressure profiles at several gas velocities (Fig. 4a). For gas velocities lower than the minimum fluidization velocity, the axial pressure profiles converge at the same height, i.e. the aerated fixed bed height. For gas velocities higher than the minimum fluidization velocity, the axial pressure profiles are parallels and lead to heights increasing with gas velocity. Thus, for a given weight of olivine particles, the average bed voidage is calculated as below:

Methods used for the determination of ɛ and ɛmf.
| (8) |
where ɛ, mp, Ac, H and ρP are the bed average voidage, the solids inventory (kg), the cross-section of the gasifier (m2), the dense fluidized bed height (m) and the particle density (kg · m−3), respectively.
Regarding the minimum fluidization voidage, it is calculated using the bed height at minimum fluidization velocity (i.e. the aerated fixed bed height) and Equation 8. It is also determined from the method recommended by Botterill et al. (1982c) and Lucas et al. (1986). This method consists in plotting the bed average voidage, calculated through Equation 9, against the superficial gas velocity, and calculating the minimum fluidization voidage by extrapolating the results for U = Umf. A typical example is illustrated in Fig. 4b. The blackened part of the curve, for gas velocities under the minimum fluidization velocity, corresponds to operating conditions where Equation 9 is not valid. The two methods lead to very close results.
| (9) |
Fig. 5a shows the effect of bed temperature on the minimum fluidization velocity of three olivine batches. For the same mean particle size, the minimum fluidization velocity decreases as temperature increases. Besides, minimum fluidization velocity increases with mean particle size for a fixed bed temperature. These trends are consistent with the results reported in the literature (Mii et al., 1973; Pattipati and Wen, 1981; Botterill et al., 1982a; Botterill et al., 1982b; Svoboda et al., 1983; Hartman and Svoboda, 1986; Grace and Sun, 1991; Llop et al., 1995; Formisani et al., 1998; Gauthier et al., 1999). In addition, the Remf range is between 0.07 and 14 in our operating conditions. However, the first term in Equation 1 on the right-hand side, representing the pressure loss through viscous effects, is the dominant term in the laminar flow region (Re < 10). This indicates that Equation 1 can be rearranged to Equation 10.
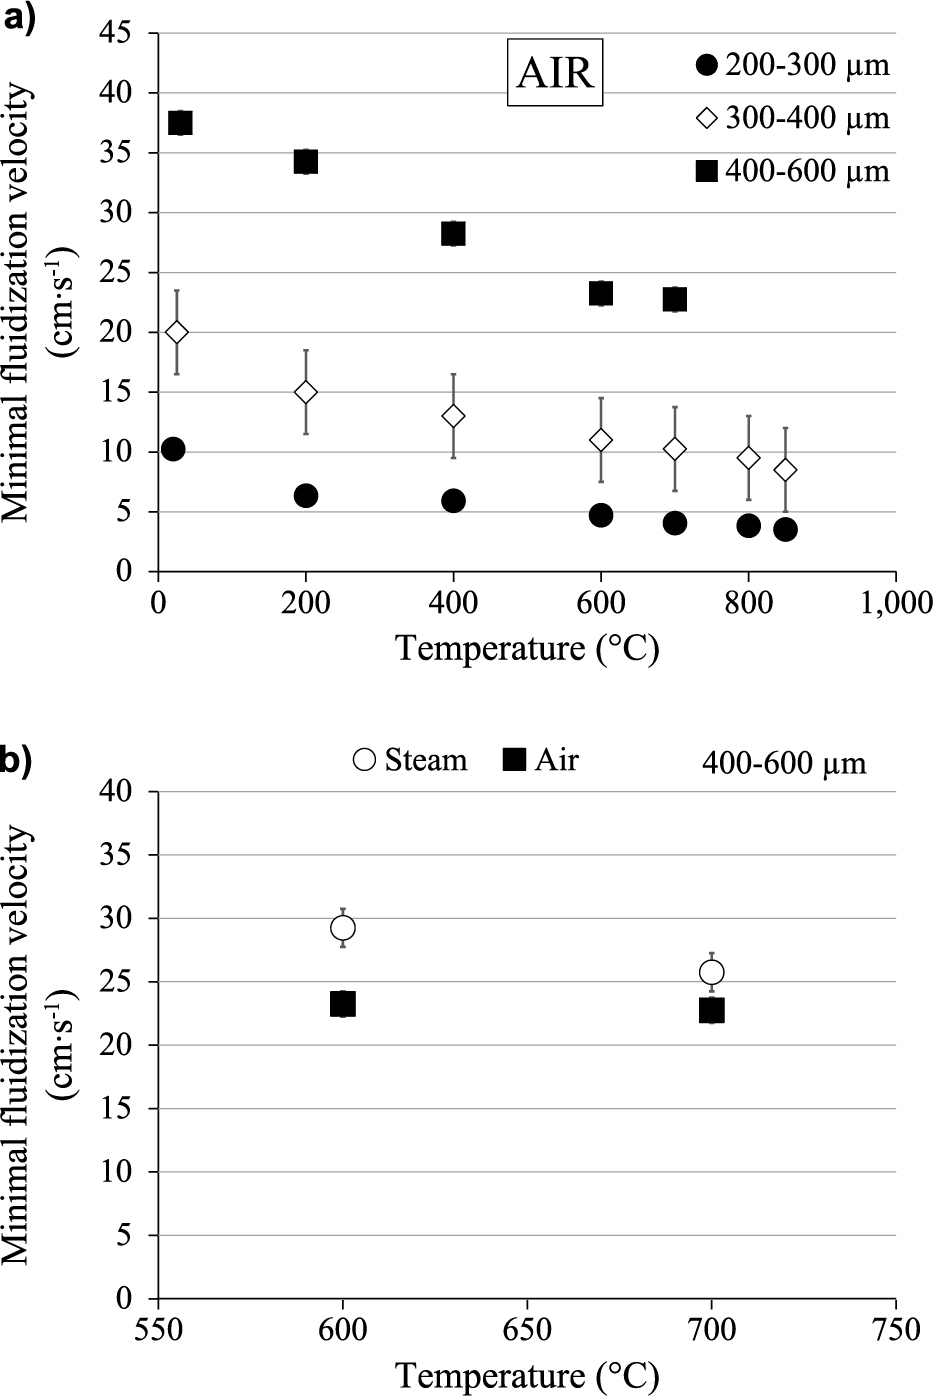
Bed temperature effect on Umf for different olivine batches (a) and for two fluidizing gases (b).
| (10) |
This equation shows that for fine particles, the viscous drag force (related to gas viscosity) has a major effect on the minimum fluidization velocity. Thus, an increase in gas viscosity with bed temperature leads to a rise in the viscous drag force which decreases the minimum fluidization velocity. Similarly, Equation 10 also shows that an increase in particle size yields a higher minimum fluidization velocity.
The nature of fluidizing gas (air or steam) also has an effect on the minimum fluidization velocity. Fig. 5b shows that the minimum fluidization velocity obtained with steam is higher than that obtained with air. These results are mainly explained by the low value of steam viscosity compared to air. The low value of steam density is also responsible for these trends. Values of density and viscosity for the two fluids are reported in Table 5.
| Steam/Air | 600 °C | 700 °C | ||
|---|---|---|---|---|
| Density (kg · m−3) | 0.25 | 0.40 | 0.22 | 0.36 |
| Viscosity (Pa · s) | 3.41 × 10⁻⁵ | 4.04 × 10⁻⁵ | 3.85 × 10⁻⁵ | 4.31 × 10⁻⁵ |
Experimental results determined from about 40 tests carried out in the gasifier and in the combustor were compared to values predicted by 15 correlations of literature, given in Table 1. This comparison was based on the following statistical criteria, already defined in the work of Tannous et al. (1994):
| (11) |
| (12) |
where Zexp is the experimental value, Zpredict is the predicted value and Ne is the number of experimental results compared to predictions. Values of R1 and R2 are given in Table 6. It was found that the relationships proposed by Bourgeois and Grenier (1968), Richardson (1971), Thonglimp et al. (1984) and Nakamura et al. (1985) represent our results with an absolute relative error similar to the experimental uncertainty (lower than 10 %). The best one is the correlation of Bourgeois and Grenier (1968) with a relative error equal to −3 %.
| Authors | R1 | R2 |
|---|---|---|
| Tannous et al. (1994) | −13 % | 14 % |
| Wen and Yu (1966) | 17 % | 17 % |
| Bourgeois and Grenier (1968) | −3 % | 8 % |
| Richardson (1971) | 3 % | 9 % |
| Saxena and Vogel (1977) | −51 % | 51 % |
| Babu et al. (1978) | −71 % | 72 % |
| McKay and McLain (1980) | −23 % | 25 % |
| Svoboda et al. (1983) | −134 % | 134 % |
| Chitester et al. (1984) | −17 % | 18 % |
| Thonglimp et al. (1984) | 8 % | 10 % |
| Nakamura et al. (1985) | 6 % | 9 % |
| Lucas et al. (1986) | 17 % | 17 % |
| Chyang and Huang (1988) | 31 % | 31 % |
| Murachman (1990) | −14 % | 17 % |
| Fatah (1991) | −6 % | 36 % |
A new correlation is proposed (Equation 13) in order to estimate the minimum fluidization velocity of olivine particles as a function of bed temperature, particle size and fluidizing gas nature. This correlation was established between 20 and 950 °C, with olivine particles of mean Sauter diameter between 282 and 689 μm and for air and steam as fluidizing gas. It is intended to be used for the design of FICFB biomass gasifiers operating with olivine as the heat transfer medium.
| (13) |
This correlation enables prediction of experimental Umf with a relative error R1 equal to −2 % and an absolute relative error of 8 % (Fig. 6).

Prediction of minimum fluidization velocity: comparison between experimental findings and proposed correlation.
Fig. 7 shows that bed voidage at minimum fluidization conditions (ɛmf) is independent of bed temperature and mean particle size. The estimated bed voidage is about 0.55, which is slightly higher than the mean voidage of an aerated fixed bed ɛBA. Tests carried out in the combustor between 700 and 950 °C lead to the same conclusions. These results are likely explained by the fact that for class-B particles, the absence of interparticle force leads to an almost instantaneous transition between fixed bed and fluidized bed states (no deaeration phenomenon). Thus, for this class of particles, minimum fluidization voidage is almost equal to the fixed bed voidage.

Effect of bed temperature on minimum fluidization voidage for different olivine batches.
Fig. 8a, Fig. 8b and Fig. 8c show the average bed voidage evolution vs excess gas velocity (U-Umf), at different bed temperatures (between 20 °C and 850 °C), for 3 olivine batches. The average bed voidage increases with excess gas velocity, regardless of particle size and bed temperature. Besides, for the same excess gas velocity, bed voidage is slightly affected by bed temperature and particle size. Tests carried out in the combustor between 700 and 950 °C confirm these results (Fig. 8d). These trends are consistent with the experimental findings reported in the literature (Botterill et al., 1982a; Botterill et al., 1982c). They may be related to the fact that bed expansion is mainly caused by the presence of bubbles in the bed. Bed voidage can be estimated from Equation 14 (Kunii and Levenspiel, 1991), which strongly depends on bubble properties:
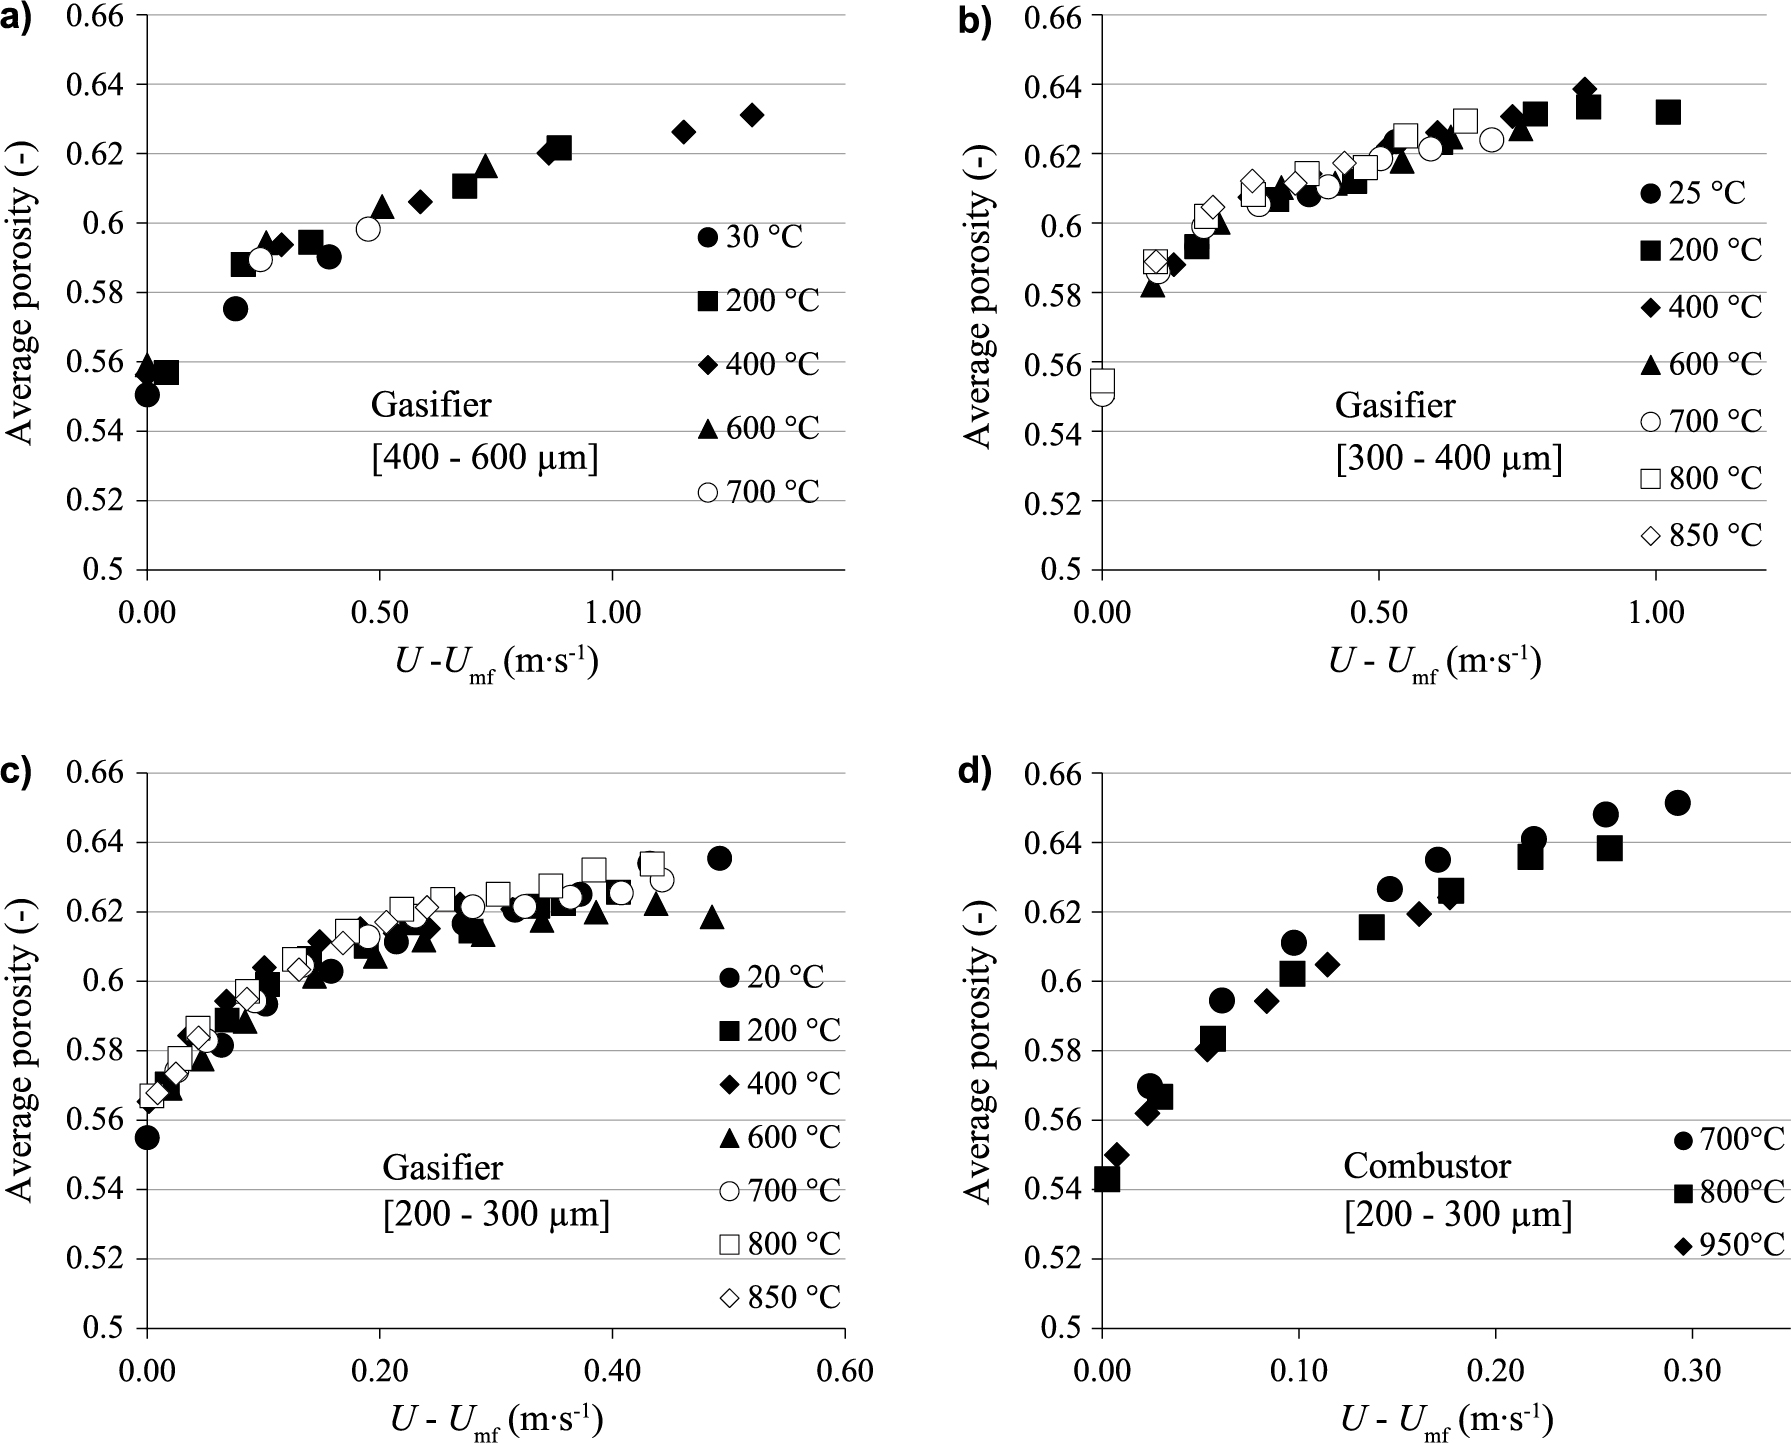
Effect of excess gas velocity on the average fluidized bed voidage, for different bed temperatures and olivine batches in the gasifier (a, b, c) and the combustor (d).
| (14) |
In Equation 14, the bubble volume fraction in the bed δB mainly depends on excess gas velocity U-Umf, as described in Appendix A. Thus, average bed voidage depends only on excess gas velocity, as observed in our experiments.
Experimental ɛ values determined from about forty tests in both gasifier and combustor were compared to values predicted from literature correlations, reported in Table 2. These correlations are usually used for fluidized bed reactor design, modeling and simulation. Relative error R1 and absolute relative error R2 were calculated and are presented in Table 7. For our operating conditions and olivine particles, the relationships proposed by Lewis et al. (1949), Matsen et al. (1969), and Thonglimp et al. (1984) are the most adapted. The best one is the correlation of Matsen et al. (1969) with a relative error of −10 % and an absolute relative error of 10 % (Fig. 9).
| Authors | R1 | R2 |
|---|---|---|
| Thonglimp et al. (1984) | 10 % | 13 % |
| Chyang and Huang (1988) | 30 % | 30 % |
| Lewis et al. (1949) | −11 % | 11 % |
| Matsen et al. (1969) | −10 % | 10 % |
| Hilal and Gunn (2002) | −20 % | 20 % |

Comparison between ɛ experimental findings and predictions of the Matsen et al. (1969) correlation.
A new correlation (Equation 15) that takes into account fluidized bed temperature, mean particle size and fluidizing gas nature is proposed in order to estimate the average bed voidage of a bubbling fluidized bed of olivine particles. This correlation was established between 20 and 950 °C, with olivine particles of mean Sauter diameter between 282 and 689 μm and for air and steam as fluidizing gas. It is intended to be used for the design of FICFB biomass gasifiers which operate with olivine as the heat transfer medium.
| (15) |
This correlation enables the prediction of experimental ɛ with a relative error and an absolute relative error both equal to 1 % (Fig. 10). It is interesting to notice that despite the low coefficient applied to the Archimedes number, its contribution cannot be ignored. Indeed, for some experiments (T = 30 °C and dp = [400–600 μm]), the Archimedes number is almost equal to 25,000. In these cases, the Archimedes number contribution is about 6 %.

Prediction of average bed voidage: Comparison between experimental findings and proposed correlation.
The biomass gasification efficiency in an FICFB mainly depends on heat transfer medium circulation flow rate. Thus, it appears essential to identify the key parameters influencing the circulation flow rate.
Process parameters are: gas velocity in the gasifier UG, gas velocity in the standpipe US, particle inventory mp, bed temperature T, secondary air injection position HII and air average velocity in the combustor Ucomb. The last parameter depends on primary and secondary air flow rates in the combustor. However, in order to ensure a good fluidization in the dense fluidized bed of the combustor, the primary air flow rate is set so that UI = 4 · Umf(T). Based on previous work (Detournay, 2011), the value of the secondary air injection position (injection cane height HII) is set at 15 cm. Thus, only the secondary air flow rate, called “transport air”, is varied in our experiments. For each experiment, temperatures in both gasifier and combustor were set at almost identical values.
Most of the experiments were performed with the olivine batch [200–300 μm] as bed material, between 20 and 850 °C. However, some tests were also carried out with sand particles at ambient temperature, in order to investigate the effect of the bed material nature. The properties of these materials are reported in Table 4.
Table 8 indicates the variation range of the process parameters in this study. In this table, Ut is the terminal settling velocity of the particles used. It is given by:
| Reference | Range | |
|---|---|---|
| mp (kg) | 35 | 35–60 |
| UG (U/Umf) | 4 | 1–8 |
| Ucomb (U/Ut) | 2.4 | 0.5–3 |
| HII (cm) | 15 | 15 |
| US (U/Umf) | 8 | 1–9 |
| T (°C) | 500 | 20–850 |
| (16) |
where Cd is the drag coefficient. The latter depends on the solids shape factor ϕ, and is estimated by (Haider and Levenspiel, 1989):
| (17) |
where Ret is the Reynolds number at U = Ut.
Besides, in Table 9, the values of Ut calculated for several temperatures between 20 and 850 °C are reported for both sand and olivine particles. It can be noticed that olivine and sand particles have close values of Ut, in particular at ambient temperature. Besides, Ut velocity only decreases by 8 and 13 % between 20 and 850 °C, for olivine and sand particles, respectively.
| Temperature (°C) | 20 | 300 | 500 | 800 | 850 |
|---|---|---|---|---|---|
| Ut (m · s−1)–Olivine | 2.05 | 2.10 | 2.03 | 1.90 | 1.88 |
| Ut (m · s−1)–Sand | 1.92 | 1.91 | 1.81 | 1.67 | 1.65 |
A previous study (Detournay, 2011) carried out at ambient temperature on the same pilot as the one used in this work showed that:
Experiments carried out in this study for temperatures up to 850 °C confirm these trends.
4.1 Determination of transport velocity: Presentation of a typical exampleFig. 11 presents a typical example regarding the effect of gas velocity on solids circulation flow rate, using sand as bed material. Three regimes can be observed:
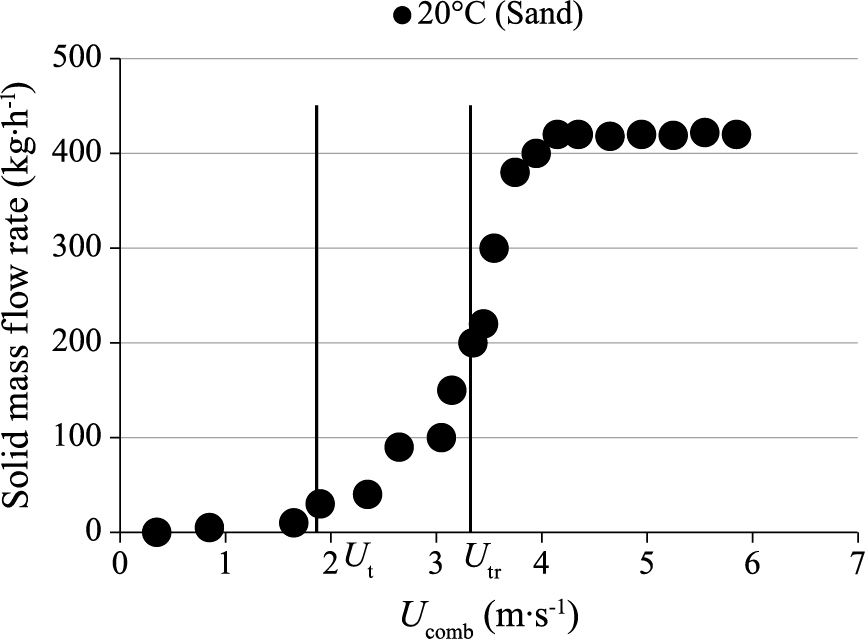
Effect of combustor gas velocity on circulating solids mass flow rate (sand, mp = 35 kg, UG = 4 · Umf, UI = 4 · Umf, HII = 15 cm).
In order to ascertain the appropriateness of the Utr value measured in this study and presented above, the emptying time technique was employed (Han et al., 1985). This technique is based on measurements of the time required for all solids to leave the bed at different settings of the superficial gas velocity. No fresh solids are fed to the column and the dump is closed. As the gas velocity is increased, a point is reached where acceleration of the solids increases. In the absence of solids recycling, the bed empties in a short time. All experiments were performed at ambient temperature with samples of 7 kg of sand particles. For a fixed gas velocity, the emptying time is defined as the time necessary to reduce the total pressure in the combustor from its initial value to a residual value. The transport velocity, Utr, is taken to be the intersection of the lines of low and high accelerations (Fig. 12). The value of Utr measured by this method is 3.4 m · s−1, which is consistent with the value obtained from Fig. 11 (i.e. 3.3 m · s−1).

Effect of combustor gas velocity on the disappearance time of solids (sand, mp = 7 kg, T = 20 °C).
In order to investigate the effect of the bed material nature on solids circulation, the results previously obtained with sand particles were compared with new ones obtained using olivine particles, for a bed material inventory of 35 kg (Fig. 13). It was found that the solids mass flow rate evolution vs gas velocity is not significantly affected by the bed material nature when solids batches have similar Ut values. Results show that the same transport velocity Utr and circulation mass flow rate on the plateau were found with olivine particles regarding the values obtained with sand.
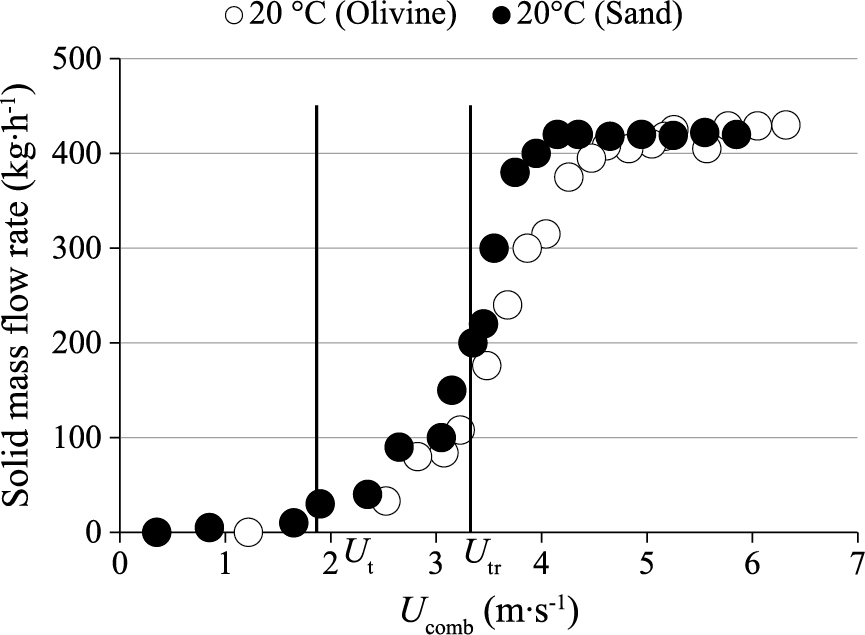
Effect of bed material nature on circulating solids mass flow rate (UG = 4 · Umf, UI = 4 · Umf, mp = 35 kg, HII = 15 cm).
According to Perales et al. (1991a), the transport velocity is directly proportional to the terminal settling velocity with a ratio between Utr and Ut equal to 1.7. This value is close to the one presented above. Besides, Fig. 14a shows that for an increase in combustor gas velocity Ucomb, the gasifier inventory increases almost linearly before reaching a plateau.

Effect of gas velocity in the combustor on gasifier and combustor inventories (olivine, UG = 4 · Umf, UI = 4 · Umf, mp = 35 kg, HII = 15 cm).
Regarding combustor inventory, it decreases as gas velocity rises, and also reaches a plateau. Thus, results show that the difference between gasifier and combustor inventories presented in Fig. 14b increases with combustor gas velocity before levelling off. This trend is similar to the one of solids mass flow rate vs. gas velocity.
This is consistent since the difference between gasifier and combustor inventories is directly related to the difference in pressures between these two reactors. However, the latter acts as the driving force on solids circulation. Thus a rise in combustor gas velocity produces an increase in pressure difference between gasifier and combustor, leading to higher solids circulation flow rates. These trends are consistent with the ones presented above for sand particles.
4.2 Effect of bed material inventory and temperatureFig. 15 presents the effect of the bed material inventory, between 20 and 60 kg, on the solids circulation flow rate for a given combustor air velocity (Ucomb = 3.6 m · s−1), with sand particles as the bed material. Results show that a rise in bed material inventory leads to higher solids mass flow rates. Besides, Fig. 16 presents the effect of bed temperature, between 20 and 850 °C, on olivine circulation flow rate vs. combustor gas velocity, for 35- and 60-kg bed inventories. It can be noticed that for each bed temperature and bed material inventory, the curves follow the same trends. Besides, results show that:

Effect of bed material inventory on circulating solids mass flow rate (sand, T = 20 °C, UG = 4 · Umf, UI = 4 · Umf, UII = 3.3 m · s−1, HII = 15 cm).
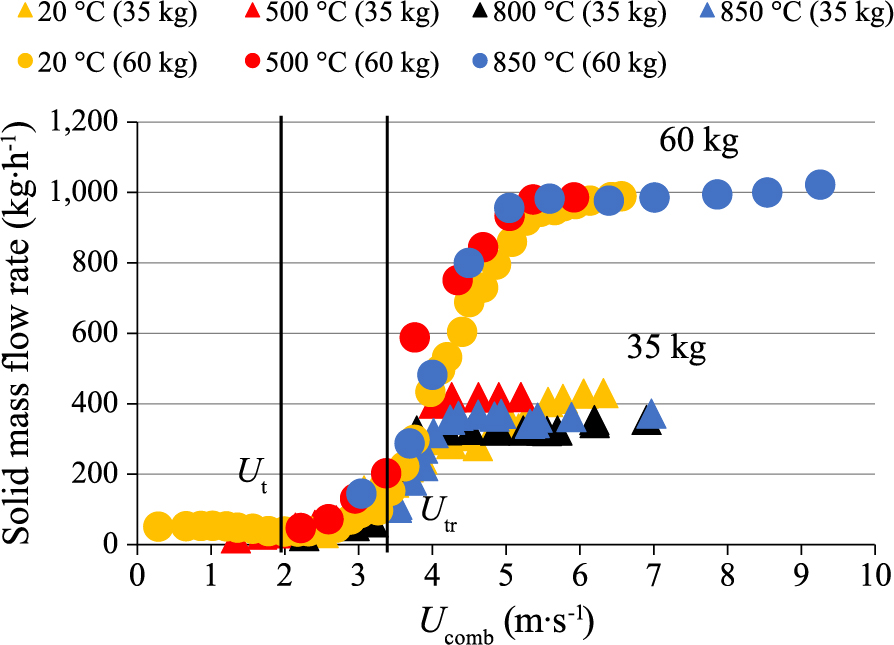
Effect of gas velocity in the combustor on solids mass flow rate, for bed temperature between 20 and 850 °C, and bed inventory between 35 and 60 kg (olivine, UG = 4 · Umf, UI = 4 · Umf, HII = 15 cm).
Besides, Fig. 17a and Fig. 17b illustrate the normalized solids mass flow rate (Fp/Fpmax) vs. the normalized gas velocity (Ucomb/Ut), between 20 and 850 °C, for bed inventories of 35 and 60 kg, respectively. Results confirm that Utr velocity is not affected by bed temperature or bed inventory.
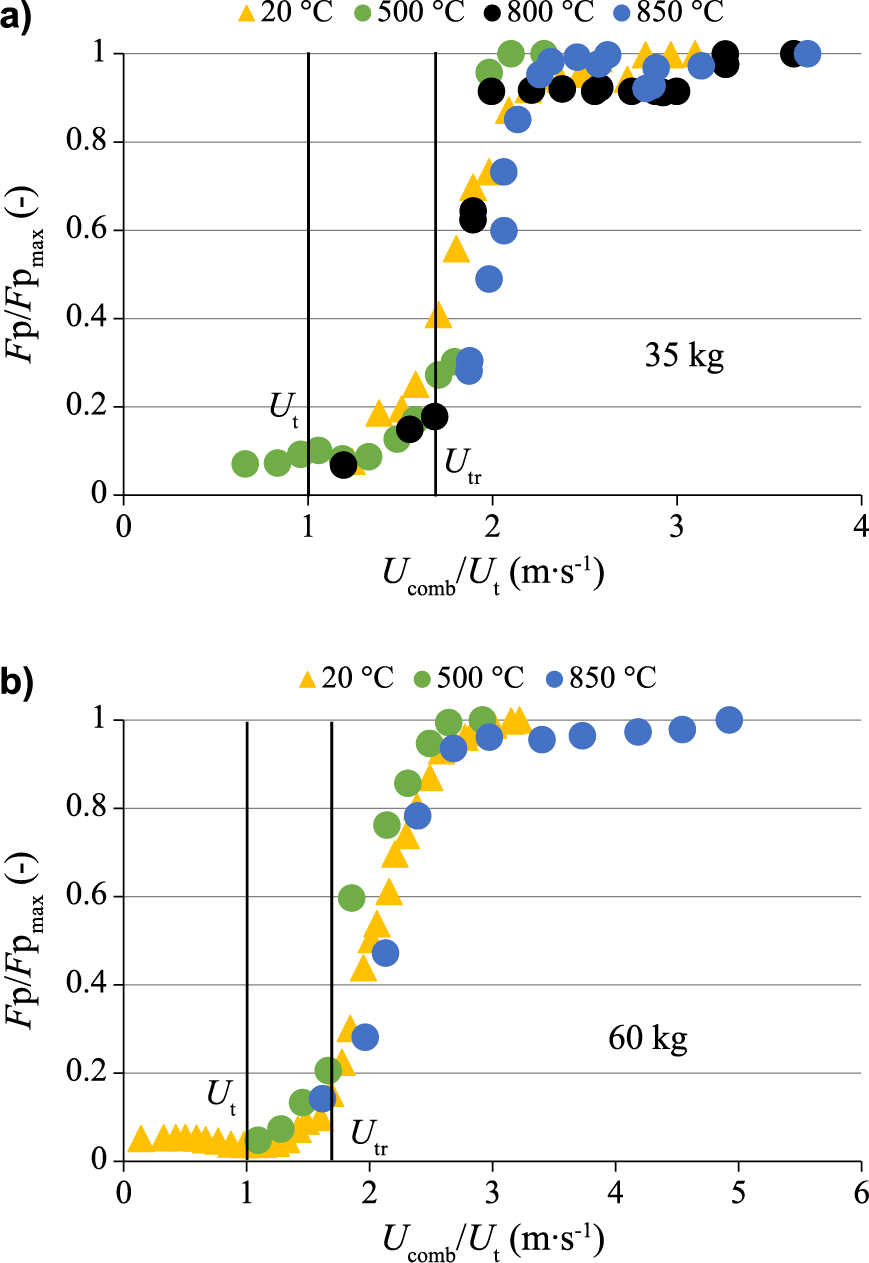
Effect of bed temperature on normalized solids flow rate vs. normalized gas velocity for 35 (a) and 60 (b) bed material inventories (olivine, UG = 4 · Umf, UI = 4 · Umf, HII = 15 cm).
An experiment was carried out at 500 °C for an olivine inventory of 35 kg. Fig. 18 shows the influence of combustor air velocity Ucomb on the normalized circulating solids mass flow rate Fp/Fpmax, total pressure in the combustor Pcomb, pressure profiles along the combustor and distribution of solids inventory in both gasifier and combustor. Total pressure is considered as the pressure difference between two pressure taps, Pdist (3 cm above the distributor) and P7 (2.5 m above the distributor). From the temporal fluctuations of solids flow rate and total pressure in the combustor, a standard deviation was determined for several velocities Ucomb. Results show that the hydrodynamic regimes defined above, as well as the transport velocity, can be estimated from the plot of these standard deviations against gas velocity. For instance, it was found from results at 500 °C that:

Effect of combustor gas velocity on the solids mass flow rate, the combustor total pressure (a), its standard deviation (b), the axial pressure profiles (c) as well as on solids inventory in both gasifier and combustor (d) (olivine, mp = 35 kg, T = 500 °C).
However, supplementary studies have to be performed in order to ascertain the good reproducibility of circulation flow rate and total pressure standard deviation.
From experimental data obtained between 20 and 950 °C, correlations were proposed in order to estimate olivine minimum fluidization velocity and bed voidage. These relationships can be useful for industrial gasifier design. Moreover, hydrodynamic experiments were carried out in a circulating fluidized bed between 20 and 850 °C. Results showed that, under our operating conditions:
Besides, results showed that key parameters for the solids flow rate control are combustor gas velocity and solids inventory. An increase in these parameters leads to higher circulation flow rates. However, the bed temperature and bed material nature showed no influence, neither on the transport velocity nor on the solids flow rate.
reactor section (m2)
ArArchimedes number (−)
C1, C2constant numbers relating to Ar and Remf (−)
C11constant number, C11 = 0.64·Ac0.4 (m0.8)
C12constant number,
drag coefficient (−)
Cvdiameter variation coefficient (−)
bubble mean diameter (m)
dB0initial bubble diameter, at the outlet of the gas distributor (m)
dBmmaximal bubble diameter (m)
dpSauter mean particle diameter (m)
DCreactor diameter (m)
Fpcirculating solids mass flow rate (kg · h−1)
Fpmaxmaximal circulating solids mass flow rate (kg · h−1)
gacceleration due to gravity (m · s−2)
Hbed height (m)
HIIsecondary air injection cane height (m)
Hmfbed height at minimum fluidization conditions (m)
K1, K2constant numbers relating to Ar and Remf (−)
Lpacked bed height in Ergun equation (m)
mptotal weight of particles, inventory (kg)
mpCtotal weight of particles in the combustor (kg)
mpGtotal weight of particles in the gasifier (kg)
Mvdensity number,
number of data (−)
Nororifice number in the gas distributor (−)
Pcombtotal pressure drop in the combustor (mbar)
Pdistpressure drop measured 3 cm above the distributor, in the combustor (mbar)
R1relative error (%)
R2absolute relative error (%)
RemfReynolds number at the minimum fluidization point (−)
RetrReynolds number at the gas velocity Utr (−)
Ttemperature (°C)
Usuperficial gas velocity (m · s−1)
Ubbubble rise velocity in the bed (m · s−1)
Ucturbulent regime characteristic velocity (m · s−1)
Uchchocking velocity (m · s−1)
Ucombtotal air velocity in the combustor (m · s−1)
UGgas velocity in the gasifier (m · s−1)
UIprimary air velocity in the combustor (m · s−1)
UIIsecondary air velocity in the combustor (m · s−1)
Umfminimum fluidization velocity (m · s−1)
Ussuperficial gas velocity in the standpipe (m · s−1)
Utterminal settling velocity of single particle (m · s−1)
Utrtransport velocity (m · s−1)
zgiven height in the dense fluidized bed (m)
mean value of a given parameter (unit of the parameter)
Zivalue of a given parameter (unit of the parameter)
Greek symbols γcompressibility factor (−)
δBbubble volume fraction in the bed (−)
ΔPpressure drop (Pa)
ɛaverage fluidized bed voidage (−)
ɛBAmean aerated bulk bed voidage (−)
ɛBPmean packed bulk bed voidage (−)
ɛmfminimum fluidization voidage (−)
μffluid viscosity (kg · m−1 · s−1)
ρbbed density (kg · m−3)
ρBAaerated bulk density (kg · m−3)
ρBPpacked bulk density (kg · m−3)
ρffluid density (kg · m−3)
ρmfbed density at the minimum fluidization condition (kg · m−3)
ρpparticle density (kg · m−3)
ρsskeletal density (kg · m−3)
σZnormalized standard deviation (−)
ϕshape (sphericity) factor (−)
χparticle internal voidage (−)
The bubble fraction in the bed δB can be estimated from the following equations (Davidson and Harrison, 1963; Mori and Wen, 1975):
| (A1) |
| (A2) |
| (A3) |
| (A4) |
| (A5) |
where C11 and C12 are numbers depending on reactor and gas distributor geometry. Combining Equations A3 to A5 gives the bubble mean diameter, dependent only on the excess gas velocity, as:
| (A6) |
Then, a combination of Equations A1, A2 and A6 shows that average bed voidage depends only on excess gas velocity.
Sébastien Pecate
;%0A%09%09%09newWindow.document.open();%0A%09%09%09newWindow.document.write('<img src=%22./Graphics/36_2019018_19.jpg%22>');%0A%09%09%09newWindow.document.close();%0A%09%09)
Sébastien Pecate holds a PhD (2017) in process engineering, and more precisely on “Biomass Gasification in an FICFB”. He worked as a research engineer on biomass and sludge gasification at LGC from 2014 to 2018. He is now working on solid waste thermal treatment (incineration, pyrolysis, gasification, combustion) for waste to energy, waste to fuels and waste to chemicals applications.
Mathieu Morin
;%0A%09%09%09newWindow.document.open();%0A%09%09%09newWindow.document.write('<img src=%22./Graphics/36_2019018_20.jpg%22>');%0A%09%09%09newWindow.document.close();%0A%09%09)
Dr. Mathieu Morin studied chemical engineering processes at the University of Toulouse, France, where he received his PhD degree on “Biomass Gasification in Circulating Fluidized Bed” in 2017. During his PhD thesis, he particularly developed experimental and modeling tools in order to study the chemical reactions occurring during biomass conversion (pyrolysis, gasification, combustion, catalytic cracking and reforming of tar). Currently, Dr. Mathieu Morin is working at IFPEN in Lyon, France, at the Department of Process Design and Modeling. His main topics are the development of processes for the production of environmental fuels, chemical intermediates and energy from fossil and renewable resources.
Sid Ahmed Kessas
;%0A%09%09%09newWindow.document.open();%0A%09%09%09newWindow.document.write('<img src=%22./Graphics/36_2019018_21.jpg%22>');%0A%09%09%09newWindow.document.close();%0A%09%09)
Sid Ahmed Kessas is a second-year PhD student who graduated in chemical engineering in 2016 and who worked on:
Mehrdji Hemati
;%0A%09%09%09newWindow.document.open();%0A%09%09%09newWindow.document.write('<img src=%22./Graphics/36_2019018_22.jpg%22>');%0A%09%09%09newWindow.document.close();%0A%09%09)
Mehrdji Hemati is a professor in chemical engineering at the ENSIACET-INP in Toulouse. His research activities focus on three items:
He is author and co-author of more than 100 publications in international scientific journals.
Yilmaz Kara
Yilmaz Kara is a process engineer working on biomass gasification, fluidized beds, REFIOM vitrification and many other subjects related to energetic valorization. He is also an expert on green gas production and treatment, and flow assurance.
Sylvie Valin
;%0A%09%09%09newWindow.document.open();%0A%09%09%09newWindow.document.write('<img src=%22./Graphics/36_2019018_23.jpg%22>');%0A%09%09%09newWindow.document.close();%0A%09%09)
Sylvie Valin holds a PhD (1999) in energetics from the Institut National Polytechnique de Grenoble (France). She has been working as a research engineer on biomass gasification at CEA since 2004. Her research activity mainly concerns biomass and waste pyrolysis and gasification for energy application, coupling experimental and modelling approaches from particle to reactor scale. She especially works on gasification in high-temperature reactors (fluidised bed, entrained flow reactor).