Abstract
Mathematical models of high-pressure grinding rolls (HPGR) have attracted great attention, owing to their role in optimization of operating machines as well as in the design and selection of new ones. Although population balance models (PBM) and the discrete element method (DEM) have been used in this task, both suffer from important limitations. Whereas PBMs have challenges associated to the prediction of operating gap and to the validity of several of its assumptions in different formulations in the literature, application of DEM has its own challenges, in particular when fed with distributions containing large amounts of fines. This work proposes a hybrid approach in which the coupling of DEM to particle replacement models and multibody dynamics is used to predict operating gap, throughput and power, as well as providing information along the rolls length that is used in PBM to predict the product fineness. The hybrid approach is then compared to both DEM and a PBM (Modified Torres and Casali), demonstrating similar results to the later when applied to simulating a pilot-scale machine operating under different conditions, but improved prediction when applied in scale-up to an industrial-scale HPGR.
1. Introduction
Since the introduction of the high-pressure grinding rolls (HPGR) technology, various authors have proposed different approaches to its mathematical modelling, which may be classified as predominantly empirical, phenomenological or mechanistic.
Schönert (1988) was the first to propose relationships among key performance variables, involving geometrical variables of the HPGR such as rolls diameter and length; operating variables as rolls velocity, working gap, nip angle, working pressure and material variables such as flake density. Based on experimental evidence, Austin et al. (1993; 1995) and Morrell et al. (1997), proposed relationships to predict the porosity of the product flakes, as well as the working gap as a function of the specific grinding force, including a correction factor for the effects of rolls surface, feed top size, scale of the machine, moisture content and rolls speed.
In regard to prediction of product fineness, Klymowsky and Liu (1997) and Morrell (2004; 2010; 2022) developed work indices that characterize empirically the relationship between the energy that is applied by an HPGR to a particle bed and the resultant product fineness. Application of the HPGR work index to predict the specific energy consumed by the machine demands the use of correction factors that reflect the effect of top feed particle size, fines, moisture content, mode of operation (open- or closed-circuit), material strength, and roll surface. More recently, Chelgani et al. (2021) and Tohry et al. (2021) proposed yet another empirical approach that is based on the so-called Explainable Artificial Intelligence (EAI). Although it requires large databases originated from monitoring variables in industrial-scale plants, it demonstrated to be able to predict accurately the 80 % passing size in the product and the power draw using linear and nonlinear multivariable assessment, being useful in optimizing a machine in operation. These approaches may be regarded as predominantly empirical since they do not rely on a consistent description of the underlying physics of machine operation.
Phenomenological models have been widely used to predict the HPGR product particle size distribution. Different authors have developed approaches based on the self-similarity concept (Fuerstenau et al., 1991; Lim et al., 1996), different formulations of the population balance model (PBM) (Austin et al., 1993; Dundar et al., 2013; Thivierge et al., 2022), including those considering different breakage zones (pre-crushing, edge and compression zones) and mechanisms (Daniel and Morrell, 2004; Morrell et al., 1997), which are often characterized using the piston-and-die, besides laboratory- and pilot-scale HPGR tests (Rashidi et al., 2017).
Torres and Casali (2009) proposed a PBM formulation of the HPGR that refined the description of the edge and central products, relying on an empirical parabolic variation of axial pressure profile along the rolls. In their model, the specific breakage rates are a function of the specific energy input. As such, good predictions of product fineness rely on the ability of the model to properly predict HPGR throughput and power. Based on a large number of experiments, Campos et al. (2019a) identified some limitations of the Torres and Casali approach when applied to a pilot-scale HPGR processing iron ore pellet feed. The authors proposed modifications of the expressions originally used to describe HPGR throughput, associated to the material ejection from the edge of the rolls, as well as to the power consumption equation. Additional modifications were also proposed and validated in industrial-scale HPGRs, including a breakage saturation model and an equation to account for variations of the axial pressure profile (Campos et al., 2021a).
One important application of mathematical models is in sizing and scale-up of HPGRs (Daniel and Morrell, 2004; Morrell et al., 1997; Schönert, 1988), where limitations are recognized when they deal with prediction of HPGR throughput (Banini et al., 2011), working gap and product fineness (Daniel and Morrell, 2004). Many of the mentioned scale-up studies are based on HPGR testing in pilot- and industrial-scale machines. However, experimental tests require a large mass of material even at the laboratory scale (Rashidi et al., 2017). The piston-and-die test is adopted by many researchers to study interparticle breakage and obtain information of the compressibility and breakage response of the particle bed. Models based on the PBM and piston-and-die tests include the description of the energy absorption in different size classes of a compressed particle bed (Liu and Schönert, 1996) and the creation of new surface area and particle bed porosity (Dundar et al., 2013; Esnault et al., 2015) to describe the HPGR product particle size distribution. In addition, the piston-and-die test has also been used to predict and scale-up HPGR performance variables (Davaanyam et al., 2015; Hawkins, 2008; Nadolski et al., 2011; Pamparana and Klein, 2021).
The application of mechanistic models to simulate comminution machines has been increasing in recent years. Mechanistic models are meant to describe in detail the effect of operating and design variables since they can decouple material from machine contributions in the process. This is accomplished by both characterizing and modelling in detail each of the breakage mechanisms, almost invariably using the Discrete Element Method (Weerasekara et al., 2013). However, simulation of large-scale industrial comminution machines using DEM deals with challenges that include the large number of elements (up to several million particles), boundaries containing large numbers of elements, wide particle size ranges and need to couple with other tools describing the additional relevant physics of the system, which include particle breakage, dynamic geometry interactions, solid-fluid interactions, etc. (Cleary, 2004).
In particular, laboratory- and pilot-scale DEM simulations of HPGRs allowed to describe the effect of feed size distribution, roll dimensions and speed, applied specific force, besides features such as lateral confinement, roll wear profile and feed segregation. These have then been used to predict performance variables that include throughput, working gap, power consumption and compressive force profile along the rolls, besides skewing (Barrios and Tavares, 2016; Cleary and Sinnott, 2021; Nagata et al., 2020; Quist and Evertsson, 2012; Rodriguez et al., 2021, 2022a, 2022b).
However, prediction of size distribution of the product remains a great challenge in DEM simulations of HPGRs. In this regard, two publications are worth mentioning. Herbst and co-workers (2011) combined Metso’s proprietary Fast Breakage simulation approach in DEM, experimental data from piston-and-die tests and the energy-based population balance model as alternatives to ore characterization and equipment selection by HPGR pilot-plant testing. The validated physics-based model was then successfully used to predict the performance of industrial-scale HPGRs using the proposed energy-based scale-up method. Although promising, their approach did not account for the axial force and throughput distribution along the rolls.
Cleary and Sinnott (2021) simulated an industrial-scale HPGR using DEM including a particle replacement model (PRM) to predict the variation of flow, pressure and particle breakage response along the rolls. Yet, the authors recognized that it is not possible to include all fine particles in the DEM simulations owing to the large computational effort, so that a minimum cut-off size was applied to represent the HPGR product, representing the fines as additional mass in the finest resolved size class. While good predictions were reached, such approach is not suitable to predict HPGR operation with very fine feeds.
The present work proposes a hybrid modelling approach, through which HPGR throughput and power are described as a function of roll axial position for a given set of design and operating conditions through coupled DEM-MBD-PRM simulations (Rodriguez et al., 2022a; 2022b), whereas size reduction is also predicted as a function of roll axial position using PBM considering the breakage distribution and selection functions. The approach has been applied to a base case, consisting of a pilot-scale HPGR in size reduction of iron ore pellet feed with 80 % passing size as fine as 103 μm, from which model parameters have been fitted. The approach was validated by comparing model predictions to data from the HPGR operating under different specific forces and roll velocities. The greatest potential of the model has then been demonstrated by predicting the performance of an industrial-scale HPGR based on breakage parameters calibrated at pilot-scale.
2. Modelling background
2.1 Proposed hybrid model
The model consists of linking outputs from DEM simulations to the population balance model (PBM). This later is represented by the energy-specific selection function proposed by Herbst and Fuerstenau (1980), a non-normalizable breakage distribution function used by Campos et al. (2019a) and selected expressions proposed by Torres and Casali (2009). Following this approach, DEM simulations allow to capture the effect of design and operating variables on the HPGR performance, while the PBM model allows dealing with the entire range of particle sizes fed to the machine.
As presented in detail in recent publications by the authors (Rodriguez et al., 2022a; 2022b), outputs provided by the DEM simulations correspond to total power (PDEM), total throughput (QDEM), compressive axial force profile in the region between the gap and the nip angle (Fk), and axial mass flowrate profile in the region between the gap and the nip angle (Vk).
Following the PBM approach proposed by Torres and Casali (2009), the roll length is discretized in NB sections. In each of the k sections, the mass of material contained in every size class i is given by:
|
v
z
,
k
d
d
z
w
i
,
k
(
z
)
=
∑
j
=
1
i
-
1
S
j
,
k
b
i
j
w
j
,
k
(
z
)
-
S
i
,
k
w
i
,
k
(
z
) | (1) |
where wi,k is the fraction of material in size class i and section k, z is the distance between the beginning of the compression zone and the extrusion zone, vz,k is the material flow velocity in the z direction for each section k, Si,k is the breakage rate for each size class i and section k, and bij is the breakage function in distributed form.
Two functions must be known in order to solve the resulting system of differential equations: bij and Si,k. Campos et al. (2019a) and Faria et al. (2019) observed that, for some Brazilian iron ores, the non-normalizable breakage function proposed by King (2001) was required to describe their response, being given by:
|
B
i
j
=
φ
(
x
i
x
j
)
γ
+
(
1
-
φ
)
(
x
i
x
j
)
β
for
x
i
≥
ω
B
i
j
=
φ
(
x
i
ω
)
η
(
x
i
x
j
)
γ
+
(
1
-
φ
)
(
x
i
x
j
)
β
for
x
i
<
ω | (2) |
where γ, β, φ, ω and η are fitting parameters and bij = Bi− 1,j − Bij. The specific selection function can be calculated using the polynomial equation given by Herbst and Fuerstenau (1980):
|
ln
(
s
i
E
s
l
E
)
=
ξ
1
ln
(
x
¯
i
x
¯
1
)
+
ξ
2
[
ln
(
x
¯
i
x
¯
1
)
]
2 | (3) |
where
s
1
E
(
t
/
kWh
), ξ1 and ξ2 are the parameters to be fitted from a base case,
x
¯
i
is the representative size given by
x
¯
i
=
x
i
-
1
x
i and
x
¯
i
is a reference size. In the present work
x
¯
i
was set to 1 mm. Following the Torres and Casali modelling approach, Eqn. 4 calculates the breakage rates (Si,k), giving
|
S
i
,
k
=
s
i
E
P
k
M
k | (4) |
where Pk and Mk are the power profile and the mass of solids profile along the roll length gathered from the DEM simulations. Power profile is hereby calculated by normalizing the compressive force profile (Fk) and multiplying it by the total HPGR power, with both variables gathered from the DEM simulation (Eqn. 5). The throughput profile in Eqn. 6 is then calculated on the basis of the total throughput and mass flowrate of solids profile from DEM:
|
P
k
=
P
DEM
F
k
∑
j
=
1
N
B
F
j | (5) |
|
Q
k
=
Q
DEM
V
k
∑
j
=
1
N
B
V
j | (6) |
where PDEM is power consumption (kW), QDEM is total throughput (t/h), and Fk is the compressive force profile (kN) predicted by DEM. Given their direct relationship to power, compression forces (Fk), provided by DEM simulation, are used in Eqn. 5. In the hybrid model approach, the mass flowrate profile of solids (Vk) is then defined on the basis of the mean particle residence time (λk) and the total mass (Mk) in each block (k) along the rolls:
The solution of Eqn. 1 allows calculating the fraction retained in each size class of every block (k) following the Torres and Casali model approach, which is based on the Reid’s analytical solution (Reid, 1965):
|
p
i
,
k
=
∑
j
=
1
i
A
i
j
,
k
exp
(
-
s
j
E
P
k
Q
k
) | (8) |
where Aij,k is a matrix given by:
|
A
i
j
,
k
=
{
0
i
<
j
∑
l
=
j
i
-
1
b
i
l
S
l
,
k
S
i
,
k
-
S
j
,
k
A
l
j
,
k
i
>
j
f
i
IP
-
∑
l
=
1
i
-
1
A
i
l
,
k
i
=
j
} | (9) |
where is the fraction retained in each size class i in the feed.
Finally, the overall product size distribution is calculated from the weighted average product size distributions of each section k and is given as:
|
p
i
HPGR
=
1
Q
DEM
∑
k
=
1
N
B
p
i
,
k
Q
k | (10) |
In the present study, the Modified Torres and Casali (MTC) model (Campos et al., 2019a) represents the purely phenomenological model that is compared to the proposed hybrid approach. A summary of its main expressions and the comparison with the corresponding ones in the hybrid model is presented in Table 1. Throughput and power models in the Modified Torres and Casali model required fitting four parameters (ϕ, υ and τ for the throughput model and κ for the power model). That was done on the basis of a selected base case. The throughput profile is assumed as uniform. On the other hand, whereas the Torres and Casali (2009) model assumes a parabolic pressure profile along the rolls, the MTC model allows for different profiles, given evidence from both experiments and DEM simulations (Cleary and Sinnott, 2021; Rodriguez et al., 2021).
Table 1
Summary of expressions and approaches used for estimating the key performance variables in both the Modified Torres and Casali model (Campos et al., 2019a; Campos et al., 2021a) and the proposed hybrid model.
| Model |
Modified Torres and Casali |
Hybrid approach |
| Throughput |
Q
=
L
U
g
ρ
g
x
g
(
100
100
-
δ
)
ln
(
δ
ϕ
)
=
-
υ
χ
g
D
(
U
U
max
)
τ
U
g
=
x
c
U
ρ
a
x
g
ρ
g * |
Mass flow sensor underneath the working gap in DEM simulations |
| Throughput profile |
Uniform, with step bypass flow |
Eqn. 7 Extracted from NB sections positioned in the compression zone (i.e. between the working gap and nip angle) along the rolls in the DEM simulations. Each section moves as a plug |
| Power consumption |
P
=
2
F
sin
(
κ
α
ip
2
)
U |
P = 4πτDEMU |
| Power distribution along the rolls |
P
k
=
4
π
∑
n
=
1
100
1
-
cos
n
π
2
n
e
-
μ
(
n
2
π
2
)
sin
n
π
y
¯
k |
Force profile extracted from NB bins located in the compression zone (i.e. between the working gap and nip angle) along the rolls in the DEM simulations |
| Breakage model |
p
i
HPGR
=
1
N
B
∑
k
=
1
N
B
p
i
,
k |
p
i
HPGR
=
1
Q
DEM
∑
k
=
1
N
B
p
i
,
k
Q
k |
D: roll diameter, L: roll length, U: roll velocity, Ug: material velocity; ρa: bulk density ρg: flake density, xc: critical size, xg: operating gap, δ: the percentage of material ejected by the edge of the rolls; F: compressive force, αip: nip angle, τDEM: torque on the rolls extracted from DEM simulation, ω: angular velocity of the roll, κ: nip angle parameter, ϕ, υ and τ: throughput model parameters, μ: power profile parameter,
y_k:
normalized average position, NB: number of sections along the roll length.
* Only used in simulations of industrial-scale machines
3. Materials and methods
3.1 Experimental
In the present study, the material selected is an iron ore concentrate processed in the production line of the Complexo the Tubarão (Vitoria, Brazil) and used in the production of iron ore pellets. The iron ore concentrate, originally from the Itabira region, in the Iron Quadrangle from Minas Gerais (Brazil), is essentially composed of hematite with minor amounts of quartz as contaminant (Campos et al., 2019b).
Experiments consisted in both pilot-scale tests and an industrial survey. Pilot-scale tests were carried out in an RPR 03.6 – 100/32 roller press manufactured by KHD Humboldt Wedag AG with 1 m-diameter rolls (Fig. 1). A sample of 100 tons was collected from the production line in the HPGR feed located in the pre-grinding stage (Campos et al., 2019b). The feed moisture content was 7.5 %, which is very similar to the value practiced in industrial-scale operations, although close to the maximum value allowable for pressing iron ore concentrates (Van der Meer, 1997). A total of eight experiments were carried out varying the specific force (2.5 and 3.5 N/mm2) and the peripheral roll velocity (0.20, 0.35, 0.50 and 0.70 m/s). Throughput, power consumption, specific energy, operating gap, roll velocity and operating pressure were obtained from the supervisory system. During each test, a sampling apparatus was introduced underneath the rolls to collect samples from five parallel sections of the discharge. The apparatus was introduced manually and allowed characterizing the axial variation of the product fineness along the rolls (Campos et al., 2019b). Additional pilot-scale tests were carried out with a blend composed of iron ore concentrates from the Iron Quadrangle, normally used to feed the pelletizing plant in question (Campos et al., 2021a). A previous study demonstrated relatively minor differences in pressing response between the samples (Campos et al., 2021b), making comparisons valid between them. Operating conditions and main feed characteristics are presented in Table 2.

Table 2
Summary of the main design and operating conditions of HPGRs in the experimental campaigns.
| Variables |
Pilot-scale study |
Scale-up study |
| Pilot |
Industrial |
| Roll diameter (m) |
1.0 |
1.0 |
1.4 |
| Roll length (m) |
0.32 |
0.32 |
1.6 |
| Specific force (N/mm2) |
2.5–3.5 |
2.5 |
2.5 |
| Operating pressure (bar) |
37.0–52.0 |
40.0 |
60.9 |
| Rolls velocity (m/s) |
0.20–0.70 |
0.32 |
1.30 |
| Operating gap (mm) |
6.8–8.2 |
13.8 |
6.0 |
| Maximum roll velocity (m/s) |
0.90 |
0.90 |
1.95 |
| Feed 80 % passing size (μm) |
103 |
143 |
143 |
| Feed % passing 45 μm |
28 |
26 |
26 |
| Feed BSA (cm2/g) |
450 ± 10 |
490 ± 10 |
470 ± 10 |
In addition, industrial-scale data were obtained from a survey on an HPGR manufactured by KHD/WEIR (Fig. 1). The machine has 1.4 m-diameter rolls, with 15.9 mm diameter studs, and cheek plates. During the survey the HPGR operated at a specific compressive force of 2.5 N/mm2 and roll velocity of 1.3 m/s. Performance variables of the HPGR were captured using the supervisory system. Samples from the feed and product were collected from belt cuts for size analysis.
Particle size distributions from samples of the feed and product were measured by laser scattering in a Malvern MastersizerTM 2000 (Malvern Instruments Inc), whereas Blaine specific surface area (BSA) was measured in a PC-Blaine-Star (Zünderwerke Ernst Brün GmbH).
3.2 Coupled DEM-MBD-PRM simulations
Simulations using DEM were carried out coupled to multibody dynamics (MBD), describing the translation of the movable roll, and particle replacement method (PRM), following the approach proposed and adopted as part of earlier studies by the authors (Rodriguez et al., 2021; 2022a). In the present work, DEM simulations were carried out using the commercial software Altair EDEM version 2020.3. The Hertz–Mindlin contact model was used, in which the normal force component is described on the basis of Hertz contact theory, whereas the tangential force model is based on Mindlin-Deresiewicz work (Mindlin 1949; Mindlin and Deresiewicz 1953). Furthermore, these particles are allowed to break owing to the use of a sphere-based particle replacement (PRM) strategy, recently proposed by Tavares et al. (2021) and coded in an application programming interface (API). Finally, a two-way coupled model based on MBD and DEM was implemented to calculate the dynamics of the floating roll as initially proposed elsewhere (Edwards et al., 2013; Barrios and Tavares, 2016). Since this DEM-MBD coupling was embedded in the EDEM software, the use of co-simulation tools became unnecessary.
3.2.1 Material properties
Due to the large number of particles demanded in HPGR simulations, the authors selected a coarser particle size distribution, with a top size 8 mm, to represent the iron ore pellet feed. This approach was already successfully used in this application in previous studies (Rodriguez et al., 2021; 2022a). From this and bench-scale tests, which included measurement of the static and dynamic angles of repose (Rodriguez et al., 2022a), material and contact parameters were calibrated (Table 3). Addition material properties were estimated on the basis of a piston-and-die test, resulting in the selection of values of Poisson’s ratio of 0.25, particle density of 3,011 kg/m3 and shear modulus of 2 GPa (Rodriguez et al., 2022a). Finally, values of breakage model parameters were taken from previous publications (Rodriguez et al., 2021; 2022a). The same set of material, contact and breakage parameters were used to simulate both pilot- and industrial-scale HPGRs.
Table 3
Hertz–Mindlin contact parameters used in the DEM simulations.
| Coefficient |
Ore-steel |
Ore-ore |
| Restitution |
0.15 |
0.20 |
| Static friction |
0.49 |
0.55 |
| Rolling friction |
0.47 |
0.51 |
At first, computer Aided Designs (CAD) of the HPGR units simulated were generated. The translational dynamics in the floating roll was described by a force controlled in the longitudinal direction “x”, while only the kinematics of the rotating movement in both rolls with a fixed angular velocity was described. Being a one-dimensional model, it does not allow for skewing of the rolls, studied by Rodriguez et al. (2022b). The rolls movement started only when DEM particles filled the hopper from a particle factory located above the rolls. From this point on in the simulation, new particles were added continuously until steady-state conditions were reached, and then analysis were performed.
The hopper level is an important aspect in DEM simulation of HPGRs, since particles located in this region only apply pressure to the particle bed sitting between the rolls (Cleary and Sinnott, 2021; Nagata et al., 2020). In the present study, the recommendation from Cleary and Sinnott (2021) was followed, where the minimum mass in the hopper (mhopper) is given by:
|
m
hopper
≥
L
h
W
2
ρ
af | (11) |
where Lh is the length along the diameter of the rolls and W the width of the feed hopper, and ρaf is the bulk density of the feed. During simulations, this minimum mass of particles filling the hopper was maintained approximately unchanged.
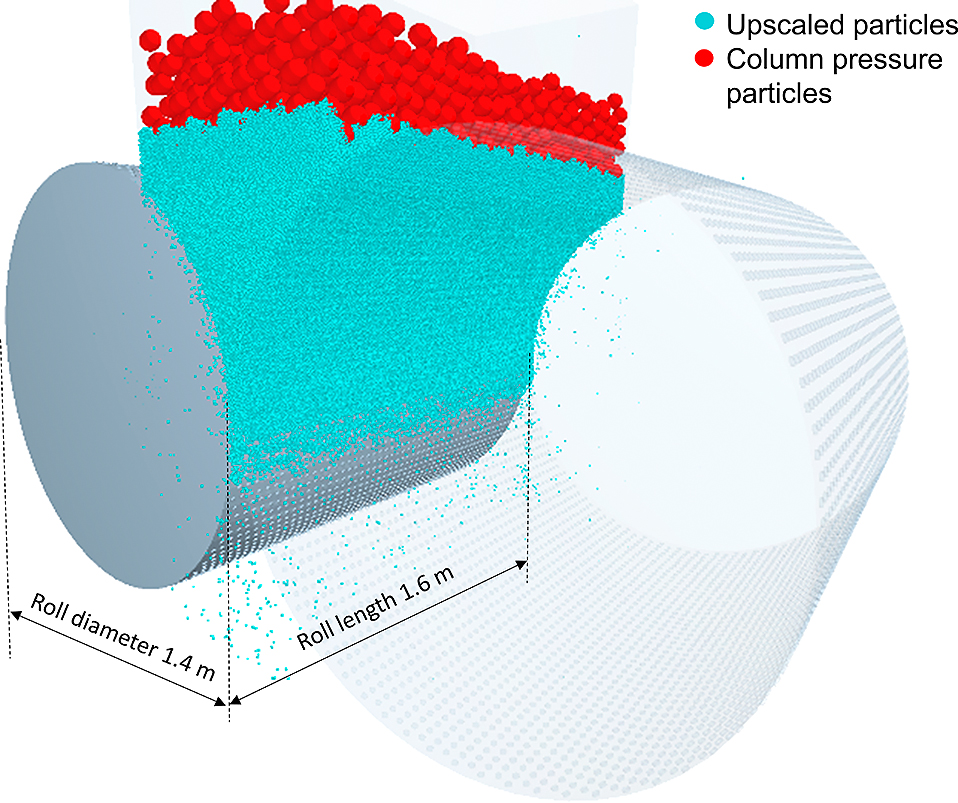
Even though the present approach already used virtual particles that are larger than those in the real operations (upscaled particles), maintaining the hopper level to meet Eqn. 11 imposes a major computational challenge when dealing with simulations of industrial-scale machines. As such, in order to reduce the number of elements required in the simulation, the final portion of the hopper silo was filled with particles of even coarser size (60 mm diameter) and density (10,000 kg/m3)—called column-pressure particles—so as to match the same pressure that would have been generated by piling up additional feed particles. Fig. 2 illustrates this scheme, where these column-pressure particles are placed without interfering with the rolls. It is worth mentioning that, although these particles move downwards as rolls rotate, the short simulation times required to reach steady state conditions prevented them from ever contacting the rolls.
3.2.3 Measurement of key variables in DEM simulations
As part of the hybrid simulation approach, the DEM simulations directly provide throughput and power of the HPGR, as informed in Table 1. Indeed, total throughput between the rolls was estimated with a cylindrical geometry sensor positioned underneath the working gap. The total power was calculated based on the torque required to rotate the rolls multiplied by the rotation frequency. The mass flowrate in each block (Vk) and axial compressive force (Fk) profiles were estimated from a grid bin located in the compression zone, presented in detail elsewhere (Rodriguez et al., 2022a).
With the aim of providing an additional comparison with both phenomenological and hybrid approaches, the size distribution from the DEM simulations using PRM was also computed. The approach used to obtain the particle size distribution using the Tavares PRM can be found elsewhere (Tavares et al., 2021).
3.3 PBM parameter estimation
The proposed Hybrid model was implemented in MatlabTM (version R2021a, Mathworks Inc.), which is the platform also used in predictions using the Modified Torres and Casali model. Initially, the parameter optimization was performed on a base case test, which consisted in the pilot-scale experiment with a peripheral roll velocity of 0.35 m/s and specific compressive force of 2.5 N/mm2 (reference test #1 in Table 4). Breakage function parameters (Eqn. 2) were estimated as part of previous studies by Campos et al. (2019a), being also used in the present work. The three remaining parameters in Eqn. 3 were then calibrated from reference test #1.
Table 4
Operating conditions of the reference tests.
| Variable |
Reference test |
| #1 |
#2* |
| Specific force (N/mm2) |
2.5 |
3.5 |
| Operating pressure (bar) |
38.6 |
48.5 |
| Operating gap (mm) |
8.2 |
7.4 |
| Roll peripheral velocity (m/s) |
0.35 |
0.50 |
| Throughput (t/h) |
19.9 |
26.8 |
| Power consumption (kW) |
47.2 |
66.1 |
| Specific energy (kWh/t) |
2.37 |
2.47 |
| Passing 45 μm in product (%) |
52.3 |
52.0 |
| Product BSA (cm2/g) |
800 |
820 |
* Additionally used to calibrate the power and throughput model in the Modified Torres and Casali model.
Parameter optimization for DEM simulations, used in power and mass flowrate predictions in the Hybrid model was conducted as part of an earlier work (Rodriguez et al., 2022a), whereas in the case of the Modified Torres and Casali model, reference tests #1 and #2 (Table 4) were used. Two parameters from the throughput model (Table 1) were kept constant and equal to values from a previous study (ϕ = 100 and τ = 0.1), since they were found to be valid for a range of machines (Campos et al., 2019a). The single fitting parameters for the nip angle model (κ) and the remaining parameter for the throughput model (υ) were then calibrated on the basis of the reference tests in Table 4. This was used to ensure that the model was properly calibrated to capture variations when the HPGR was operating under different conditions. In order to ensure a parabolic pressure profile as assumed by Campos et al. (2019a), parameter μ from Table 1 was set to 0.05. From the fitted parameters, prediction of the remaining pilot-scale experiments as well as the industrial-scale survey was performed.
The optimal parameters were fitted using the function fminsearch from MatlabTM (version R2021a, Mathworks Inc.), which allows finding the minimum of unconstrained multivariable function using the derivative-free method. The objective function consisted of the sum of squares of the differences in the logarithms of the experimental and fitted cumulative particle size distribution values of reference test #1.
Comparison between predictions by the different models and the experimental results were carried out from computations of the relative absolute deviation given by ɛABS = 100|varExp − varCalc|/varExp, where varExp is the experimental variable and varCalc is the calculated variable. Besides power, throughput and product size distribution, Blaine specific surface area (BSA) was also analyzed. Predictions of BSA from simulated product size distributions were computed using the approach described elsewhere (Campos et al., 2019b).
4. Results and discussion
4.1 Parameter fitting
Different base cases were used for predictions of throughput and power in each approach. The DEM-MBD-PRM approach, used in the proposed Hybrid model, was able to make predictions of power and throughput of the pilot HPGR campaign. In that procedure, Rodriguez et al. (2022a) based their results on reference test #2 (Table 4). No particular calibration was carried out using industrial data. On the other hand, selected parameters of the power and throughput equations (Table 1) for the Modified Torres and Casali model (Campos et al., 2019a; Campos et al., 2021a) were calibrated from reference tests #1 and #2 in Table 4, resulting in the values of υ = 155 and κ = 3.2. The different values for these parameters from those previously fitted on the basis of data from pressing dry pellet feed fines may be attributed to the effect of moisture content.
In predicting size reduction, the optimal parameters fitted for the Hybrid model and the Modified Torres and Casali model are shown in Table 5. Both the non-normalizable breakage and the selection functions are illustrated in Fig. 3, which show that nearly identical specific selection functions were obtained from the parameter optimization procedure. The results compared to the experimental data are presented in Fig. 4, demonstrating that good agreement was reached between model and experiments, with values of the objective function of 0.038 for the Hybrid model and 0.040 for the MTC model. Results allow to conclude that the non-normalizable breakage function parameters proposed in a previous study (Campos et al., 2019a) remain valid in the present work. A closer examination of predicted product BSA shows that good agreement between fitted and predicted values for size reduction was obtained, since absolute deviations from measurements were 0.7 % and 0.5 % for the Modified Torres and Casali and Hybrid models, respectively. It is worth mentioning that values of the specific selection function in Table 5 differ from those reported in earlier studies (Campos et al., 2019a) primarily due to setting
x_1=1mm
in Eqn. 3.
Table 5
Fitted selection and breakage function parameters.
| Equation |
Parameter |
MTC |
Hybrid model |
| Breakage function (Eqn. 2) |
γ |
0.896 |
0.896 |
| β |
5.461 |
5.461 |
| φ |
0.857 |
0.857 |
| η |
0.46 |
0.46 |
| ω (mm) |
0.013 |
0.013 |
| Selection function (Eqn. 3) |
ξ1 |
−0.491 |
−0.492 |
| ξ2 |
−0.191 |
−0.190 |
|
s
1
E
(
t
/
kWh
) |
0.260 |
0.247 |
Based on the calibrations from Section 4.1, both modelling approaches were applied to predict the remaining pilot-scale tests (Table 2) pressing iron ore concentrates. Initially, Fig. 5 compares measured and predicted throughputs, highlighting the good agreement between both model approaches and experiments. As discussed by Rodriguez et al. (2022a), good predictions were achieved using DEM-MBD-PRM simulations with average absolute deviation of 7.2 %, with larger overestimations for tests at higher throughputs (peripheral roll velocity of 0.70 m/s). Predictions of the Modified Torres and Casali model, on the other hand, show a smaller deviation of 4.6 %, underestimating values for roll peripheral velocity of 0.70 m/s.

A comparison between measured and predicted power consumptions in the pilot-scale HPGR using the Hybrid model and the MTC model is presented in Fig. 6 (top). Very good agreement is evident between the Hybrid model and experiments, with mean absolute deviations of 7.9 %. Likewise, the MTC model, with κ = 3.2 fitted based on the two pilot-scale tests (Section 4.1), also exhibited good agreement with experiments, with mean deviation of 9.5 %. Likewise, similar deviations of the specific energy predictions were observed in Fig. 6 (bottom), being equal to 7.2 % for the Hybrid model and 8.2 % for the MTC model. Those estimates are very important for both approaches since the predicted product size distributions are directly influenced by them.
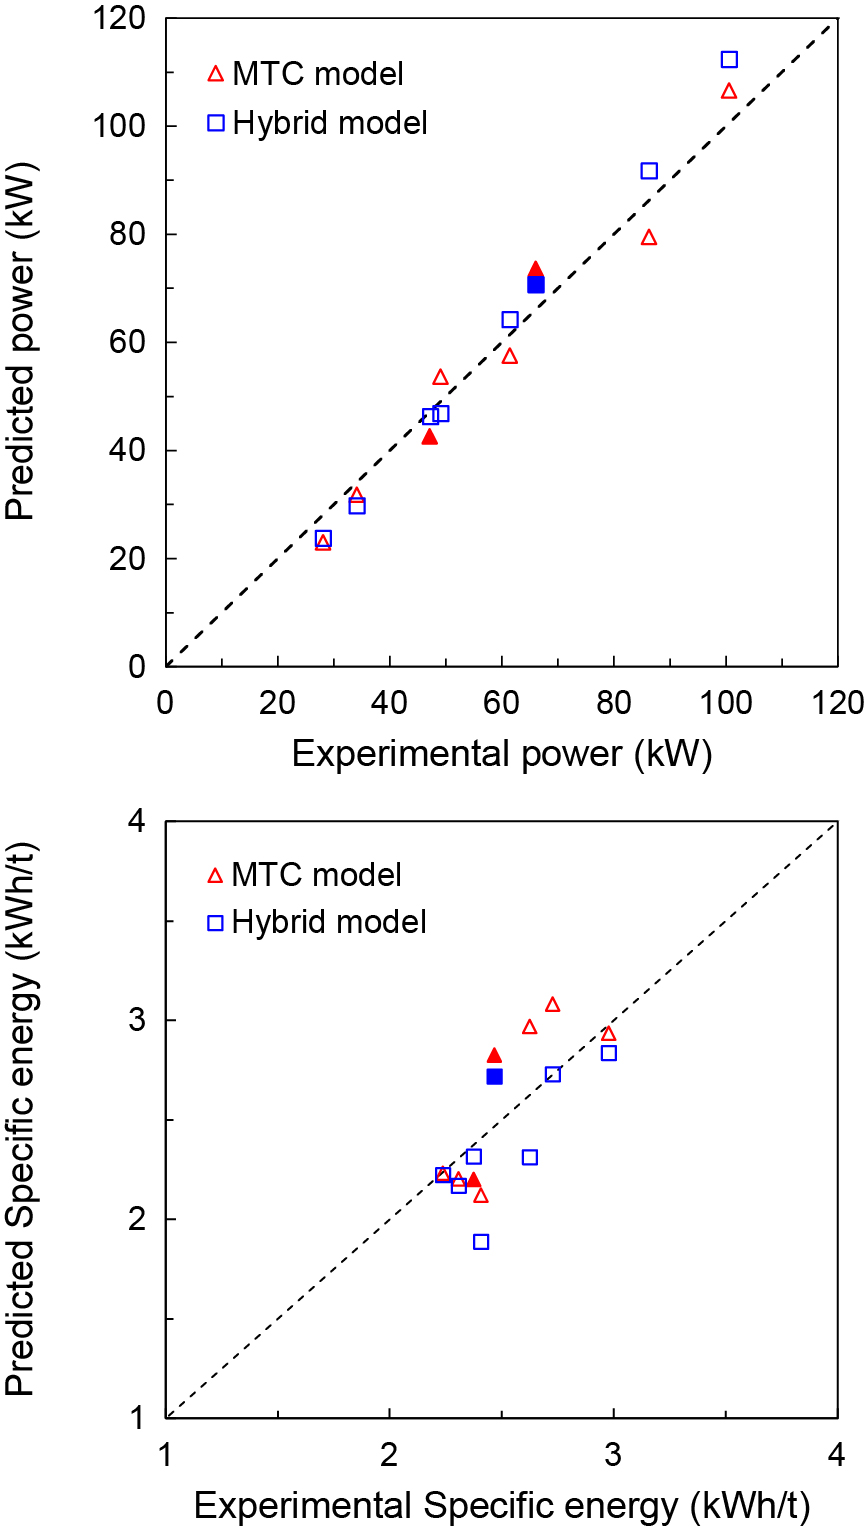
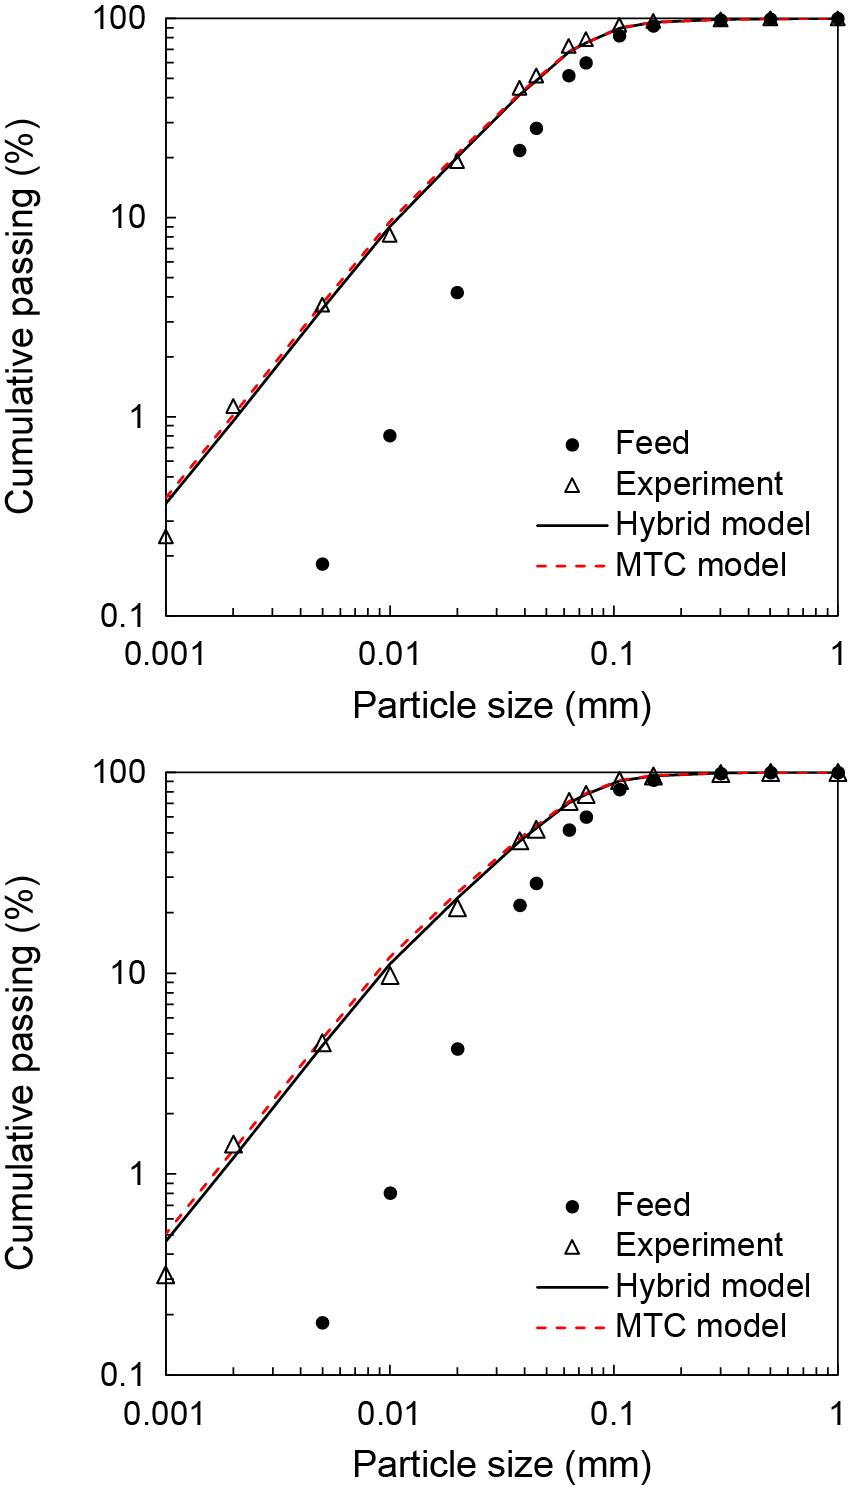
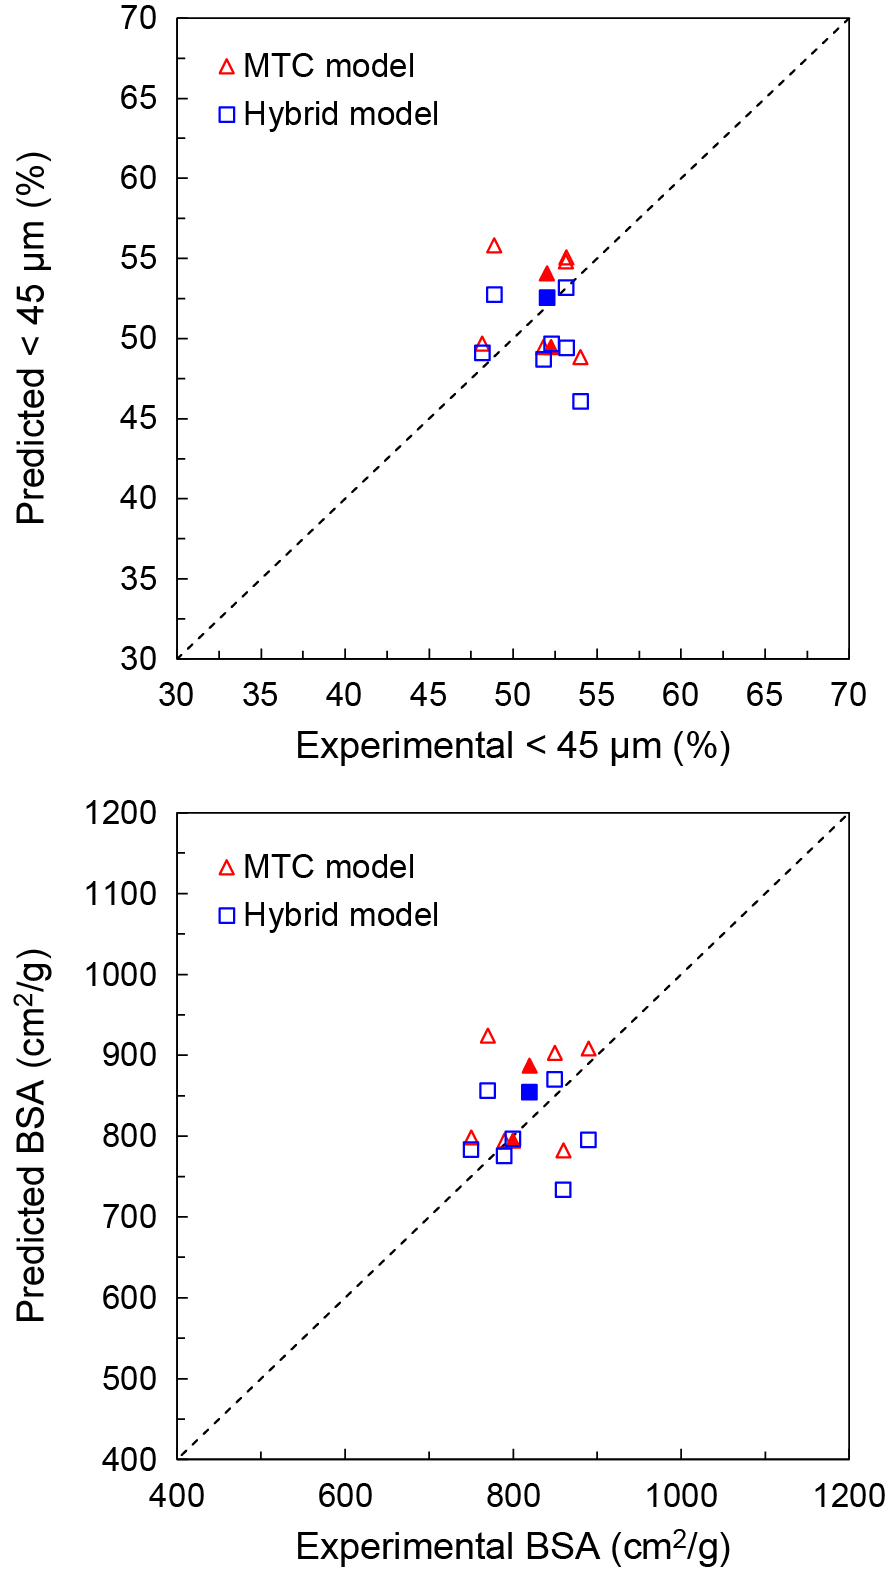
Fig. 7 shows experimental results and predictions of product size distribution from two selected tests run at the roll peripheral velocity of 0.50 m/s. Reasonable agreement is evident, demonstrating the acceptable ability of both modelling approaches in predicting product size distribution when operating conditions are varied. In application of HPGRs to iron ore concentrate pressing, it is routine to check the percent passing the 45 μm sieve to assess the coarser part of the product size distribution, whereas the Blaine specific surface area (BSA) is strongly influenced by its finer portion. As such, Fig. 8 presents a comparison between experimental and predicted values for both indices for all tests performed in the pilot-scale HPGR. In general, Hybrid model predictions are in only reasonable agreement with experiments, with values of average absolute deviations of 5.5 % and 6.2 % for passing in 45 μm and the BSA, respectively. Marginally higher deviations were observed for the MTC model, where average absolute deviations of 5.9 % were obtained for the percentage passing the 45 μm sieve and 6.7 % for the BSA.
A more detailed inspection is also possible from Fig. 9 with a relationship between specific energy consumption and the product BSA. Unlike expected, experimental BSA values did not show clear trend with specific energy. In general, although recent works showed no improvement in size reduction given the increment in roll peripheral velocity (Campos et al., 2019b; Van der Meer and Leite, 2019), it is worth mentioning that HPGR operations with high moisture content as in the present work would provide some acceleration on the compression zone and increase the proportion of material ejected from the edge of the rolls. These features can, at least in part, be responsible for the dispersion of the data in Figs. 8 and 9.
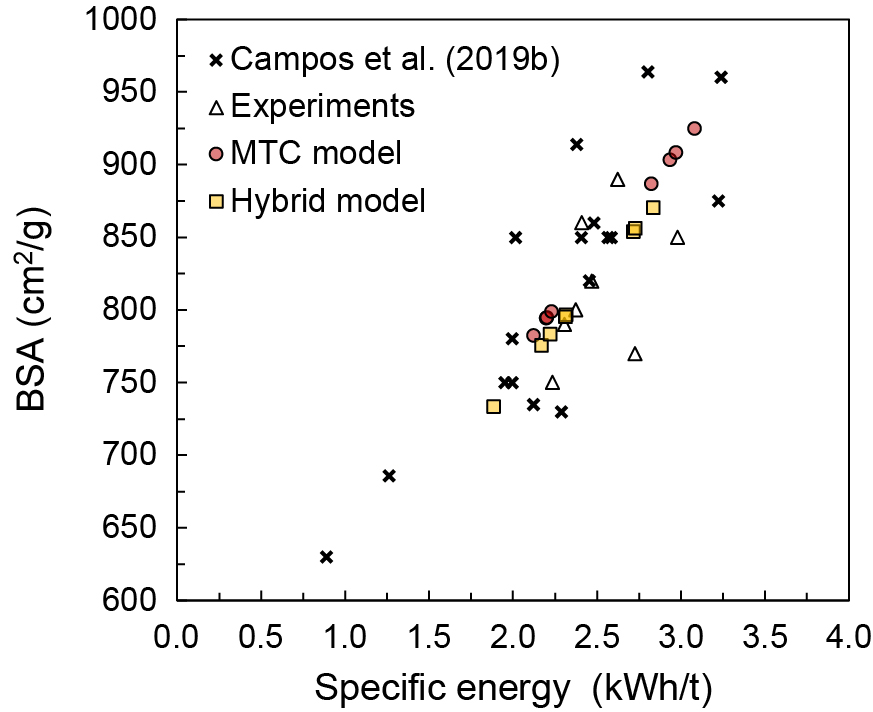
On the other hand, Fig. 9 shows that results from the two models exhibited a clear and direct improvement in the BSA with the increase in specific energy. These results can be explained by the modelling approach adopted in both models, which relies on breakage rates (Eqn. 4) that are calculated from the product of the specific selection function and the ratio between the power consumption and the holdup. As such, although DEM provides a more detailed description, the use of the PBM limits the capability of the model in providing improved descriptions of the effect of operating variables when compared to the phenomenological (MTC) model.
4.3 Axial variation in pilot-scale HPGR
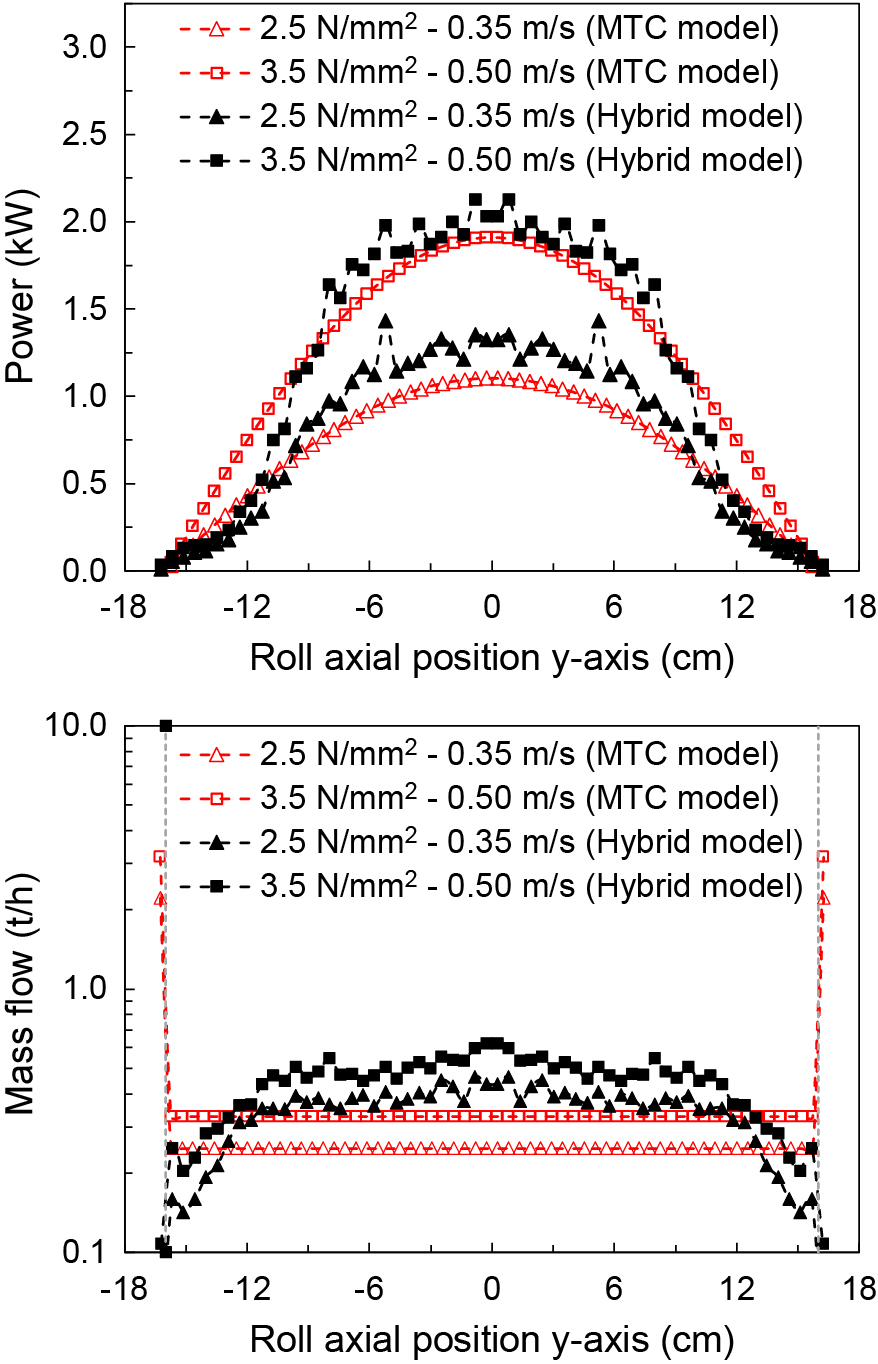
Similarities and important differences appear on how the two model approaches deal with the axial variation of power and mass flow in the HPGR, as illustrated in Fig. 10. Regarding the power profile, as mentioned in Table 1, a parabolic pattern is associated to the MTC model with the highest value at the centre of the rolls, vanishing to zero towards the edges. DEM simulations show a similar pattern, but with a more marked drop towards the edge of the rolls.
Greater differences are found in the throughput profiles, whereas the MTC model gives uniform values between the rolls and a marked step increase at the by-pass region, due to the material ejected beyond the length of the rolls (Fig. 10 bottom). On the other hand, the mass flowrates in the Hybrid model do not show the by-pass effect, since its values are computed within the particle bed. In addition, this approach results in higher values towards the centre of the rolls and lower values towards its edge.
As explained in Section 3.1, samples were collected underneath the rolls to capture the axial variation of the particle size distribution along the rolls. This is an important aspect in HPGR operation since products with coarser particle sizes are known to appear close to the edge of the rolls (Campos et al., 2019b; Lubjuhn and Schönert, 1993; Morrell et al., 1997; Torres and Casali, 2009), in spite of efforts that have been made to prevent it (Van der Ende et al., 2019; Herman et al., 2013). In order to check the ability of the models to describe the variation of product size distribution along the length of the rolls, predictions of selected tests are compared to experiments in Fig. 11 for the pilot-scale HPGR operating at the roll peripheral velocity of 0.50 m/s. Good agreement is evident for both test conditions simulated, in particular for the Hybrid model. Also, as already discussed by Campos et al. (2019a), the parabolic shape profile demonstrates a reasonable description for the pilot-scale HPGR studied in pressing iron ore concentrates.

At first, a snapshot of the DEM-MBD-PRM simulation of the industrial scale HPGR is presented in Fig. 12. Around 2.5 million particles were processed in the simulation, in which the reduction in particle size becomes clear as the bed of particles move towards and through the gap. A summary of the simulation results is presented in Table 6, which shows that the Hybrid model provided reasonable predictions of total power, with a deviation of 17.8 % from the experimental results, with an even closer prediction of throughput, with a deviation of only 2.0 %. Greater deviations are, however, observed when comparing predictions using the modified Torres and Casali model to experiments, with 12.3 % deviation in the case of power and 74.1 % in the case of throughput. This significant overestimation of throughput may be explained by the greater proportion of material ejected by the bypass zone in the model prediction. Similar mass transfer in the centre of the roll was predicted by both models, with around 9 % larger from that estimated from the DEM simulation as part of the hybrid model.
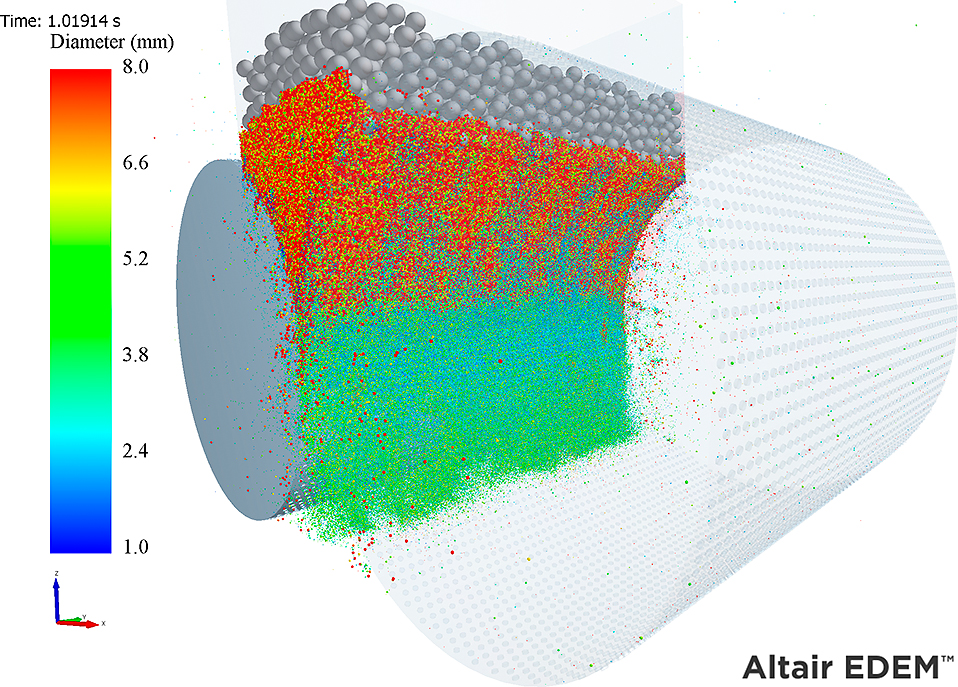
Table 6
Key variables of industrial-scale HPGR with both modeling approaches, with deviations (%) from experiments in parentheses
| Measure |
Survey |
MTC |
Hybrid |
| Power (MW) |
1.17 |
1.31 (12.3) |
1.37 (17.8) |
| Throughput (t/h) |
520 |
905 (74.1) |
509 (2.0) |
| Spec. energy (kWh/t) |
2.24 |
1.45 (35.5) |
2.70 (20.2) |
| Prod. % <45 μm |
48.8 |
42.5 (13.1) |
52.0 (6.6) |
| Prod. BSA (cm2/g) |
890 |
680 (23.5) |
858 (3.6) |
A comparison of the pressure profiles in pilot- and industrial-scale HPGRs predicted using DEM, shown in Fig. 13, demonstrates that the pressure profile in the industrial-scale machine is more constant in the central portion of the rolls. Indeed, the DEM simulation was able to capture this effect that was already reported experimentally by some authors (Campos et al., 2021b; Morley, 2010).

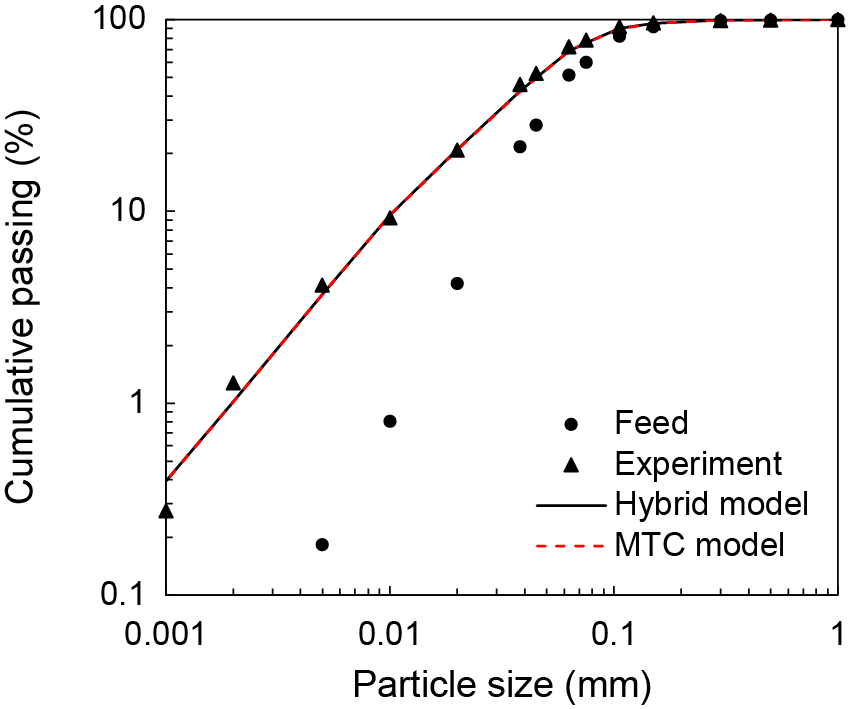
On the basis of the parameters calibrated from a base case test from the pilot-scale test campaign, presented in Section 4.1, predictions of product size distribution of the industrial HPGR survey were carried out using both the Hybrid and the Modified Torres and Casali models. Predictions are presented in Fig. 14, where the Hybrid model shows good agreement with experiments, with an average absolute deviation of 8.0 %. The poor prediction of throughput (Table 6), which directly affects the specific energy, led to the high value of absolute deviation (15.8 %) for the Modified Torres and Casali model. An additional hypothetical case was then simulated. This condition consisted in matching the experimental specific energy in each model and make prediction of the industrial test. These results are presented as dashed lines in Fig. 14, with reductions in absolute deviations to 6.2 % and 6.9 % for the MTC and Hybrid models, respectively.

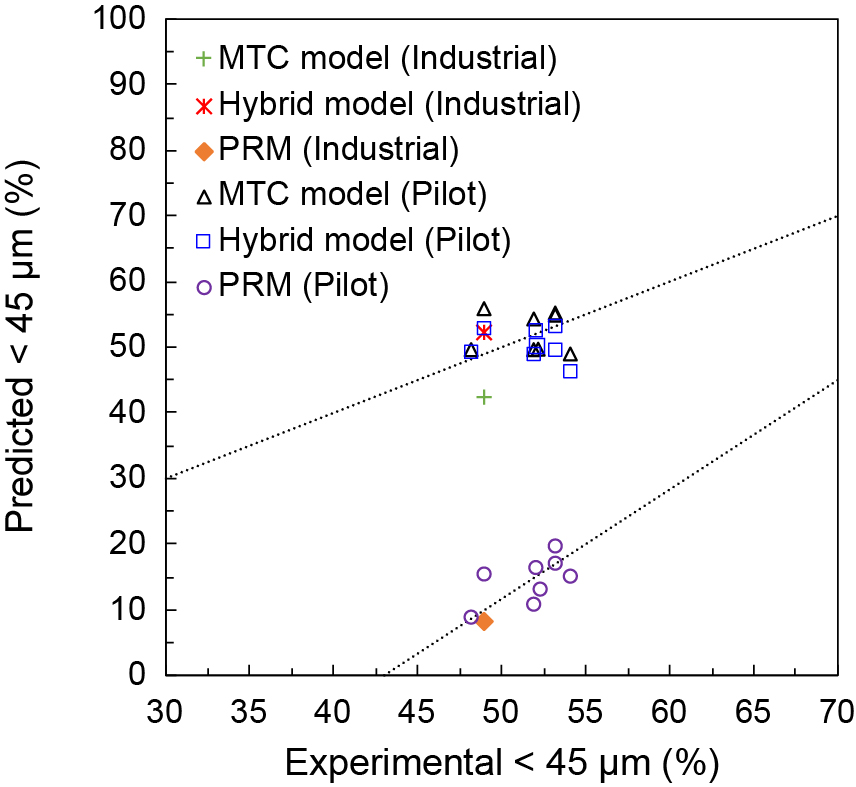
A final comparison is shown in Fig. 15, where predictions of percentage passing the 45 μm sieve for all tests are compared to those obtained using the particle replacement model (PRM) in DEM. As demonstrated in the earlier work (Rodriguez et al., 2022a), the PRM was unable to reach quantitative agreement with experiments. However, although biased, its predictions were more aligned with experiments than both Hybrid and the MTC models, thus demonstrating its great future potential.
5. Conclusions
In order to deal with the limitations of DEM-MBD-PRM approach in predicting quantitatively the fineness of iron ore pellet feed in the HPGR product, a Hybrid model was proposed. The model used throughput and power, besides mass flowrate and force profiles predicted along the rolls obtained from DEM simulations as input to a population balance model (Modified Torres and Casali model), fitted on the basis of a base case test.
The approach was able to predict the product particle size distributions of a pilot-scale HPGR operating at different roll velocities and pressures in size reduction of iron ore pellet feed, but with predictions that were comparable to those obtained using the Modified Torres and Casali model. Advantages of the Hybrid model in this case would only appear if changes are made to the machine in question, such as replacement of cheek plates by flanges or changes in stud patterns, for instance. In these cases, the Hybrid model would be able to capture their effect, whereas the phenomenological model would not.
The Hybrid model demonstrated to provide superior predictions of throughput, power and product fineness than the phenomenological approach when used to predict the performance of an industrial-scale HPGR when the models were fitted using data from pilot-scale tests. This demonstrates the great potential of the Hybrid model to be used in scale-up and design of HPGRs in the future.
Acknowledgements
The authors would like to thank Vale S.A. for financial and technical support to the research, as well as permission to publish the work. We also thank the additional financial support by the Brazilian research agencies CNPq (grant number 151862/2022-2 and 313425/2021-3), FAPERJ (grant number E-26/202.574/2019) and CAPES (finance Code 001 and grant number - 88881.188860/2018-01).
References
- Austin L.G., Trubeljal M.P., von Seebach H.M., Capacity of high-pressure grinding rolls, Mining, Metallurgy & Exploration, 12 (1995) 65–73. DOI:10.1007/BF03403080
- Austin L.G., Weller K.R., Lim I.L., Phenomenological modelling of the high pressure grinding rolls, in: XVIII International Mineral Processing Congress, Sydney, 1993, pp. 87–96.
- Banini G., Evaluation of scale up effect on high pressure grinding roll (HPGR) implementation at PT Freeport Indonesia, in: SAG Conference, Vancouver, Canada, 2011.
- Barrios G.K.P., Tavares L.M., A preliminary model of high pressure roll grinding using the discrete element method and multi-body dynamics coupling, International Journal of Mineral Processing, 156 (2016) 32–42. DOI:10.1016/j.minpro.2016.06.009
- Campos T.M., Bueno G., Tavares L.M., Modeling comminution of iron ore concentrates in industrial-scale HPGR, Powder Technology, 383 (2021a)244–255. DOI:10.1016/j.powtec.2020.12.075
- Campos T.M., Bueno G., Böttcher A., Kwade A., Mayerhofer F., Tavares L.M., Relationships between particle breakage characteristics and comminution response of fine iron ore concentrates, Minerals Engineering, 164 (2021b) 106818. DOI:10.1016/j.mineng.2021.106818
- Campos T.M., Bueno G., Barrios G.K.P., Tavares L.M., Pressing iron ore concentrate in a pilot-scale HPGR. Part 2: modeling and simulation, Minerals Engineering, 140 (2019a) 105876. DOI:10.1016/j.mineng.2019.105876
- Campos T.M., Bueno G., Barrios G.K.P., Tavares L.M., Pressing iron ore concentrate in a pilot-scale HPGR. Part 1: experimental results, Minerals Engineering, 140 (2019b) 105875. DOI:10.1016/j.mineng.2019.105875
- Chelgani C.S., Nasiri H., Tohry A., Modeling of particle sizes for industrial HPGR products by a unique explainable AI tool—A “Conscious Lab” development, Advanced Powder Technology, 32 (2021) 4141–4148. DOI:10.1016/J.APT.2021.09.020
- Cleary P.W., Large scale industrial DEM modelling, Engineering Computations, 21 (2004) 169–204. DOI:10.1108/02644400410519730
- Cleary P.W., Sinnott M.D., Axial pressure distribution, flow behaviour and breakage within a HPGR investigation using DEM, Minerals Engineering, 163 (2021) 106769. DOI:10.1016/j.mineng.2020.106769
- Daniel M.J, Morrell S., HPGR model verification and scale-up, Minerals Engineering, 17 (2004) 1149–1161. DOI:10.1016/j.mineng.2004.05.016
- Davaanyam Z., Klein B., Nadolski S., Using piston press tests for determining optimal energy input for an HPGR operation, in: SAG Conference, Vancouver, Canada, 2015, pp. 1–20.
- Dundar H., Benzer H., Aydogan N., Application of population balance model to HPGR crushing, Minerals Engineering, 50–51 (2013) 114–120. DOI:10.1016/j.mineng.2013.07.005
- Edwards W., Pérez-Prim J., Barrios G.K.P., Tavares L.M., Edward D., Santhanam P., A coupling interface for co-simulation of EDEM with multi-body dynamics, in: 6th International Conference on DEM, Colorado, 2013.
- Esnault V.P., Zhou H., Heitzmann D., New population balance model for predicting particle size evolution in compression grinding, Minerals Engineering, 73 (2015) 7–15. DOI:10.1016/j.mineng.2014.12.036
- Faria P.M.C., Rajamani R.K., Tavares L.M., Optimization of solids concentration in iron ore ball milling through modeling and simulation, Minerals, 9 (2019) 366. DOI:10.3390/min9060366
- Fuerstenau D.W., Shukla A., Kapur P.C., Energy consumption and product size distributions in choke-fed, high-compression roll mills, International Journal of Mineral Processing, 32 (1991) 59–79. DOI:10.1016/0301-7516(91)90019-F
- Hawkins R.A., A Piston and die test to predict laboratory-scale HPGR performance, MPhil Thesis, University of Queensland, 2008. DOI:10.14264/158721
- Herbst J.A., Fuerstenau D.W., Scale-up procedure for continuous grinding mill design using population balance models, International Journal of Mineral Processing, 7 (1980) 1–31. DOI:10.1016/0301-7516(80)90034-4
- Herbst J.A., Mular M.A., Pate W.T., Qiu1 X., Detailed modeling of an HPGR/HRC for prediction of plant scale unit performance, in: International Autogenous Grinding, Semiautogenous Grinding and High Pressure Grinding Rolls Technology Conference, Vancouver, Canada, 2011, pp. 1–20.
- Herman V., Knorr B., Whalen D., HRCTM: taking HPGR efficiency to the next level by reducing edge effect, in: International Mineral Processing Conference, Santiago de Chile, 2013, pp. 195–202.
- King R.P., Modeling and Simulation of Mineral Processing Systems, Butterworth Heinemann, Elsevier, 2001, ISBN: 978-0-08-051184-9. DOI:10.1016/C2009-0-26303-3
- Klymowsky I.B., Liu J., Towards the development of a work index for the roller press, Society for Mining, Metallurgy and Exploration, Inc., Littleton, CO (United States), 1997.
- Lim I.L., Voigt W., Weller K.R., Product size distribution and energy expenditure in grinding minerals and ores in high pressure rolls, International Journal of Mineral Processing, 44–45 (1996) 539–559. DOI:10.1016/0301-7516(95)00064-X
- Liu J., Schönert K., Modelling of interparticle breakage, International Journal of Mineral Processing, 44–45 (1996) 101–115. DOI:10.1016/0301-7516(95)00022-4
- Lubjuhn U., Schönert K., Material flow in the acceleration zone and throughput of high pressure roller mills, in: XVIII International Mineral Processing Congress (IMPC), Sydney, 1993, pp. 161–168.
- Mindlin R.D., Compliance of elastic bodies in contact, Journal of Applied Mechanics, 16 (1949) 259–268. DOI:10.1115/1.4009973
- Mindlin R.D., Deresiewicz H., Elastic spheres in contact under varying oblique forces, Journal of Applied Mechanics, 20 (1953) 327–344. DOI:10.1115/1.4010702
- Morley C., HPGR-FAQ, Journal of the Southern African Institute of Mining and Metallurgy, 110 (2010) 107–115. http://www.scielo.org.za/pdf/jsaimm/v110n3/03.pdf
- Morrell S., An alternative energy–size relationship to that proposed by Bond for the design and optimisation of grinding circuits, International Journal of Mineral Processing, 74 (2004) 133–141. DOI:10.1016/j.minpro.2003.10.002
- Morrell S., Predicting the specific energy required for size reduction of relatively coarse feeds in conventional crushers and high pressure grinding rolls, Minerals Engineering, 23 (2010) 151–153. DOI:10.1016/j.mineng.2009.10.003
- Morrell S., Lim W., Shi F., Tondo L., Modelling of the HPGR crusher, in: Kawatra S.K. (Eds.), Comminution Practices, Society for Mining Metallurgy, 1997, pp.117–126, ISBN: 978-0873351492.
- Morrell S., Helping to reduce mining industry carbon emissions: a step-by-step guide to sizing and selection of energy efficient high pressure grinding rolls circuits, Minerals Engineering, 179 (2022) 107431. DOI:10.1016/j.mineng.2022.107431
- Nadolski S., Bamber A.S., Klein S., Drozdiak J., Investigation into laboratory scale tests for the sizing of high pressure grinding rolls, in: SAG Conference, Vancouver, Canada, 2011, pp. 1–18.
- Nagata Y., Tsunazawa Y., Tsukada K., Yaguchi Y., Ebisu Y., Mitsuhashi K., Tokoro C., Effect of the roll stud diameter on the capacity of a high-pressure grinding roll using the discrete element method, Minerals Engineering, 154 (2020) 106412. DOI:10.1016/j.mineng.2020.106412
- Pamparana G., Klein B., A methodology to predict the HPGR operational gap by using piston press tests, Minerals Engineering, 166 (2021) 106875. DOI:10.1016/j.mineng.2021.106875
- Quist J., Evertsson M., Simulating pressure distribution in HPGR using the discrete element method, in: 8th International Comminution Symposium, 2012, pp. 1–14.
- Rashidi S., Rajamani R.K., Fuerstenau D.W., A review of the modeling of high pressure grinding rolls, KONA Powder and Particle Journal, 34 (2017) 125–140. DOI:10.14356/kona.2017017
- Reid K.J., A solution to the batch grinding equation, Chemical Engineering Science, 20 (1965) 953–963. DOI:10.1016/0009-2509(65)80093-8
- Rodriguez V.A., Barrios G.K.P., Bueno G., Tavares L.M., Investigation of lateral confinement, roller aspect ratio and wear condition on HPGR performance using DEM-MBD-PRM simulations, Minerals, 11 (2021) 801. DOI:10.3390/min11080801
- Rodriguez V.A., Barrios G.K.P., Bueno G., Tavares L.M., Coupled DEM-MBD-PRM simulations of high-pressure grinding rolls. Part 1: calibration and validation in pilot-scale, Minerals Engineering, 177 (2022a) 107389. DOI:10.1016/j.mineng.2021.107389
- Rodriguez V.A., Barrios G.K.P., Tavares L.M., Coupled DEM-MBD-PRM simulations of high-pressure grinding rolls. Part 2: investigation of roll skewing, Minerals Engineering, 178 (2022b) 107428. DOI:10.1016/j.mineng.2022.107428
- Schönert K., A first survey of grinding with high-compression roller mills, International Journal of Mineral Processing, 22 (1988) 401–412. DOI:10.1016/0301-7516(88)90075-0
- Tavares L.M., Rodriguez V.A., Souzani M., Padros C.B., Ooi J.Y., An effective sphere-based breakage model for simulation in DEM, Powder Technology, 392 (2021) 473–488. DOI:10.1016/j.powtec.2021.07.031
- Thivierge A., Bouchard J., Desbiens A., Unifying high-pressure grinding rolls models, Minerals Engineering, 178 (2022) 107427. DOI:10.1016/j.mineng.2022.107427
- Tohry A., Yazdani S., Hadavandi E., Mahmudzadeh E., Chelgani S.C., Advanced modeling of HPGR power consumption based on operational parameters by BNN: a “Conscious-Lab” development, Powder Technology, 381 (2021) 280–284. DOI:10.1016/j.powtec.2020.12.018
- Torres M., Casali A., A novel approach for the modelling of high-pressure grinding rolls, Minerals Engineering, 22 (2009) 1137–1146. DOI:10.1016/j.mineng.2009.04.011
- Van der Ende R., Knapp H., Van der Meer F., Reducing edge effect and material bypass using spring-loaded cheek plates in HPGR grinding, in: SAG Conference 2019, pp. 1–9.
- Van der Meer F.P., Roller press grinding of pellet feed. Experiences of KHD in the iron ore industry. In: Proceedings from the AusIMM Conference on Iron Ore Resources and Reserves Estimation, Perth WA Australia, 1997.
- Van der Meer F.P., Leite I.A., Aspects of HPGR in iron ore pellet feed preparation, in: 6th Brazilian Ore Agglomeration Symposium, São Paulo, 2018, pp. 102–115. DOI:10.5151/2594-357X-31516
- Weerasekara N.S., Powell M.S., Cleary P.W., Tavares L.M., Evertsson M., Morrison R.D., Quist J., Carvalho R.M., The contribution of DEM to the science of comminution, Powder Technology, 248 (2013) 3–24. DOI:10.1016/j.powtec.2013.05.032
Authors’ Short Biographies
Victor Alfonso Rodriguez

Victor Rodriguez received his Materials Engineering degree from Universidad del Valle in Colombia. He then spent four years working as an R&D engineer in a company focused on refining, manufacturing and recycling precious metals. After that, he joined Universidade Federal do Rio de Janeiro (UFRJ), where he was awarded master’s and doctorate degrees for research dealing with mechanistic modeling and simulation of ball mills and HPGRs, respectively. Victor is currently a post-doctoral fellow at the Laboratório de Tecnologia Mineral (LTM/COPPE/UFRJ) and his research interests include discrete element methods, mechanistic modeling and material characterization.
Túlio Moreira Campos

Túlio Campos is a Metallurgical Engineer graduated at UFRJ and is currently pursuing a master’s degree in Metallurgical and Materials Engineering at the Alberto Luiz Coimbra Institute for Postgraduate Studies and Engineering Research (COPPE/UFRJ). Túlio is a research assistant at the Laboratório de Tecnologia Mineral (LTM/COPPE/UFRJ) and works with mathematical modelling of comminution, process simulations, particle breakage, grinding circuit optimization, multicomponent operations and digital twin technology. Túlio is interested in developing and applying advanced, practical and robust process models to improve and integrate total process simulation as a tool for innovation in the minerals industry.
Gabriel Kamilo Pantoja Barrios

Gabriel Barrios is a Chemical Engineer graduated at Universidad del Valle in Colombia, with master’s and doctorate degrees from UFRJ in Brazil. He is currently a post-doctoral fellow at the Laboratório de Tecnologia Mineral of the Alberto Luiz Coimbra Institute for Postgraduate Studies and Engineering Research (LTM/COPPE/UFRJ). His research interests include particle characterization, mathematical modelling and simulation of mineral processing equipment, simulation using the discrete element method and geometallurgy. He has experience in experimental work in metallurgical laboratory, mineral processing plant surveying, and computational simulation.
Gilvandro Bueno

Gilvandro Bueno is a Master Engineer at Vale S.A. He is a Metallurgical Engineer, graduated from the Universidade Federal de Ouro Preto and has a master’s degree in Metallurgical and Materials Engineering from UFRJ. Prior to his current engagement he worked at Taboca Mineração S.A., Votorantim Cimentos S.A. and Samarco S.A., with a total of 30 years of industrial experience in mineral, cement and pelletizing processes.
Luís Marcelo Tavares

Luís Marcelo Tavares is a Professor at UFRJ in Brazil. He received his bachelor’s degree in Mining Engineering (honors) and his master’s degree from Universidade Federal do Rio Grande do Sul. He was awarded a Ph.D. degree in Extractive Metallurgy at the University of Utah. He has been a member of the faculty of UFRJ since 1998, where he is head and founder of the Laboratório de Tecnologia Mineral and has been Department chairman. His research interests include particle breakage, advanced models of comminution and of degradation during handling, DEM, physical concentration, classification, iron ore processing and development of pozzolanic materials. He is a founding member and currently president of the Global Comminution Collaborative (GCC) and has received several awards from the Brazilian Association of Metallurgy, Materials and Mining (ABM).
 https://ror.org/03490as77


;%0A%09%09%09newWindow.document.open();%0A%09%09%09newWindow.document.write('<img src=%22./Graphics/40_2023011_16.jpg%22>');%0A%09%09%09newWindow.document.close();%0A%09%09)
;%0A%09%09%09newWindow.document.open();%0A%09%09%09newWindow.document.write('<img src=%22./Graphics/40_2023011_17.jpg%22>');%0A%09%09%09newWindow.document.close();%0A%09%09)
;%0A%09%09%09newWindow.document.open();%0A%09%09%09newWindow.document.write('<img src=%22./Graphics/40_2023011_18.jpg%22>');%0A%09%09%09newWindow.document.close();%0A%09%09)
;%0A%09%09%09newWindow.document.open();%0A%09%09%09newWindow.document.write('<img src=%22./Graphics/40_2023011_19.jpg%22>');%0A%09%09%09newWindow.document.close();%0A%09%09)
;%0A%09%09%09newWindow.document.open();%0A%09%09%09newWindow.document.write('<img src=%22./Graphics/40_2023011_20.jpg%22>');%0A%09%09%09newWindow.document.close();%0A%09%09)