INTRODUCTION
Ion mobility spectrometry–mass spectrometry (IMS-MS) is an analytical technique that can separate analyte ions based on their collision cross sections (CCSs) and m/z values. As a result, it has been applied to a variety of applications, such as the structural separation of small molecules including peptides and the structural analysis of proteins.1–5) In particular, native mass spectrometry (MS) combined with IMS-MS provides the CCSs of analyte ions that maintain their weak noncovalent bonds in solution, which can be compared to structural ensembles in computational simulations or structural models obtained by other analytical methods, such as X-ray crystallography, nuclear magnetic resonance, and small-angle X-ray scattering.6–11) Therefore, computational methods are still being developed from various perspectives, including computational modeling and gas-phase molecular dynamics (MD), along with improvements in experimental methods.12)
In our previous study, the gas-phase structures of two histone multimers, the H2A-H2B dimer and (H3-H4)2 tetramer, were investigated using IMS-MS and all-atom MD simulations.13) From the obtained results, it was estimated that the intrinsically disordered tail regions of the H2A-H2B dimer fluctuated greatly in solution and collapsed significantly in vacuum due to nonspecific interactions with its core region. In addition, it was suggested that the bimodal CCS distribution of the H2A-H2B dimer observed by IMS-MS (Fig. S1) was due to the conformational diversity of the tail regions.13,14) One possible cause of this conformational diversity may be ion heating, which depends on the parameters set during the measurement.
Protein denaturation can be caused by MS, which is strongly dependent on the instrument parameters. For example, the tetramer of the transthyretin variant dissociates into a monomer and a trimer upon collision-induced dissociation (CID) of the isolated tetramer ion with 15+ charges, when the acceleration voltage increases from 30 to 60 V.15) Furthermore, it was reported that even for cone voltages located in the first vacuum chamber, which are the accelerating voltages present in the source region, higher values of 150 V or more altered the arrival time distribution of the transthyretin tetramer ions, resulting in protein denaturation.6) In contrast, for cytochrome c, arrival time distributions were measured when the trap bias voltage was increased from 40 to 135 V.16) At 40 V, two conformers with CCS around 1600 and 1750 Å2 were mainly observed, as well as a smaller population of more compact form. The former two populations were observed up to a trap bias voltage of approximately 70 V, whereas the latter structure disappeared when the trap bias voltage exceeded 50 V. Thus, ion heating can occur at extremely high voltages, such as for transthyretin, or at normal parameters, such as those measured for cytochrome c.
In this study, we investigated the effect of three instrumental parameters on the arrival time distributions of the H2A-H2B dimer: cone voltage, trap collision energy (trap CE) voltage, and trap bias voltage. Figure 1A shows a schematic diagram of the IMS-MS instrument used in this study. The cone voltage is applied to the sampling cone located in the first vacuum chamber. The trap CE voltage is defined as the voltage between the quadrupole and the trap. The trap CE value is adjusted to optimize the fragmentation efficiency of the ions for tandem mass spectrometry (MS/MS) measurements. The optimized values of the cone and trap CE voltages are dependent on the properties of the analyte ions. To preserve protein structure, it is desirable that these voltages are as low as possible. The trap bias voltage is the acceleration voltage between the last lens before ion mobility separation (IMS) and the IMS cell. Because the introduction efficiency of ions into the IMS cell is the highest at the default value, this parameter is less often adjusted according to the sample than the other parameters. The characteristics of the arrival time distributions obtained from the IMS-MS measurements of the H2A-H2B dimer and their relationships with instrumental parameters are discussed. To estimate the internal energies of the analyte ions for each parameter, we used benzylpyridinium derivatives (R-BnPy+, R- is the substituent group),17,18) which are the temperature-sensitive probes called thermometer ions. As a result, the comparison of the internal energy for various parameter changes is discussed.
EXPERIMENTAL PROCEDURES
Preparation of H2A-H2B dimer
Human histone H2A-H2B dimer was prepared using recombinant H2A and H2B monomers. Each histone protein was prepared as previously described.19,20) Extra residues, GSM-, derived from the expression vector, remained at the N-terminus of each histone monomer after cleavage of the affinity-tag region, as shown in Fig. S2. The purity and molecular masses of these proteins were confirmed by sodium dodecyl sulfate polyacrylamide gel electrophoresis and matrix-assisted laser desorption/ionization time-of-flight MS. These histone monomers were refolded to form dimers, as previously reported.13,20)
Electrospray ionization (ESI)-IMS-MS of H2A-H2B dimer
Mass spectra and arrival times for histone dimers were obtained using a TriWave SYNAPT G2 HDMS (Waters, Milford, MA, USA) with a nanoelectrospray ionization (nanoESI) source. After the refolding process of the H2A-H2B dimer, the dimer solution in 2 M ammonium acetate (pH 6.8) was deposited in gold-coated borosilicate capillaries (8 μm i.d.; Humanix, Hiroshima, Japan) and placed in a nanoESI source. To investigate the effect of the arrival time, three parameters were varied: cone voltage: 20–50 V, trap CE voltage: 4–40 V, and trap bias voltage: 32–50 V. The values of the other parameters applied were as follows: 0.8–1.0 kV for capillary voltage, 40 V for TriWave height, and 800 m/s for TriWave velocity.
ESI-MS/MS analysis of thermometer ions
We used five types of benzylpyridinium as thermometer ions: chloride salts of 4-methoxybenzylpyridinium (CH3O-BnPy+), 4-methylbenzylpyridinium (CH3-BnPy+), benzylpyridinium (H-BnPy+), 4-trifluoromethylbenzylpyridinium (CF3-BnPy+), and pentafluorobenzylpyridinium (F5-BnPy+) (Fig. S3). These compounds were synthesized by treating the corresponding benzyl chloride with pyridine. Stock solutions (100 mM) of the analyte molecules in a 1:1 (v/v) water/acetonitrile solution were prepared and diluted with a 1:1 (v/v) water/acetonitrile solution containing 0.1% formic acid to achieve a concentration of 10 μM. Analyte solutions were deposited in platinum-coated borosilicate capillaries (Humanix) and placed in a nanoESI source. Mass spectra were obtained using a TriWave SYNAPT XS (Waters) with a nanoESI source. To investigate the effect of the internal energy due to parameter changes, two parameters were varied: trap CE voltage: 4–25 V and trap bias voltage: 30–55 V. The values considered for the other applied parameters were as follows: 0.7 kV for capillary voltage, 40 V for TriWave height, and 800 m/s for TriWave velocity.
Calculation of the internal energy in each condition
The fragmentation of R-BnPy+ as the precursor ion led to the formation of the corresponding R-Bn+ and neutral pyridine. Survival yields (SYs) of R-BnPy+ were calculated according to parameters.
For the trap CE voltage, the abundances of the precursor ions Iprecursor and fragment ions Ifragment were used to calculate the SY as shown in Eq. (1):
| SY=IprecursorIprecursor+∑Ifragment | (1) |
For the trap bias voltage, arrival time distributions were analyzed using OriginPro 2018 (OriginLab, Northampton, MA, USA). The arrival time can be decomposed into the observed arrival time on the dissociation occurring before, inside, or after the IMS cell.16,21) Because changes in the internal energy due to the trap bias voltage mainly occur before the analyte ions are introduced into the IMS cell, peak fitting of the observed peaks extracted the peaks that occurred before the IMS cell. The peak areas of the precursor ions Iarea,precursor and fragment ions occurring before, inside, and after IMS cell Iarea,fragment or before the IMS cell Iarea,fragment,before were used to calculate the fragmentation yield before the IMS cell FYbefore and SY before the IMS cell SYbefore as given by Eq. (2):
| FYbefore=Iarea,frament,beforeIarea,precursor+Iarea,fragmet=1−SYbefore | (2) |
Each thermometer ion has an appearance energy of dissociation, Eapp, corresponding to its dissociation rate, kEapp, which is equal to be reciprocal of τ.22,23) Briefly, the kEapp values of R-BnPy+ were calculated by Rice–Ramsperger–Kassel–Marcus theory using their dissociation threshold energy, as reported in the previous work.18) Hence, the internal energy distribution of each parameter was estimated using the derivative of the sigmoid curve obtained from the Eapp value and the SY of the thermometer ions.
RESULTS AND DISCUSSION
Effect of parameters against arrival times of H2A-H2B dimer
First, we analyzed the H2A-H2B dimer by IMS-MS based on the effects of three instrumental parameters: cone voltage, trap CE voltage, and trap bias voltage. In previous studies, we performed the IMS-MS measurements of the H2A-H2B dimer using the following parameters: cone voltage = 20 V, trap CE voltage = 4 V, and trap bias voltage = 40 V.13,14) As a result, the arrival time distribution of H2A-H2B dimer was observed to be bimodal in IMS-MS, smaller and larger conformational populations (Fig. S1). Figure 1B–1D shows the arrival time distributions of H2A-H2B dimer ions with 11+ charges, which were the most intense peaks among the multiple protonated H2A-H2B dimers, when the three parameters were varied independently and the values of the other parameters were fixed. The different intensities at each arrival time by changing the cone and trap bias voltage were caused by the overall intensity changes. In contrast, the different intensities at each arrival time by changing the trap CE voltage were caused by the decrease of the H2A-H2B dimer ion by the dissociation of the dimer. The arrival time distributions varied slightly with cone voltage, which were not considered significant (Fig. 1B). In contrast, on increasing the trap CE values, the detected structural distribution was spread to a longer time than the two conventional populations (Fig. 1C). On the other hand, the ratio of the two populations of the H2A-H2B dimers changed with increasing trap bias voltage, and the abundance of H2A-H2B dimers with larger population increased with increasing trap bias voltage (Fig. 1D). Thus, the obtained two conformational populations in the arrival time distribution of H2A-H2B dimer were caused by the acceleration energy from the trap bias voltage.
As indicated in the introduction, for cytochrome c, two conformers in the arrival time distribution were mainly observed at trap bias voltages from 40 to 70 V.16) On the other hand, a smaller population of more compact form observed at a trap bias voltage of 40 V disappeared when the trap bias voltage exceeded 50 V. In the case of the H2A-H2B dimer (Fig. 1D), the ratio of the two conformational populations changed significantly, despite a lower trap bias voltage (32–50 V). This may be attributed to the structural properties of the H2A-H2B dimer. For proteins with rigid structures, such as cytochrome c, the most compact forms disappeared, but the main conformational distributions were less affected by the trap bias voltage. However, the two conformational distributions of the H2A-H2B dimer were unstable because they arise from nonspecific interactions in intrinsically disordered regions. Notably, the H2A-H2B dimer dissociated at low ammonium acetate concentrations, as previously reported.20) Consequently, the salt concentration of ammonium acetate used to measure the H2A-H2B dimer was 2 M. As a result, the H2A-H2B dimer peaks observed in mass spectra were broadened by salt addition. Therefore, ion heating caused by the increase in trap bias voltage may have stripped off the salt that formed the peaks, resulting in conformational diversity of the H2A-H2B dimer. In summary, it is likely that changes in the ratio of two conformational populations of the H2A-H2B dimer were observed upon varying the trap bias voltage.
By comparing the results for the trap CE voltage and the trap bias voltage, it was found that the trap CE voltage produced a longer structural distribution than the two conventional populations of H2A-H2B dimer. The structures corresponding to the longer structural distribution might be unfolded forms. This indicated that a trap CE voltage of 40 V (purple line in Fig. 1C) induced more ion heating than a trap bias voltage of 50 V (orange line in Fig. 1D). There have been reports of protein denaturation by ion heating with trap CE voltage analyzed by MD simulation by increasing the temperature from 300 to 800 K.24) In contrast, the trap bias voltage value used in this study was the default value used for general measurements. In general, the CCSs of different proteins obtained by IMS-MS are analyzed by comparing structural ensembles in MD simulations at 300 K or structures registered in the Protein Data Bank (PDB).9,10,13,25–27) Thus, it was suggested that the structural diversity of intrinsically disordered regions and two conformational populations observed in the H2A-H2B dimer were due to weak ion heating produced by the trap bias voltage.
Evaluation of parameters using thermometer ions
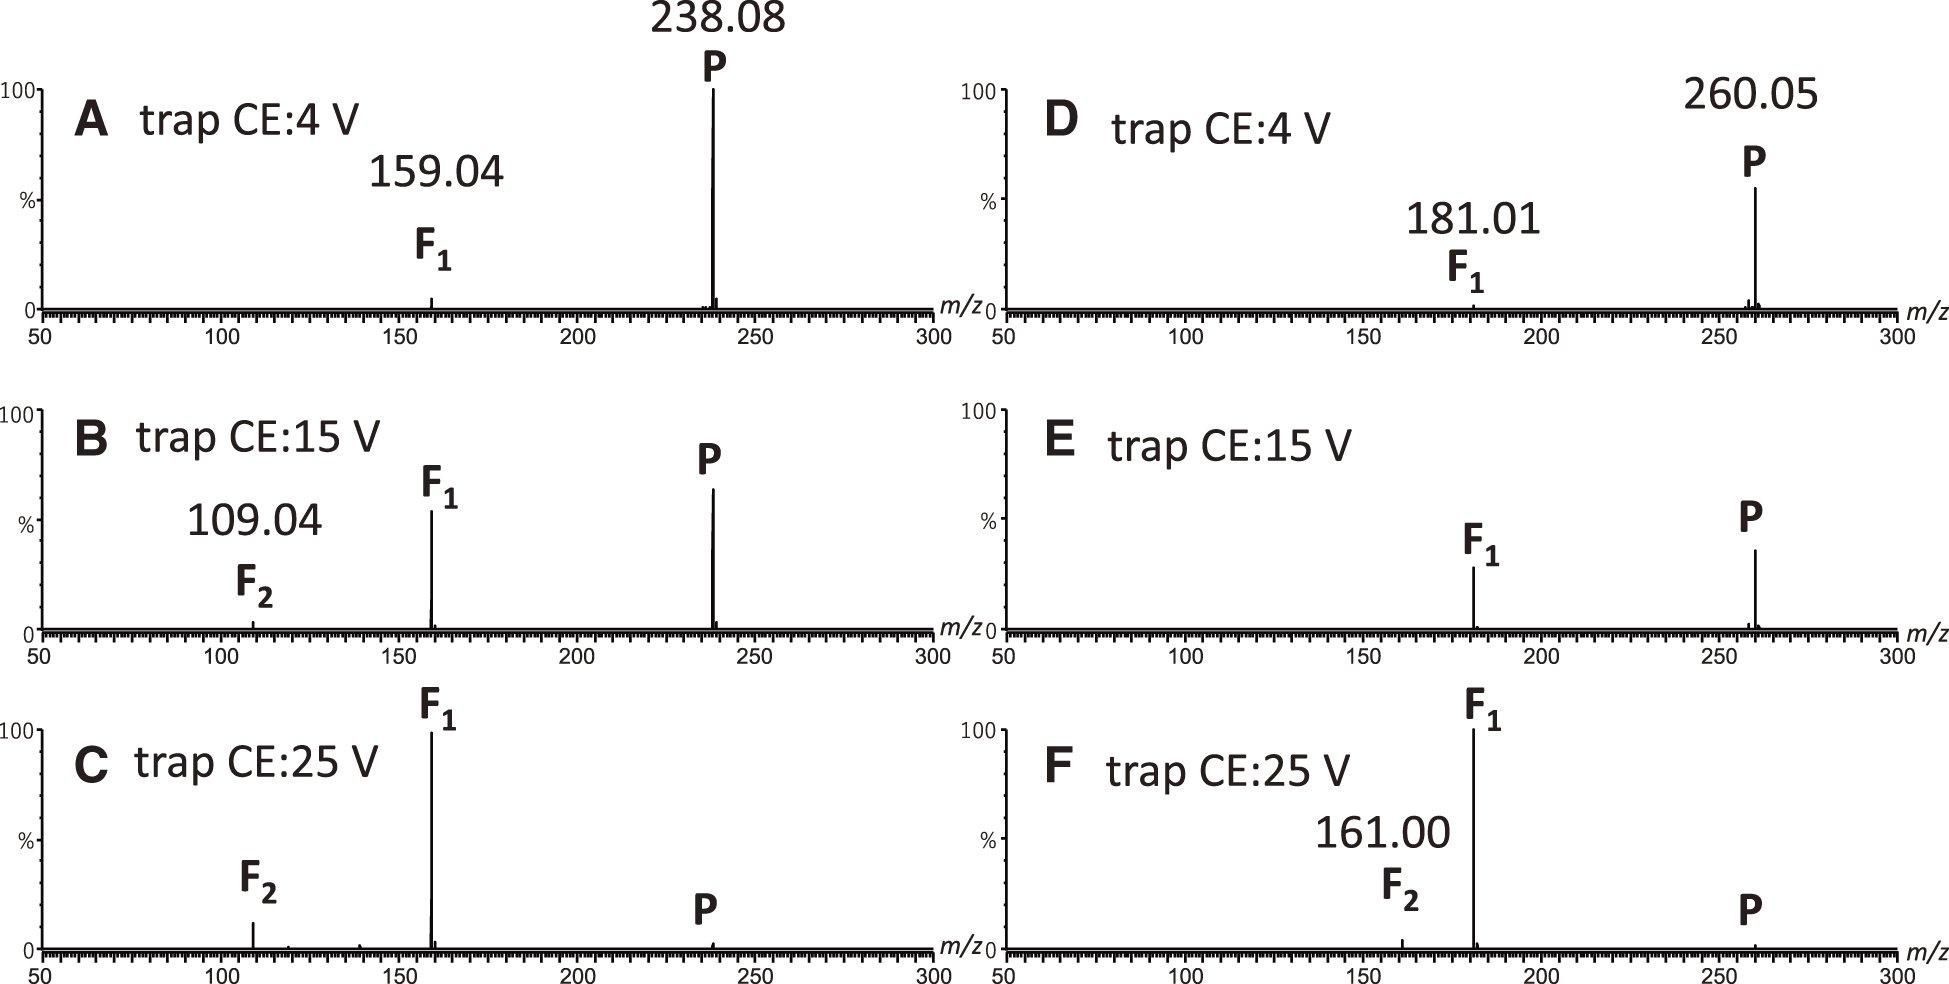
In the previous section, we showed that the structural diversity of intrinsically disordered regions of the H2A-H2B dimer was caused by ion heating at the trap bias voltage. While the change in the arrival time distribution of the H2A-H2B dimer provides information on the effect of the instrumental parameters, it is difficult to evaluate and compare ion heating with each parameter. Therefore, to evaluate ion heating for each parameter (trap CE voltage and trap bias voltage), we estimated the internal energy of the analyte ions using thermometer ions. The most widely used thermometer ions are benzylpyridinium derivatives (R-BnPy+), which preferentially undergo N–C bond cleavage to produce the corresponding R-Bn+ and neutral pyridine. The evaluation of the internal energy with R-BnPy+ has been used to evaluate ion production processes at ion sources,28,29) low-energy CID processes in collision cells,18) and ion separation processes in various IMS mass spectrometers.16,21,30) In this study, CH3O-, CH3-, H-, CF3-, and F5-BnPy+ were used to estimate the effect of the trap CE voltage on the internal ion energy. Figures 2A, 2D, and S4A show the MS/MS spectra of CF3-BnPy+, F5-BnPy+, and H-BnPy+, respectively, at a trap CE value of 4 V as representative examples. In all the MS/MS spectra, the precursor thermometer ions and corresponding benzyl cations were observed as fragment ions. In addition, these thermometer ions were measured at trap CE values ranging from 10 to 25 V. Under these experimental conditions, CH3O-, CH3-, and H-BnPy+ provided the corresponding benzyl cation, CH3O-, CH3-, and H-Bn+, respectively, as the only fragment, F1 (Fig. S4B–S4C). CF3-BnPy+ and F5-BnPy+ provided additional fragments, F2, at m/z 109 and 161, respectively (Fig. 2B, 2C, 2E, and 2F). According to MS3 experiments with the CF3-BnPy+ and F5-BnPy+, the fragment ions at m/z 109 and 161 were identified as fluorobenzyl cations (F-Bn+) and C7HF4+, respectively.18) F-Bn+ and C7HF4+, as F2, originate from the further degradation of CF3-BnPy+ and F5-BnPy+, respectively, indicating that the formation of these fragment ions does not compete with the fragmentation pathway, which should be considered similarly to the N–C bond cleavage of CF3-BnPy+ and F5-BnPy+.18) Consequently, an accurate internal energy distribution of the ion (PE) can be obtained using the SY method, which is calculated using Eq. (1), with the energy required for the N–C bond cleavage of CF3-BnPy+ and F5-BnPy+.
To estimate PE of these thermometer ions, the SY values of R-BnPy+ were calculated using Eq. (1) under each experimental condition and plotted as a function of the appearance energies for the dissociation of thermometer ions (Eapp). Herein, Eapp is dependent on an ion dissociation time (τ) under the experimental conditions. The τ during low-energy CID under multiple collisions was estimated to be on the order of 10−4–10−5 s according to a previous study.31) Consequently, the τ of ion dissociation induced by the trap CE voltage was assumed to be 10−4–10−5 s in this study. The Eapp values of ion dissociation induced by the trap CE voltage (Eapp,CE) of R-BnPy+ are listed in Table 1. The SY values of R-BnPy+ were plotted as Eapp,CE and fitted to a sigmoidal curve, as shown in Fig. 3A. The purple, blue, green, orange, and red dashed lines represent the sigmoidal curves when the trap CE values were set to 4, 10, 15, 20, and 25 V, respectively. All plots were well fitted to each sigmoidal curve. However, the results obtained from the data at 25 V may become inaccurate than the results calculated at other voltages because the SY values of R-BnPy+ were less than 0.018. The PE values obtained from the CID induced by the trap CE voltages (P(E,CE)) were then estimated using the derivative of the sigmoidal curve (Fig. 3B). Consequently, we obtained the mean and full-width at half-maximum (FWHM) values of the P(E,CE) at each trap CE value, as shown in Fig. 3C. The mean and FWHM value of the P(E,CE) of the ions increased with increasing trap CE voltage from 10 V.
Table 1. The
Eapp,CE values of the thermometer ions (eV) for trap CE voltage.
|
CH3O-BnPy+ |
CH3-BnPy+ |
H-BnPy+ |
CF3-BnPy+ |
F5-BnPy+ |
| Eapp,CE/eV |
2.62 |
3.37 |
3.59 |
4.59 |
4.89 |
trap CE, trap collision energy.
Next, the thermometer ions were used to evaluate the effect of the trap bias voltage on the internal energy of the analyte ions. The trap bias voltage is the acceleration voltage between the last lens before the IMS and the IMS cell. The SY values of the IMS cell were calculated from the areas of the arrival time distributions of the precursor ions and the corresponding fragment ions.21) The arrival time distribution includes the time before, inside, and after the IMS cell, whereas an increase in the trap bias voltage mainly induces fragmentation before the IMS cell, as reported by Morsa et al.21) Therefore, we extracted the arrival time distributions corresponding to the fragments before the IMS cell and calculated the SYbefore values using Eq. (2). To estimate PE of the ions as well as trap CE voltage, the ion dissociation time τ during trap bias voltage (τIMS,before) was estimated. The τIMS,before corresponds to the time spent by one wave for introduction into the IMS cell. It has been reported that m/z independent drift times in the transfer cell were calculated using the IMS wave speed and transfer cell length. Hence, using the same method,21) the τIMS,before was calculated as 10−4 s based on the wave velocity (800 m/s) and the length of the trap cell (100 mm), and Eapp values of ion dissociation induced by trap bias voltage (Eapp,bias) were estimated, as shown in Table 2. The SYbefore values of R-BnPy+ against obtained Eapp,bias values were fit to a sigmoidal curve, as shown in Fig. 4A. The purple, gray, blue, green, orange, and red dashed lines represent the sigmoidal curves when the trap bias voltage was set to 30, 35, 40, 45, 50, and 55 V, respectively. The transmission efficiency of ions into the IMS cell is highest at 45 V, which is the default value of the instrument. The PE values obtained by the dissociation induced by the trap bias voltage (P(E,bias)) were then estimated using the derivative of the sigmoidal curve (Fig. 4B). Furthermore, the mean and FWHM values of P(E,bias) were calculated for each trap bias voltage, as shown in Fig. 4C. The mean P(E,bias) of the ions gradually increased with increasing trap bias voltage, whereas their FWHM values were almost constant at trap bias voltages from 30 to 40 V. These results indicated that lowering the trap bias voltage below the default value resulted in a slight decrease in the internal energy of the analyte ions. This slight change in internal energy was attributed to the structural diversity of intrinsically disordered regions of the H2A-H2B dimer.
Table 2. The
Eapp,bias values of the thermometer ions (eV) for trap bias voltage.
|
CH3O-BnPy+ |
CH3-BnPy+ |
H-BnPy+ |
CF3-BnPy+ |
F5-BnPy+ |
| Eapp,bias/eV |
2.53 |
3.25 |
3.47 |
4.43 |
4.73 |
From the above results, the internal energy increased with increasing trap CE and trap bias voltages. Increasing the trap CE voltage rapidly increased the P(E,CE) values (Fig. 3C) and resulted in a larger conformational population than the two conventional populations of the H2A-H2B dimer (Fig. 1C). The change in P(E,CE) values was related to a larger structural change than the two populations in the arrival time distributions of the H2A-H2B dimer. This suggests that conformational changes such as protein denaturation can be understood by evaluating the internal energy of ions using thermometer ions. In contrast, changing the trap bias voltage had little effect on the P(E,bias) values (Fig. 4C), but changed the ratio of the two conventional populations of the H2A-H2B dimer (Fig. 1D). This implies that the structural change corresponding to the two conformational populations of H2A-H2B dimer occurs at a slight energy change that cannot detect the P(E,CE) value. As a result, the trap bias voltage needs to be set to the lowest possible value for analysis under conditions not subject to ion heating. However, when the trap bias voltage was 36 V, the peak intensity of the H2A-H2B dimer ion with 11+ charges observed in mass spectrum was approximately 8 times lower than the default setting for Synapt G2 (40 V) (data not shown). This indicates that the trap bias voltage is critical for ion transition in the IMS cell. Therefore, the trap bias voltage should be set with attention to the transport efficiency of the ions as well as the properties of the analytes.
In this study, to determine the effect of ion heating in a mass spectrometer on the structural diversity of the H2A-H2B dimer, the effects of three parameters, cone voltage, trap CE voltage, and trap bias voltage, were investigated. Among the three parameters, the trap CE voltage had the greatest effect on ion heating, resulting in a larger conformational population of the H2A-H2B dimer than the two previously observed populations. In addition, the two previously observed populations of the H2A-H2B dimers were found to be caused by ion heating due to the trap bias voltage. In addition, to evaluate the heating of ions at the trap CE and trap bias voltages, thermometer ions, five different R-BnPy+ ions, were used to estimate the internal energy of the ions. As a result, the trap CE voltage imparted greater internal energy to the ions than the trap bias voltage. Structural changes in protein, such as protein unfolding, can be detected as a change in the internal energy using thermometer ions, whereas few structural changes corresponding to the two populations in the arrival time distribution of the H2A-H2B dimer can be detected. The structural populations of the H2A-H2B dimer analyzed by IMS-MS were attributed to slight ion heating. In the future, it is hoped that temperature evaluation using biomacromolecules with molecular weights larger than those of the current thermometer ions will lead to more accurate discussions.