INTRODUCTION
High-resolution mass spectrometry (MS) has been used to obtain an accurate mass-to-charge ratio (m/z) value of observed ions in non-targeted metabolome analysis studies.1,2) Moreover, product ion spectra have been comprehensively acquired from the observed ions by the data-dependent acquisition (DDA) or the information-dependent acquisition (IDA) modes of the quadrupole-time-of-flight (Q-TOF)-MS and Q-Kingdon trap or Orbitrap-MS.3–8) In the DDA mode, a full-scan mass spectrum was obtained without fragmentation (MS1 scan). The product ion spectra were automatically obtained from a set of the most abundant ions as the precursor ions (MS2 scan).9)
The accurate m/z values and product ion spectra data provide a basis for a structural elucidation of metabolites.10) However, errors in m/z values in product ion spectra inevitably restrict the narrowing of candidate molecular formulas. Moreover, detailed assignment of product ions was also confused from the presence of noise peaks in product ion spectra.11–13) A previous study reported that the accuracy of m/z values and signal-to-noise levels of product ion spectra could be improved by generating an averaged product ion spectrum from a set of similar product ion spectra recorded in a DDA dataset.14) Furthermore, it was demonstrated that the quality improvement contributed to reducing the number of candidate molecular formulas and elucidating a more detailed metabolite structure.14)
The averaged product ion spectra were generated using the redundancy of product ion spectra data in a DDA dataset. In this report, “a raw spectrum” and “an averaged spectrum” indicate a product ion spectrum recorded in a DDA dataset and an averaged product ion spectrum generated from a set of similar raw spectra. A single DDA data file often contains two or more closely similar raw spectra obtained from an identical precursor ion, depending on the settings of the DDA mode, such as the number of maximum candidate ions, the level of intensity threshold exceed, the time period to exclude former candidate ions, and the dwell time for one MS2 scan. In this study, the redundancy of raw spectra in one DDA data file is called the intrafile redundancy. Furthermore, typical metabolomics studies acquire a set of DDA data files from a series of biological samples with similar compositions of metabolites.15–20) For example, a non-targeted metabolomics dataset consists of 248 DDA data files from different New York firefighters’ serum samples.21) Thus, the dataset contains the interfile redundancy of product ion spectra of metabolites commonly existing among the biological samples.
In the averaging method tested in the previous study, two raw spectra data are considered “similar” when three indexes are within threshold levels.14) The indexes are the retention time gap (ΔRT), the m/z gap of precursor ions (Δm/z), and the cosine product score of two product ion spectra (S). The previous study arbitrarily employed ΔRTthres ≤1.0 min, Δm/zthres ≤0.01, and Sthres ≥0.9 as the threshold levels for averaging raw spectra in a Q-TOF-MS dataset acquired in a yeast lipidomics study.14,22) A similarity network was constructed after the determination of similarities among all raw spectra in a DDA dataset. Clusters or complete graphs of similar raw spectra were extracted from the similarity network. Averaged spectra were created by integrating all raw spectra in one cluster.14) Here, the symbol n indicates the number of raw spectra used to produce one averaged spectrum.
As mentioned above, the averaging method depends on the redundancy in a DDA dataset. However, origins, degrees of redundancy, and variations among datasets were not well characterized. Moreover, an optimal level of the most critical threshold, Sthres, remains unclear. The aims of this study are an investigation of the nature of the redundancy in a DDA dataset and a determination of an optimal Sthres level. For this purpose, spectral averaging was performed for eight DDA datasets of non-targeted metabolomics studies. The analysis revealed that the nature of redundancy partly depended on the type of mass analyzers and that an optimal level of Sthres was 0.8–0.9. It was also demonstrated that the DDA datasets contain many similar raw spectra obtained from broadly eluting compounds. One of the compounds was deduced to be a plasticizer, di(2-ethylhexyl)phthalate (DEHP), indicating that contamination of biological samples was another origin of spectral redundancy.
RESULTS
Spectra averaging using public DDA datasets
This study used seven DDA datasets downloaded from the metabolomics data repositories (Table 1).27–29) In addition, a yeast lipidomics dataset obtained in our previous study was also employed.22) The averaging tasks were performed for all datasets using the thresholds described in the Experimental procedure. The graphical summary of the averaging workflow is available in my previous report.14) The threshold levels at Sthres=0.8 and ΔRTthres=1.5 were commonly used in this section. Moreover, the minimal number of n was set at 10 because the previous study showed a good balance between the number of raw spectra and the degree of quality improvement.14)
For example, the Set 1 dataset consisted of 46 data files acquired from human serum samples by the Q-Orbitrap-MS (Table 1), whose total number of raw spectra was 606,149 (Table 2). Among them, 562,440 raw spectra were utilized to generate 8,104 averaged spectra for the spectral averaging (Table 2). Here, Total, Utilized, and Averaged represent the total number of raw spectra in a dataset, the number of raw spectra utilized to generate averaged spectra, and the number of averaged spectra, respectively. Moreover, to evaluate a degree of redundancy, the utilization ratio (UR), the mean number of raw spectra used to generate one averaged spectrum (nmean), and the summary ratio (SR) were defined as follows:
Table 2. Results of the spectral averaging at
Sthres=0.8.
|
Set 1 |
Set 2 |
Set 3 |
Set 4 |
Set 5 |
Set 6 |
Set 7 |
Set 8 |
| Type |
Q-Orbitrap |
Q-TOF |
Q-TOF |
Q-Orbitrap |
Q-Orbitrap |
Q-TOF |
Q-TOF |
Q-TOF |
| Number of data files |
46 |
40 |
40 |
31 |
31 |
60 |
60 |
45 |
| The number of raw spectra in dataset, Total |
606,149 |
213,879 |
188,954 |
212,316 |
215,967 |
548,647 |
512,375 |
504,072 |
| The number of raw spectra utilized for averaging, Utilized* |
562,440 |
102,414 |
71,642 |
178,747 |
211,528 |
119,680 |
125,827 |
121,834 |
| The number of averaged spectra, Average* |
8,104 |
2,869 |
2,158 |
683 |
831 |
3,808 |
3,857 |
2,400 |
| Used ratio (UR)* |
0.928 |
0.479 |
0.379 |
0.842 |
0.979 |
0.218 |
0.246 |
0.242 |
| Mean number of raw spectra used to generate one averaged spectra (nmean)* |
69.4 |
35.7 |
33.2 |
261.7 |
254.5 |
31.4 |
32.6 |
50.8 |
| Summary ratio (SR)* |
0.0134 |
0.0134 |
0.0114 |
0.0032 |
0.0038 |
0.0069 |
0.0075 |
0.0048 |
| Mean number of ion signals in one averaged spectrum* |
27.1 |
41.4 |
31.4 |
5.4 |
19.8 |
12.53 |
7.3 |
14.7 |
| Ratio of signals observed more than 90% of raw spectra* |
0.73 |
0.68 |
0.66 |
0.85 |
0.84 |
0.62 |
0.65 |
0.72 |
| Summary ratio (SR) when ΔRTthres=∞** |
0.0116 |
0.0127 |
0.0105 |
0.0022 |
0.0030 |
0.0060 |
0.0065 |
0.0046 |
*Data processing was performed using ΔRTthres=1.5.
**Data processing was performed using ΔRTthres=∞.
Q-TOF, quadrupole-time-of-flight.
For the case of Set 1, the numbers of Total, Utilized, and Averaged were 606,148, 562,440, and 8,104, from which the UR, nmean, and SR levels were determined to be 0.928, 69.4, and 0.0134, respectively (Table 2). These results indicated that more than 92% of raw spectra were employed to generate averaged spectra and that 69.4 raw spectra were integrated into one averaged spectrum on average. Due to the redundancy, the number of Averaged was only 1.34% of the Total. The results indicated that interfile and intrafile redundancy contributed to the overall redundancy because the nmean level, 69.4, was approximately 1.5 times larger than the number of data files, 46 (Table 2).
Large variation in spectra redundancy among DDA datasets
The results shown in Table 2 revealed a significant variation in spectra redundancy among DDA datasets. The UR, nmean, and SR level ranges were 0.218–0.979, 31.4–261.7, and 0.0022–0.0127, respectively. For example, the UR and nmean levels of Set 6 acquired by the Q-TOF-MS were the smallest among the eight datasets. The UR level at 0.218 means that more than 78% of raw spectra were irreproducible and did not contribute to generating averaged spectra. The nmean level was 31.4, about half of the file number of the dataset, 60.
On the other hand, the largest level of UR was observed for Set 5 acquired by the Q-Orbitrap-MS. The UR level was 0.979, indicating that only 2.1% of raw spectra were useless. The nmean value was 261.7, more than eight times larger than the file numbers of the datasets (Table 2). It indicates that similar raw spectra are acquired multiple times from one precursor ion during one analysis. Due to the large intrafile redundancy, the levels of Averaged and SR of Set 5 were 831 and 0.0038, respectively, which were the second smallest among the eight datasets (Table 2).
The comparative analysis also highlighted that there were different trends between the datasets acquired by the Q-TOF-MS and Q-Orbitrap-MS. For instance, the UR levels of the dataset acquired by the Q-TOF-MS were less than 0.479, while those of the Q-Orbitrap-MS were above 0.842 (Table 2). Moreover, the nmean levels of the Q-TOF-MS datasets were smaller than those of the Q-Orbitrap-MS datasets (Table 2). These trends indicated that the Q-Orbitrap-MS datasets tended to have larger intrafile redundancy and smaller irreproducible raw spectra ratio than the Q-TOF-MS datasets.
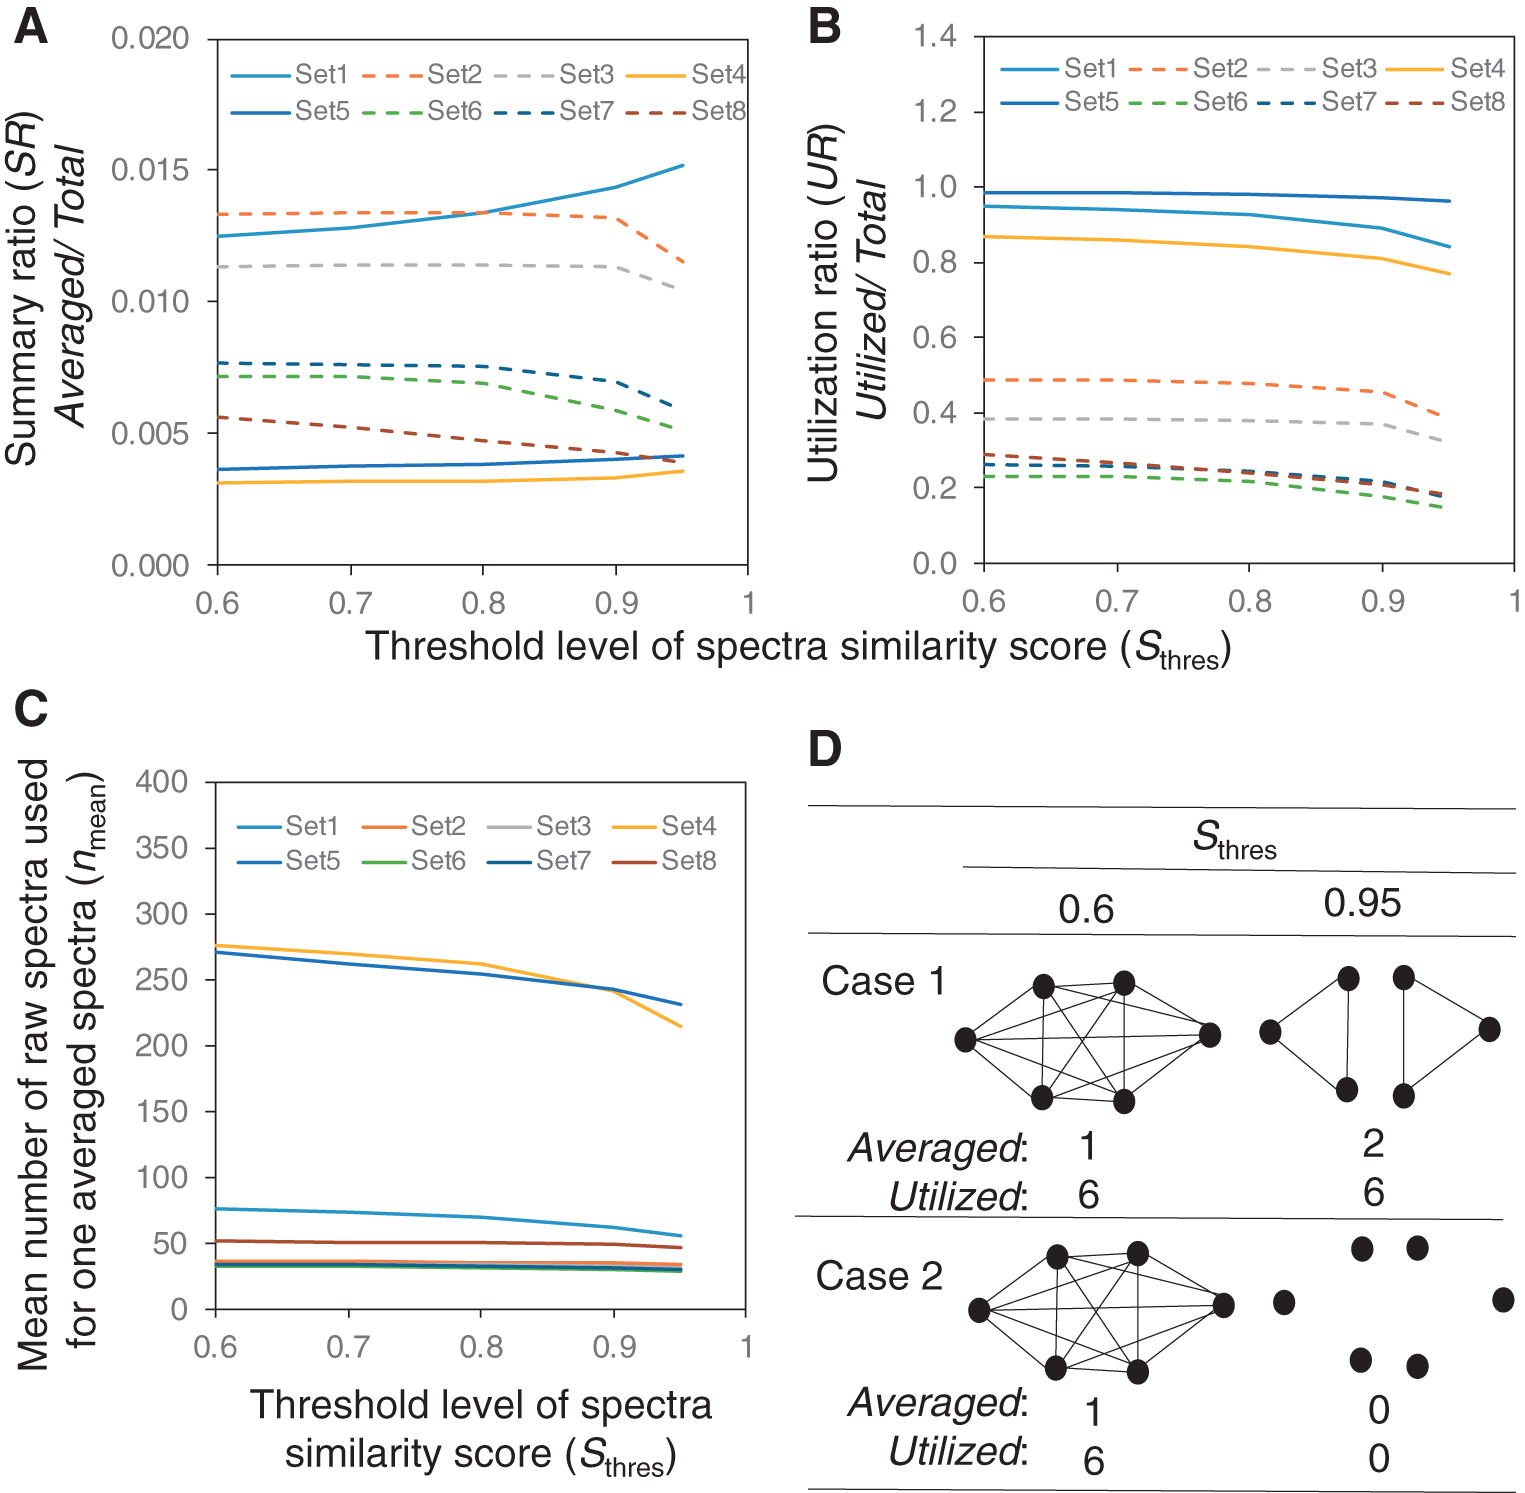
The averaging tasks were performed iteratively for eight datasets using different Sthres levels, including 0.6, 0.7, 0.8, 0.9, and 0.95 (Fig. 1A–1C). For the case of Set 1 acquired by the Q-Orbitrap-MS, the SR levels increased in proportion to Sthres. The SR level at Sthres=0.95 was 0.0152, 22% larger than that of Sthres=0.6 (Fig. 1A). A similar trend was also seen in other Q-Orbitrap-MS datasets, including Set 4 and Set 5. On the other hand, the SR levels decreased as Sthres increased in the datasets acquired by the Q-TOF-MS (Fig. 1A). The UR and nmean levels tended to decline in all datasets (Fig. 1B and 1C).
Figure 1D shows two possible relationships between the Sthres levels and the clustering results. One dot (node) indicates one raw spectrum. Each line (edge) represents a pair of similar raw spectra. One cluster is formed for the Case 1 when Sthres is 0.6. The cluster split into two when Sthres increased to 0.95 because there are six pairs of similar raw spectra with S levels more than 0.95. The number of Averaged elevates from 1 to 2, whereas the number of Utilized is constant at 6. This means that the levels of SR and UR are elevated and kept constant, respectively. On the other hand, the cluster disappears in Case 2 when Sthres increases to 0.95 (Fig. 1D). This is because the S levels of all pairs are less than 0.95. The numbers of Averaged and Utilized decreased to zero, resulting a decline in SR and UR levels.
The relationships suggest that the decrease in the SR, UR, and nmean levels of the Q-TOF-MS datasets could be explained by the Case 2 relationship (Fig. 1A–1C). The Case 2 relationship also contributed to decline the UR and nmean levels in the Q-Orbitrap-MS datasets (Fig. 1B–1C). Additionally, the cluster splitting by Case 1 explained the increase in the SR levels in the Q-Orbitrap-MS datasets (Fig. 1A).
Distinct nature of Q-TOF-MS and Q-Orbitrap-MS datasets
Figure 1D shows that the Case 1 relationship requires many pairs of raw spectra whose spectral similarity scores (S) are above 0.95. On the other hand, the Case 2 relationship occurs when all S are below 0.95. It means the Q-Orbitrap-MS datasets have some characteristics to elevate the S level. For this purpose, the natures of the eight DDA datasets were further compared.
First, the mean numbers of product ion signals in one averaged spectrum were investigated for the averaged spectra using Sthres=0.8. The cosine product method tends to provide larger scores when spectra contain only one product ion signal. The result showed that values of the mean numbers of product ion signals in one averaged spectrum ranged from 5.4 in Set 4 to 41.4 in Set 2 (Table 2). However, there was no relationship between the type of mass analyzers and these values (Table 2).
Next, the frequency of missing values in raw spectra was compared. Missing values are often observed in the product ion spectra.32) Thus, the averaging method used in this study employed product ion signals commonly observed in more than 70% of raw spectra to generate an averaged spectrum (See the Experimental section for a more detailed procedure.). Here, the frequency of missing values was investigated using a stricter condition. The ratio of product ion signals commonly observed in more than 90% of the raw spectra was determined to be 0.73 for the Set 1 dataset (Table 2). The ratio ranged from 0.73 to 0.85 for the Q-Orbitrap-MS datasets, while 0.62–0.72 for the Q-TOF-MS datasets. The results implied that the Q-Orbitrap-MS data tended to have a lower frequency of missing values in raw spectra than the data acquired by the Q-TOF-MS. The different frequency of missing values in raw spectra data could be one reason for the distinct nature between the Q-Orbitrap-MS and Q-TOF-MS datasets.
Effect of no threshold on retention time
During the ionization process, structurally similar compounds often provide an identical ion by the in-source fragmentation. For example, the proton adduct ion of kaempferol (a flavonoid) was commonly generated from kaempferol-3-O-rhamnoside and kaempferol-3-O-glucoside, which eluted at different retention times.33) Moreover, broad chromatogram peaks were often observed for some compounds. Here, a degree of redundancy caused by these compounds was investigated. The spectral averaging was performed at Sthres=0.8 without using the threshold of a retention time gap (or ΔRTthres was set at ∞). For the case of Set 1, the SR level was determined to be 0.0116, which was 87% of the result at ΔRTthres=1.5 min (Table 2). These results suggest that approximately 13% of averaged spectra generated using ΔRTthres=1.5 min were derived from the in-source fragmentation or the broad peak metabolites. A similar reduction was commonly observed for other datasets (Table 2).
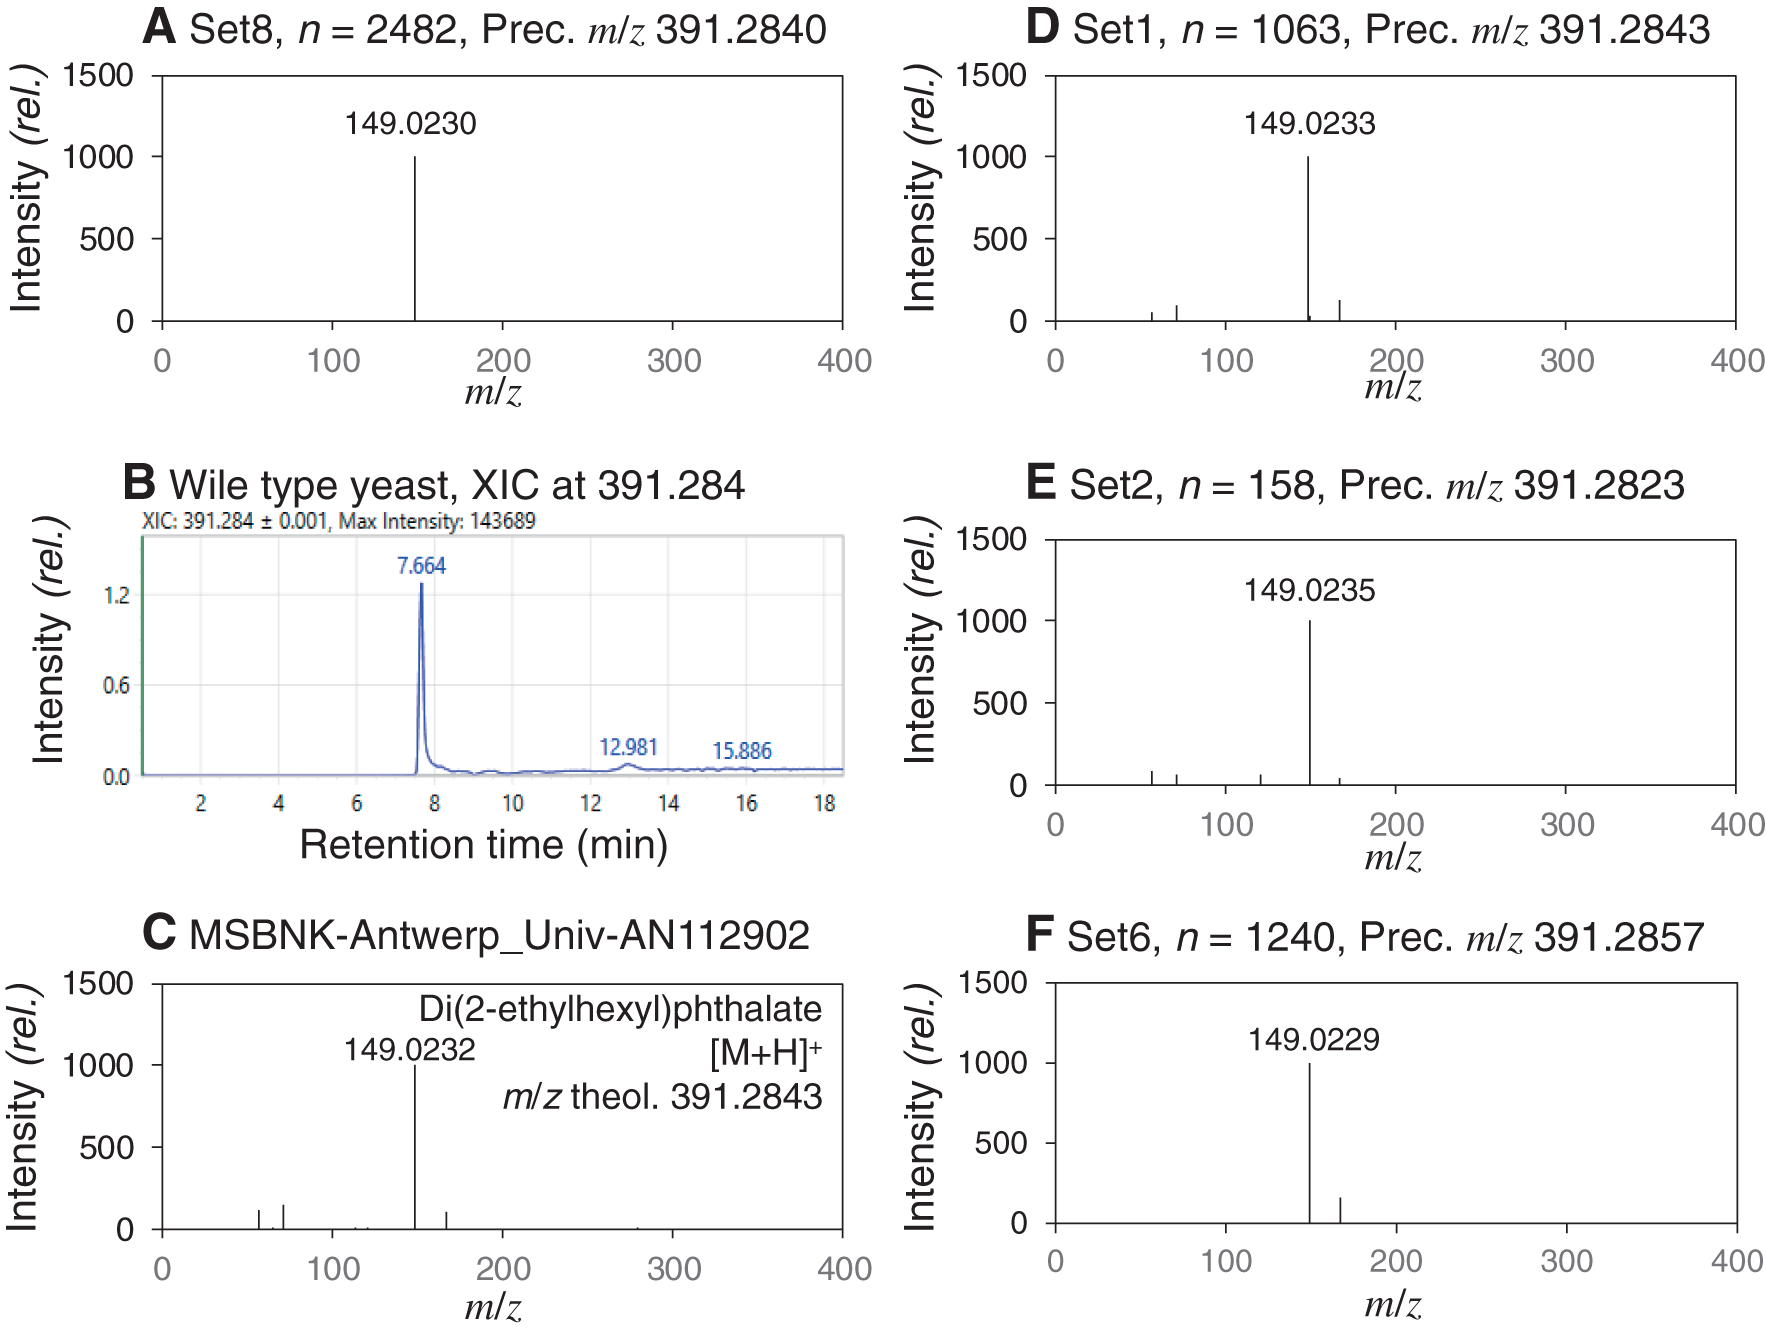
A compound responsible for the redundancy was investigated using structural elucidation of averaged spectra with large n. Among the averaged spectra of Set 8 generated at ΔRTthres=∞, the largest n of the averaged spectra was 2,515. Unfortunately, no chemical structure was elucidated for the averaged spectra (precursor ion: m/z 279.1563. Product ion spectrum: m/z 98.9749: relative intensity (rel int) 999, m/z 149.0230: rel int 151). The number of raw spectra used for the second largest averaged spectrum was 2,482 (Fig. 2A). The extracted ion chromatogram of the precursor ion showed that this compound was eluted as a very broad peak in the DDA data file obtained from the wild-type Saccharomyces cerevisiae strains (BY4749, Fig. 2B).22) The structure of this compound was deduced to be DEHP from the molecular formula estimation using the m/z value of precursor ion as well as the MassBank search using the product ion spectrum (Fig. 2C).34) The compound seemed a ubiquitous contaminant in samples and solvents since DEHP is the most common phthalate in plasticizers. DEHP is also a target compound of human exposome studies.35) The averaged spectra of DEHP were also found from other datasets obtained at the positive ion mode, including Set 1, Set 2, and Set 6 (Figs. 2D–2F). Moreover, Set 8 also included an averaged spectrum deduced to be di-n-butyl phthalate (data not shown). These results indicated that plasticizers and other contaminant chemicals could be a source of redundancy in DDA datasets, although sources of the contamination remain unclear.
DISCUSSION
This study investigated the degrees and origins of redundancy of product ion spectra in DDA data files. The DDA data obtained by Q-TOF-MS and Q-Orbitrap-MS were used because they were available from the metabolome data repository. The nature of DDA data obtained by other types of high-resolution MS was not investigated in this study. The results revealed a significant variation in intrafile redundancy among datasets (Table 2). It also revealed that the DDA datasets obtained by the Q-Orbitrap-MS datasets had larger intrafile redundancy than that of the Q-Orbitrap-MS (Table 2). One reason for this variation was the settings for the DDA mode. It seems that the DDA mode was operated under conditions allowing a certain degree of intrafile redundancy for the Q-Orbitrap-MS datasets, including Set 1, Set 4, and Set 5 (Table 2). It could be achieved by using a shorter time period to exclude former candidate ions for the settings of the DDA mode.
Moreover, this study showed that the frequency of missing values in a product ion spectrum of the Q-Orbitrap-MS datasets was lower than that of the Q-TOF-MS datasets (Table 2) in addition to other known distinct natures.36,37) Due to the high intrafile redundancy and reproducibility of the Q-Orbitrap-MS datasets, most of the acquired data could be used for averaging. This explains the higher UR and nmean levels of the Q-Orbitrap-MS datasets (Table 2). The larger intrafile redundancy is advantageous for spectral averaging since a larger nmean level improves data accuracy through averaging. On the other hand, a too short time period to exclude former candidate ions would cause too much intrafile redundancy, which reduced the acquisition coverage, such as observed for Set 4 and Set 5 (Table 2).
For the case of the Q-TOF-MS datasets, higher frequency of missing values was observed. It suggested that the dwell time for MS2 scan might be too short to obtain reproducible data. Shorter dwell time was employed to increase the number of maximum candidate ions. However, the low UR levels of the Q-TOF-MS datasets (0.218–0.479) indicated that more than 50% of spectra were not reproducible and did not contribute intra- and interfile redundancy (Table 2). The result suggested that frequency of missing values could be reduced by using longer dwell time for MS2 scan.
The analysis of the DDA datasets also showed that the in-source fragmentation of similar compounds and a broad elution of an identical compound were other sources of redundancy. For the case of Set 1, approximately 13% of averaged spectra generated using ΔRTthres=1.5 min were derived from the redundancy (Table 2). The database search deduced that one of the broad eluted compounds was a plasticizer, DEHP. Although the source of the DEHP remains unclear, the identification of contaminants in biological samples is important for quality improvement of DDA datasets to remove the unnecessary redundancy.
A suitable level of Sthres was estimated from the results of this study. The larger Sthres level is preferable for generating an averaged spectrum from a set of closely similar spectra. However, it is also unfavorable because the mean number of raw spectra for averaging nmean is reduced. In the case of the Q-Orbitrap-MS data, a suitable Sthres level is between 0.8 and 0.9 due to a large drop in nmean level when Sthres >0.9. Similarly, the Sthres level at 0.8 was optimal for the Q-TOF-MS data since the nmean, SR, and UR levels decreased at Sthres >0.8.
These results indicated large variations in the origins and degrees of redundancy among datasets. It also demonstrated that an optimal level of the most critical threshold, Sthres, was approximately 0.8–0.9. Based on these findings, it is expected that the quality of product ion spectra data could be improved by the DDA data acquisition using an optimal setting and by the averaging task using appropriate thresholds.