Abstract
A novel ionization technique named medium vacuum chemical ionization (MVCI) mass spectrometry (MS), which is a chemical ionization using oxonium (H3O+) and hydroxide (OH−) formed from water, has excellent compatibility with the supercritical fluid extraction (SFE)/supercritical fluid chromatography (SFC). We have studied a method to determine free fatty acids (FFAs) in a small section of bovine liver tissue using SFE/SFC–MVCI MS analysis without further sample preparation. A series of FFA molecules interact with the C18 stationary phase, exhibiting broad chromatographic peaks when using a non-modified CO2 as the mobile phase. It can be optimized by adding a small content of methanol to the mobile phase as a modifier; however, it may dampen the ionization efficiency of MVCI since the proton affinity of methanol is slightly higher than water. We have carefully evaluated the modifier content on the ion detection and column efficiencies. The obtained result showed that an optimized performance was in the range of 1 to 2% methanol-modified CO2 mobile phase for both column efficiency and peak intensity. Higher methanol content than 2% degrades both peak intensity and column efficiency. Using optimized SFC conditions, a section of bovine liver tissue sliced for 14 µm thickness by 1 mm square, which is roughly estimated as about 3300 hepatocytes, was applied to determine 18 FFAs amounts for carbon chains of C12–C24. An amount of each tested FFA was estimated as in the range of 0.07 to 2.6 fmol per cell.
1. INTRODUCTION
Medium vacuum chemical ionization (MVCI) mass spectrometry (MS) is a chemical ionization at approximately 100Pa of pressure using oxonium (H3O+) and hydroxide (OH−) ions generated from water with corona discharge. The method is similar to the “proton transfer reaction mass spectrometry” (PTR-MS).1) However, PTR-MS uses a pure H3O+ as a reagent ion to simultaneously determine amounts of volatile organic compounds in gaseous samples, which are determined using reaction kinetics.2) In contrast, MVCI uses both H3O+ and OH− as reagent ions to determine amounts of both volatile and non-volatile organic compounds so that it is capable of monitoring both positive and negative ions from a single sample submission if the mass analyzer is capable of it. The MVCI exhibits excellent advantages for monitoring the lipophilic molecules extracted by supercritical fluid extraction (SFE)3) such as 1) extremely high sensitivity, 2) excellent compatibility with the supercritical carbon dioxide (scCO2), and 3) ease of adopting existing mass spectrometers using liquid chromatography as an inlet.
Supercritical fluid chromatography (SFC) was first reported in 1962,4) and it was intensively studied in the 1980s. During that period, SFC was studied on both open-tubular capillary and packed column-based techniques. The packed column SFC allows the use of polar modifiers that expand applicable molecules.5) An advantage of SFC over gas chromatography (GC) and high-performance liquid chromatography (HPLC) is that changing temperature, pressure, and modifier content can control the retention factor and selectivity. Since scCO2, the most common mobile phase on SFC, has approximately 10 times higher diffusion coefficient than liquid with lower viscosity, enabling higher column efficiency than HPLC. Recent progress in commercial SFC apparatus precisely controls necessary instrumental parameters and becomes a significant separation technique for biological samples.6)
We have been studying SFE coupled with SFC with MVCI MS to determine amounts of lipophilic metabolite in a cell or a small piece of tissue.7,8) The accuracy of quantitative analysis using chromatography depends on several factors, such as column efficiency, peak resolution between coeluted molecules, and ionization efficiency. Another critical consideration relates to distinguishing an assigned molecule, discerning whether it originated from a cellular component or arose as a contaminant during the sample processing steps. For instance, some plasticizers can be mistaken for naturally occurring metabolites, such as oleamide.9) Contaminants can be found during sample processing such as centrifuge, extraction, evaporation, solid phase extraction, and so forth, even when using carefully selected laboratory ware and solvents. The high ionization efficiency of MVCI lowers the limit of quantitation, which avoids the sample concentration steps; SFE extracts can be directly applied to an SFC without replacing solvent composition as for HPLC; those features minimize the chance of getting contaminants. A microscale SFE can be applied for solid and liquid samples such as cells, cell debris, and aqueous/non-aqueous liquids, which avoids most of the sample processing steps for cell and tissue sample analysis.
SFC carried out with non-modified CO2 exhibits high column efficiency for a group of molecules such as fat-soluble vitamins and phthalates.7,10) However, a series of free fatty acids (FFAs) exhibits specific interactions with most C18 stationary phases with a non-modified CO2 mobile phase, degrading column efficiency. Low column efficiency may cause poor peak resolution of isomers on a column, which may interfere with the subsequent tandem mass spectrometry process. As described earlier, it is widely used to add a small amount of organic solvent to carrier CO2 as a modifier, which expands the applicable molecules of SFC and also changes retention behaviors.6,11–16) The use of a modifier is positively accepted, especially for SFC interfacing to atmospheric pressure ionization such as electrospray ionization (ESI) and atmospheric pressure chemical ionization (APCI),17) since SFC and atmospheric pressure ionization interface needs to add a sheath solvent to avoid precipitation of solute while depressurizing. Unlike ESI, MVCI needs to use neither organic solvents as proton donors nor sheath solvents because scCO2 solute releases into 100Pa space without phase change as long as the fluid stays higher than the critical temperature of 32°C. On the contrary, organic solvent may suppress ionization of the analyte depending on the proton affinities with respect to reagent ion. Most organic solvents have higher proton affinities than water, which may affect ionization efficiency, particularly on MVCI. Since our first report on SFE-MVCI MS in 2021,3) we have studied the SFC–MVCI interface for positive and negative ion modes without modifiers since their proton/electron affinities. For example, proton affinities for methanol, ethanol, acetonitrile, and isopropanol are 754, 776, 779, and 793kJ·mol−1 respectively, which are higher than water (691kJ·mol−1).18) The enthalpy changes for reactions (∆rH°) in which a negative ion of a molecule combines with a proton to produce the neutral form are listed in Table 1. The ∆rH° value for water is highest among the reactions listed. Values for methanol and acetonitrile show lower ∆rH° than water, which indicates deprotonation may occur for those organic solvents. While there is no data for long-chain FFAs in the database, ∆rH° for C4, C6, and C10 fatty acids show lower than those for methanol and acetonitrile, suggesting that deprotonation is expected to occur in the case of these organic solvents coexists.
Table 1. Enthalpy of reaction at standard conditions (298.15 K, 1 atm), obtained from National Institute of Standard and Technology (NIST) Webbook.
18)
| Molecule |
Reactant |
|
Product |
∆rH° (kJ mol−1) |
| Decanoic acid |
C10H19O2− |
+ |
H+ |
= |
C10H20O2 |
1418 |
| Caproic acid |
C6H11O2− |
+ |
H+ |
= |
C6H12O2 |
1448 |
| Butyric acid |
C4H7O2− |
+ |
H+ |
= |
C4H8O2 |
1451 |
| Acetonitrile |
C2H2N− |
+ |
H+ |
= |
CH3CN |
1592 |
| Methanol |
CH3O− |
+ |
H+ |
= |
CH3OH |
1597 |
| Water |
OH− |
+ |
H+ |
= |
H2O |
1633 |
The use of non-modified scCO2 may result in higher ionization efficiency, though not all analytes can be resolved on a given SFC column without the modifier. For this reason, the effect of the coexistence of organic solvent on the MVCI sensitivity still needs to be addressed. We have studied the effect of methanol content in the scCO2 mobile phase for peak intensity, retention factor (k), and selectivity (α) for FFAs analysis using authentic standards and SFE extract from bovine liver tissue section.
2. EXPERIMENTAL
2.1 Chemicals
Water was obtained from a Milli-Q Purification System (Merck, Darmstadt, Germany). A cylinder of general-grade helium and carbon dioxide (siphon type) (Iwatani Industrial Gases Corp., Osaka, Japan) was used. Acetonitrile, methanol (LC/MS grade), and Vitamin K1 (VK1) were purchased from FUJIFILM Wako Pure Chemicals Corporation (Osaka, Japan). Perfuluorohexyl ethanol was purchased from Tokyo Chemical Industry Co., Ltd. (Tokyo, Japan). Cayman Chemical Item No. 17941 and 17942 (Cayman Chemical, Ann Arbor, MI, USA) were used as saturated and unsaturated free fatty acid standards. The bovine liver was purchased from the local grocery store, diced into approximately 2cm cubes, and stored at −80°C until use.
L-column3 C18 3 µm, 2.1mmID × 100mm length (CERi, Chemicals Evaluation and Research Institute, Saitama, Japan) (L-column3) was used for SFC separation.
2.2 Bovine liver sample preparation
A frozen diced liver sample was sliced into approximately 10mm cubes on the stainless steel plate placed on the dry ice block. A diced liver sample was put into a cryostat microtome CM1100 (Leica Biosystems, Nusslosh, Germany) maintained at −20°C for 30min. A microtome slice of 14µm thickness of the liver sample was immediately put on the aluminum foil and put into a vacuum chamber, which was pumped down by a diaphragm pump (DAP-12S, ULVAC KIKO. Inc., Tokyo, Japan) for 3 min. Bovine liver slices on aluminum foil dried under a vacuum were cut into 1mm squares using a medical scalpel. Each 1-mm square section obtained from the parenchymal tissue region was placed into a stainless steel column inline filter holder (P/N 160072; LC Packings, Thermo, Waltham, MA, USA), which consists of an in-line filter (frit).
To make space for a sample in the SFE vessel, we have placed 0.5mm thickness of 3.3mm inner diameter (ID), and 8mm outer diameter (OD) copper washer on the frit, which provides a 4.3µL of space as the SFE vessel.
According to Ölander et al., the diameter of human hepatocyte cells was 18.4µm in the median, distributed between 12 to 26µm.19) Assuming the cell diameter is approximately 20µm spherical form, which corresponds to approximately 4189µm3. By calculation, the total number of cells in 1mm square for 14µm thickness contains approximately 3300 cells. This value was used to estimate an FFA amount in a cell.
2.2.1 SFE/SFC analysis
The same procedure as reported previously was used.7,10)
A 0.2µL portion of an equal volume mixture of CaymanChem 17941 and 17942 FFA standard sample (5µg·mL−1 for each FFA) and another 0.2µL portion of 10µmol·L−1 acetonitrile solution of VK1 were applied on the stainless steel frit and then placed a copper washer to make an equal volume space to the tissue sample SFE.
A 1-mm square of bovine liver tissue on the aluminum foil was placed inside the center hole of the copper washer, where the sample section should not overlap on the washer surface to prevent a leak of scCO2 pressure. A 0.2µL portion of 10µmol·L−1 VK1 was added to the frit underneath the bovine liver sample section.
The tightly closed filter holder was then plumbed to the Rheodyne 7000 (Rheodyne, CA, USA) 2-way 6 port column switching valve. The SFE/SFC analysis was initiated by switching the valve to pressurize the SFE vessel (in-line filter holder), which extracts from the sample in the SFE vessel that flows to waste via a 1-µL sample loop and back-pressure restrictor. Fifteen seconds later, the injector valve was switched into an inject position that introduced a 1-µL portion of sample fluid flowing in the sample loop on the fly into the SFC column. Using the previously reported method, the optimum timing (15s) of switching the sample injection valve was investigated in advance for standard samples and bovine liver samples.7,10)
The SFC mobile phase was prepared by fixing the CO2 flow rate at 1.0mL·min−1 at −5°C and varying the methanol flow rate from 0 to 50µL·min−1.
Although Lipidmics Standards Initiative Guidelines20) required to use internal standards for quantitative analysis of lipids, the amounts determined in this study were based on the external standard method using ion counts corresponding to a peak on extracted ion chromatogram for monoisotopic ion, and no isotope abundance correction was applied. The two pico moles of VK1 were added for all SFE/SFC analyses as retention time and mass references since it is less sensitive to the ion intensity and retention time according to modifier content.
2.3 Mass spectrometer
A JMS-T100 LP (AccuTOF) time-of-flight (TOF) mass spectrometer (JEOL, Tokyo, Japan) was used with a minor modification, which altered the data acquisition system to an Acqiris Model U5303A (3.2GS·s−1 12-bit digitizer, Geneva, Switzerland). Data acquisition was carried out using open-source software “QtPlatz” (https://github.com/qtplatz/qtplatz) with a modified field programmable gate array (FPGA) configuration for acquiring “peak detection” (PKD) and waveform averaging (AVG) simultaneously.21) The logarithm of the octanol–water partition coefficient (log P) values were calculated using a function embedded in “QtPlatz” on the “rdkit.Chem.Crippen” module.22)
MVCI ion source was built in-house, as previously reported.3,7,10) Mass calibration was performed using sodium trifluoroacetate, an electrospray ionization (ESI) source, and third-order polynomials for m/z between 159 and 1880. The MVCI ion source was then attached by altering the ESI source. The FFAs were monitored as deprotonated molecules ([M−H]−), and VK1 was monitored as a radical anion ([M]−).
2.4 SFE/SFC apparatus
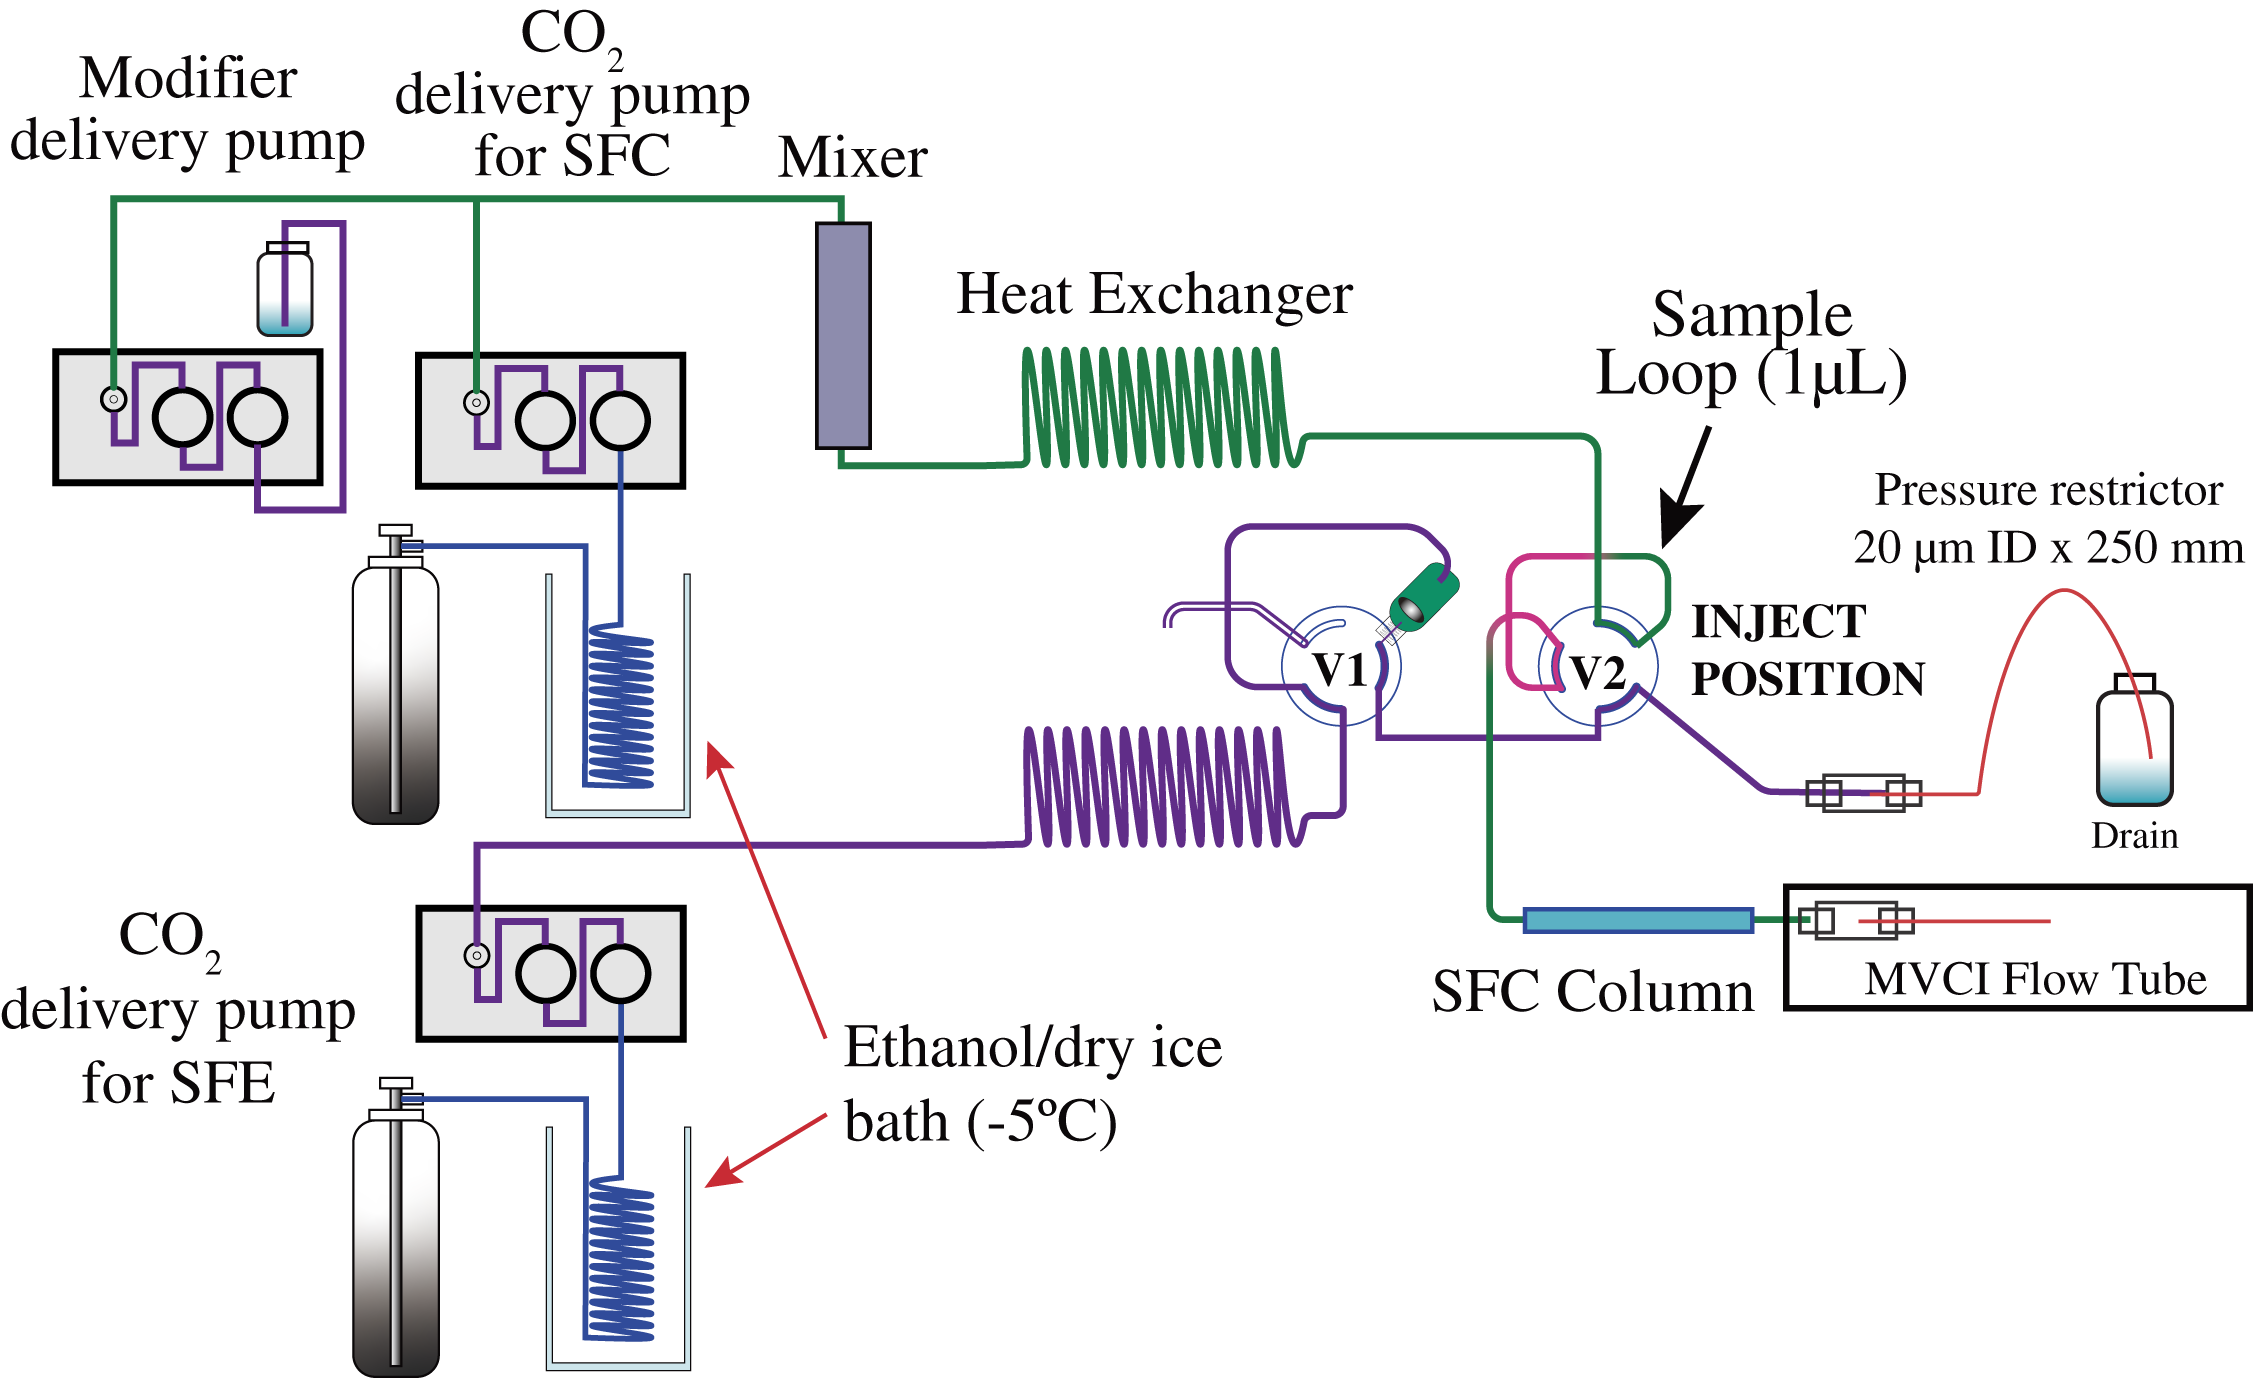
An SFE/SFC apparatus used in this study was built in-house,7) with a newly added modifier delivery pump and the mixer to the system. The SFC mobile phase delivery system consists of a PU-980 (JASCO, Tokyo, Japan) for CO2 delivery and an LC Packings Ultimate (Thermo., Waltham, MA, USA) for modifier delivery was connected by a T-connector as shown in Fig. 1. The T-connector for adding a modifier solvent (methanol) to liquified CO2 was placed at the PU-980 outlet. Then, the modifier contained CO2 was continued to a heat exchanger through an Agilent G1312-87330 (Agilent, Santa Clara, CA, USA) mixer. Besides the SFC mobile phase delivery system, another LC Packings Ultimate was used for the SFE system, which has independent hydraulics from SFC. All the tubings after SFE extraction vessel and SFC injector sample loop to back pressure regulator restrictor placed in the ion source, where they may touch to a sample, 1/16" OD, 50µm ID PEEKsil (SGE International Pty Ltd Corp. Ringwood, Victoria, Australia) was used to avoid sample adsorption and carry over.
The methanol contents in the mobile phase were expressed as the ratio of the flow rate set points rather than the calculated exact molar ratio at the given condition, that is, 1.0mL·min−1 CO2 flow rate with 10µL·min−1 methanol flow rate was expressed as 1% modified.
Acquity InLine column filter (Waters, Milford, MA, USA) was also used as an SFE vessel instead of an LC Packings in-line filter holder to compare sensitivity with previous work.7)
3. RESULTS AND DISCUSSION
3.1 SFC chromatogram of free fatty acids using non-modified CO2 mobile phase
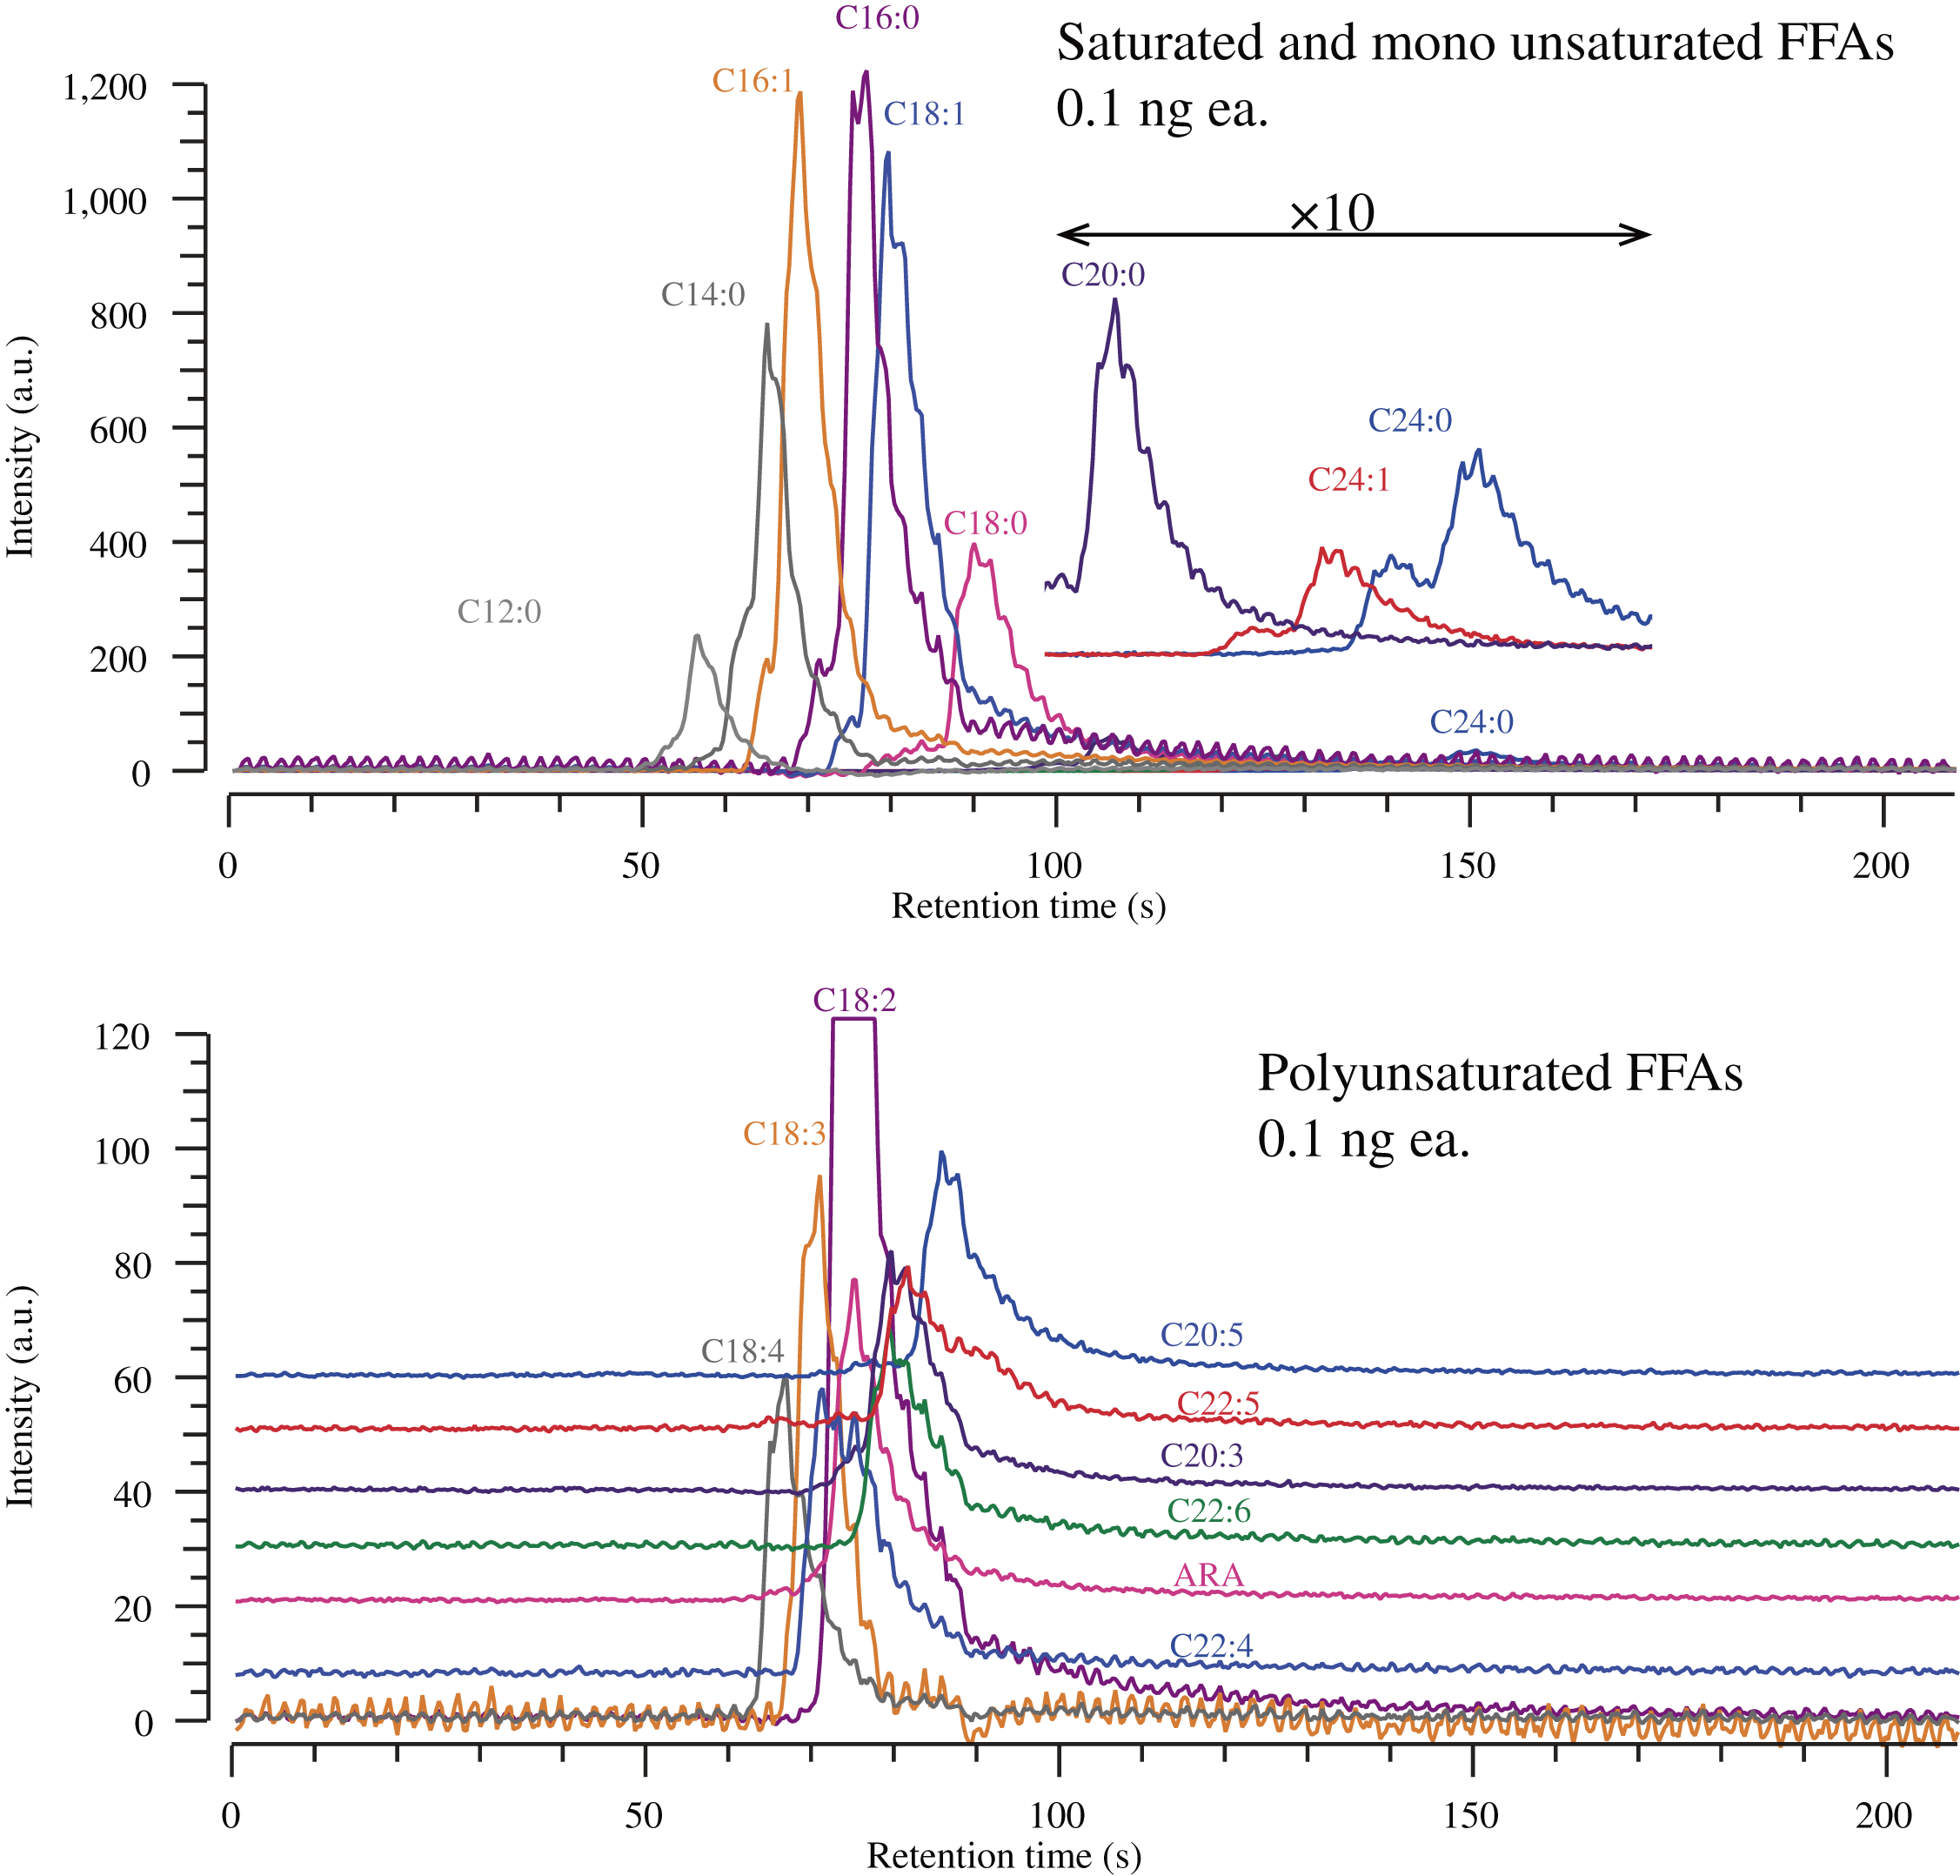
Figure 2 shows extracted ion chromatograms for saturated and unsaturated FFA standards. It was acquired before attaching a modifier pump so that the system stays away from organic solvents such as methanol and acetonitrile for years. Although one of the advantages of SFC over HPLC is high column efficiency, the obtained theoretical plate numbers (N) were 838 ± 134 and 1188 ± 246 for arachidonic acid (ARA) and arachidic acid (C20:0) peaks, respectively, where retention factors (k) for those peaks were 1.81 and 2.96. The peak width for perfluorohexyl ethanol, which was added as a hold-up time reference, was 1.87s (N = 1201 at k = 0), while the peak width for lauric acid (C12:0) (k = 1.12) was 4.1s (N = 1102). These results suggest that FFAs may have specific interactions with the stationary phase under the non-modified CO2 mobile phase condition.
3.2 Effect of methanol modifier content on SFC chromatogram of FFAs
Figure 3 shows an overlay of extracted ion chromatograms of ARA and VK1 acquired various modifier contents from 0% to 5% on L-column3, where VK1 was added as both retention and mass references. A chromatogram for ARA at 0% modifier is way broad, and retention time was prolonged compared to the chromatogram shown in Fig. 2. It may be affected by trace-level methanol even though the system was equilibrated for about an hour after turning off the modifier delivery pump. The relationship between the logarithm of retention factor (k) and log P, and the effect of methanol content on log k and selectivity (α) were summarized in Supplemental Information.
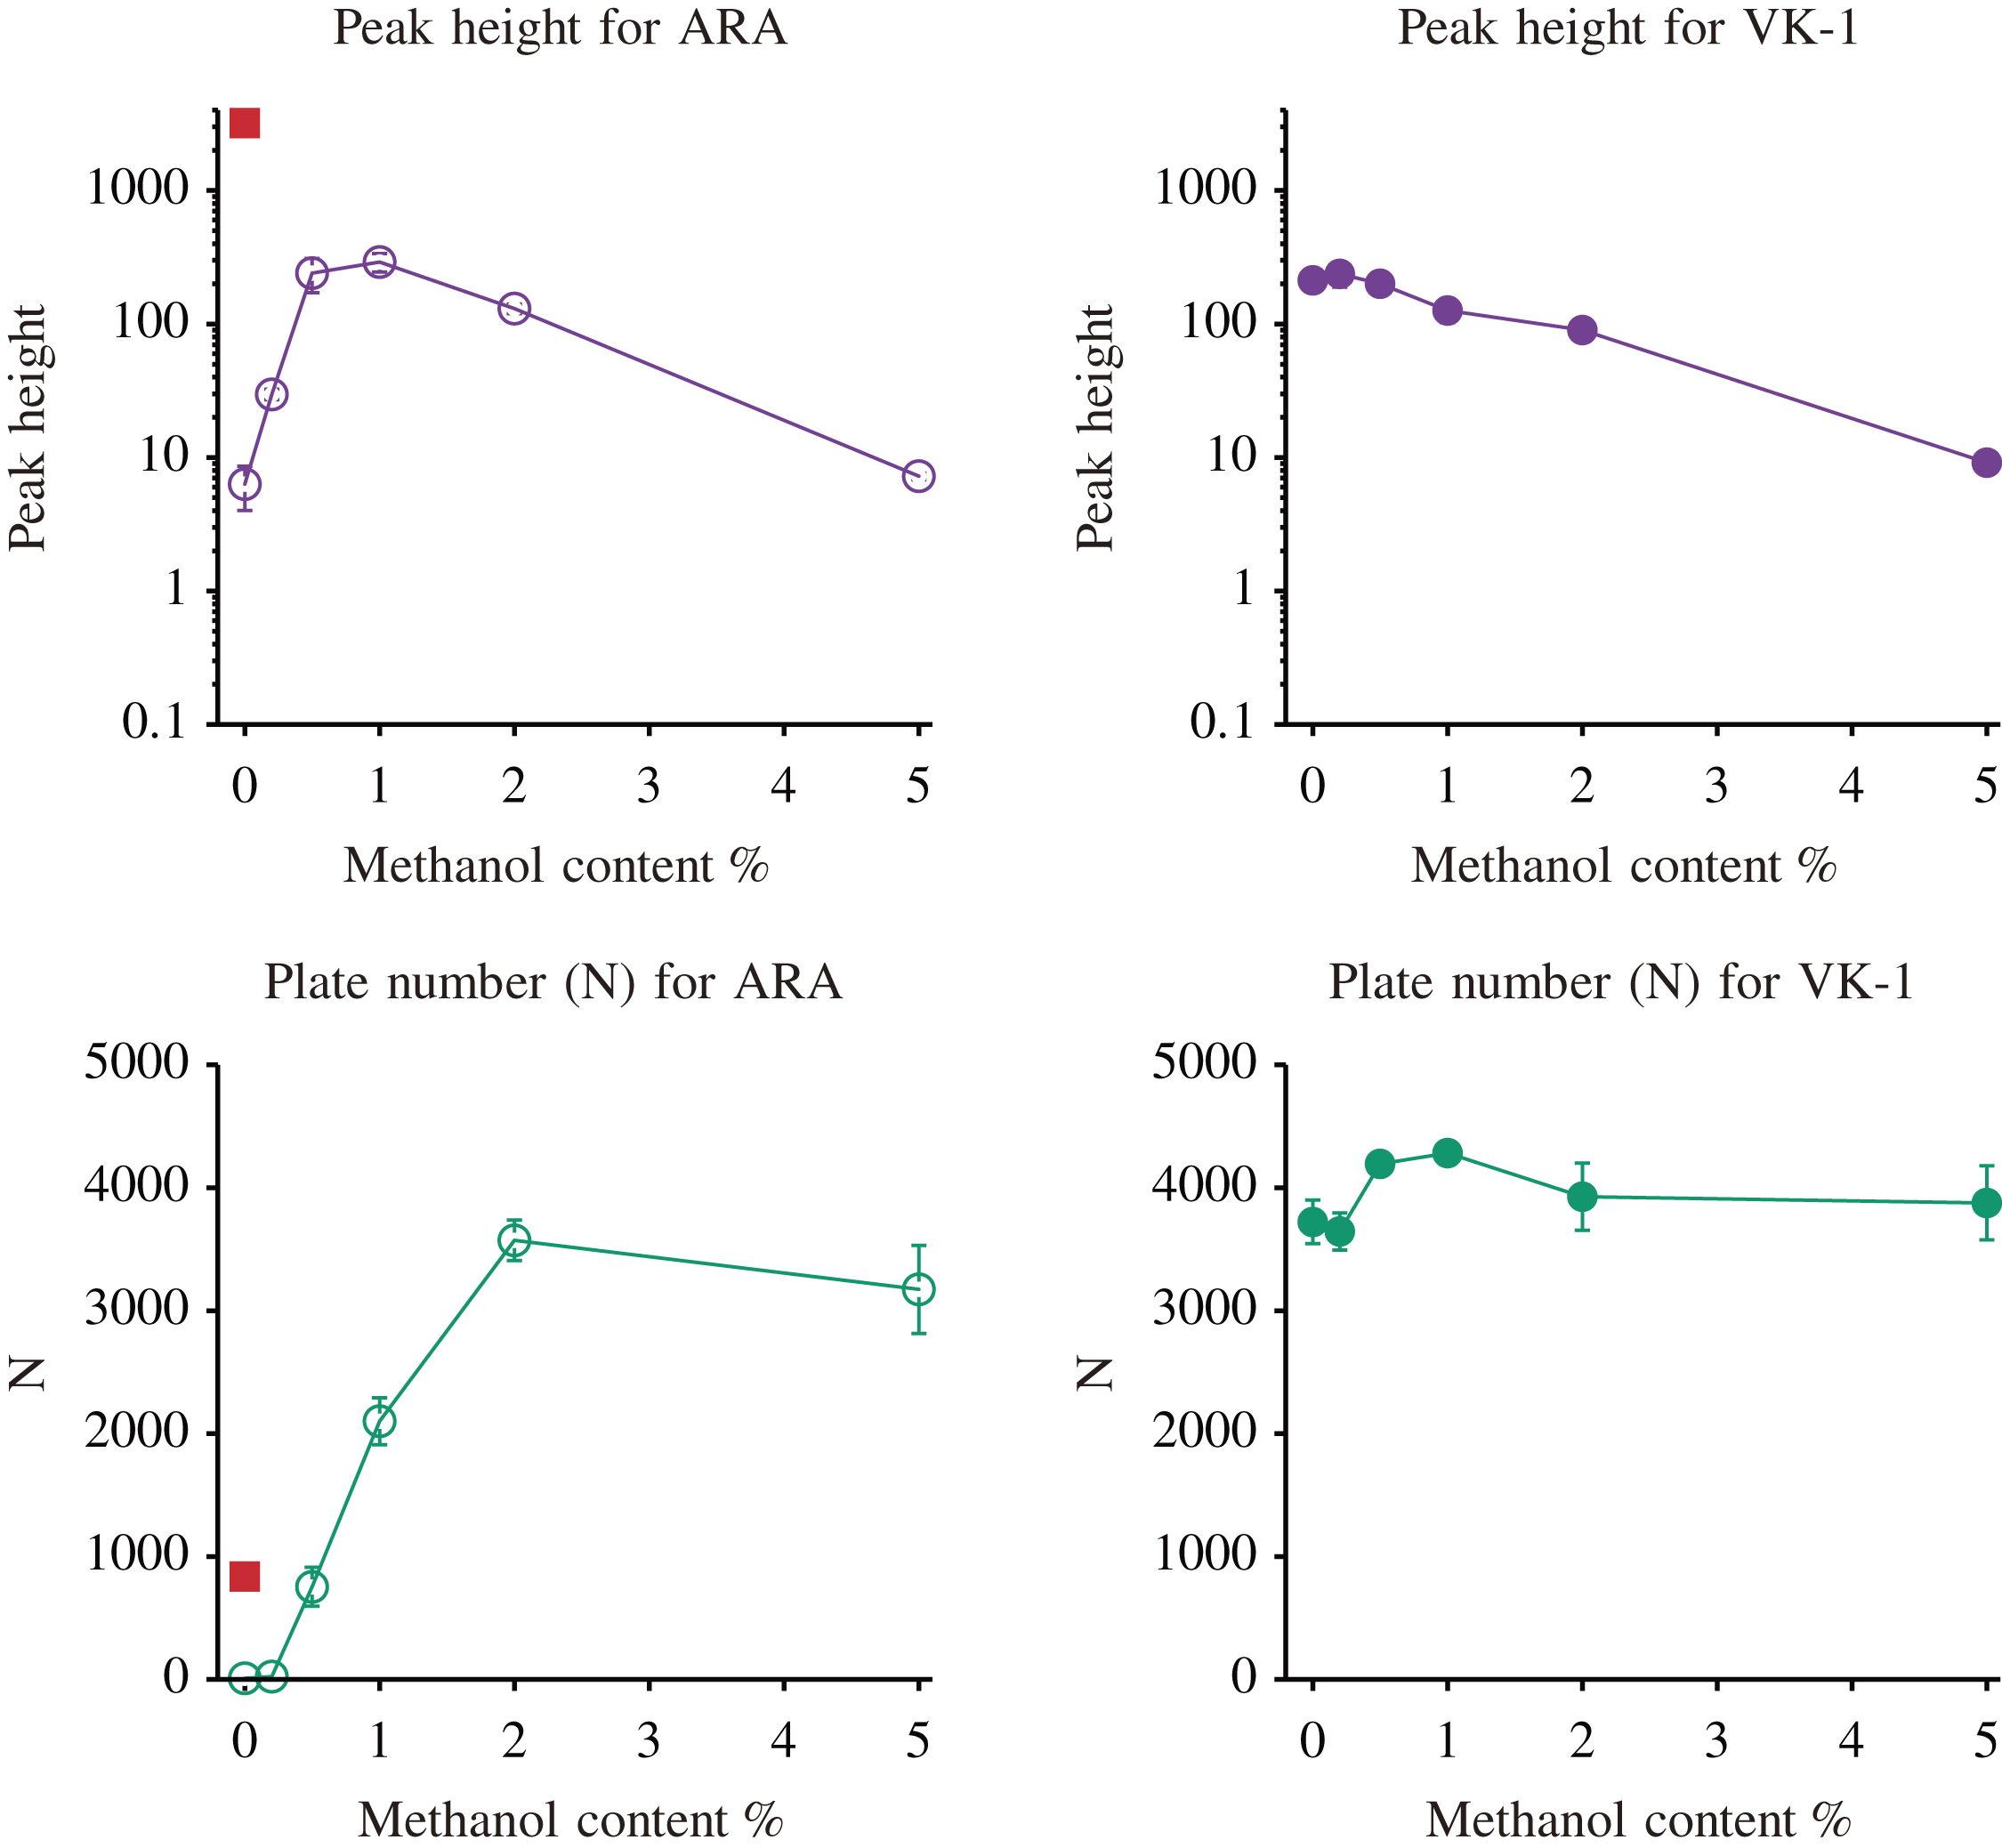
The ion counts (peak area) within the peak half-height width are shown in Fig. 4. It exhibits that ion counts were systematically decreased according to increasing modifier content and obtained the following regression results:
where x is percent methanol; Equations (1) and (2) represent for ARA and VK1 ion counts, respectively.
Ion counts for ARA and VK1 exponentially decreased due to increasing modifier content, though the non-modified CO2 mobile phase chromatogram exhibits a broad peak. It brings difficulty for peak detection by an algorithm for biological tissue samples, which may contain unresolved chromatographic peaks from the sample matrix. In contrast, the 1% methanol-modified CO2 mobile phase exhibits the most intense chromatographic peak in height through a higher theoretical plate (N). Increasing modifier content up to two percent for chromatography of FFA increases the theoretical plate, resulting in a higher peak height that compensates for the overall detection capability, including peak resolution as well as ease of peak detection by an algorithm. The five percent modifier slightly loses a theoretical plate, as shown in Fig. 5, which might result from increased apparent viscosity and decreased diffusion coefficient by added methanol. This result suggests that a methanol modifier effectively improves column efficiency in the range of 1% to 2%, but too much modifier content will lose sensitivity and column efficiency. The linear response range for ARA under the SFC condition of one percent modified methanol was obtained in the range of 6.6 to 6600fmol, as shown in Supporting Information Figure S6. The lower limits of quantification (LLOQ) obtained for ARA were determined to be 7fmol. The obtained LLOQ in the present method was still three orders lower than the method using LC/MS/MS reported by Gachet et al. 23)
A primary reason for the loss of ion counts on MVCI is due to methanol and analytes competition for proton donor/acceptor in the MVCI space. In this case, sensitivity may depend on the flow rate of methanol independently from the CO2 flow rate since CO2 is entirely inert due to lower proton/electron affinity. Assuming this hypothesis is correct, then the use of a narrow column may have less loss of sensitivity at higher modifier content when it becomes necessary.
3.3 FFA analysis of SFE extract from a bovine liver slice
As described in Section 2.2, a piece of bovine liver tissue (14 µm thickness by 1mm square) was analyzed using SFE and online coupled SFC.
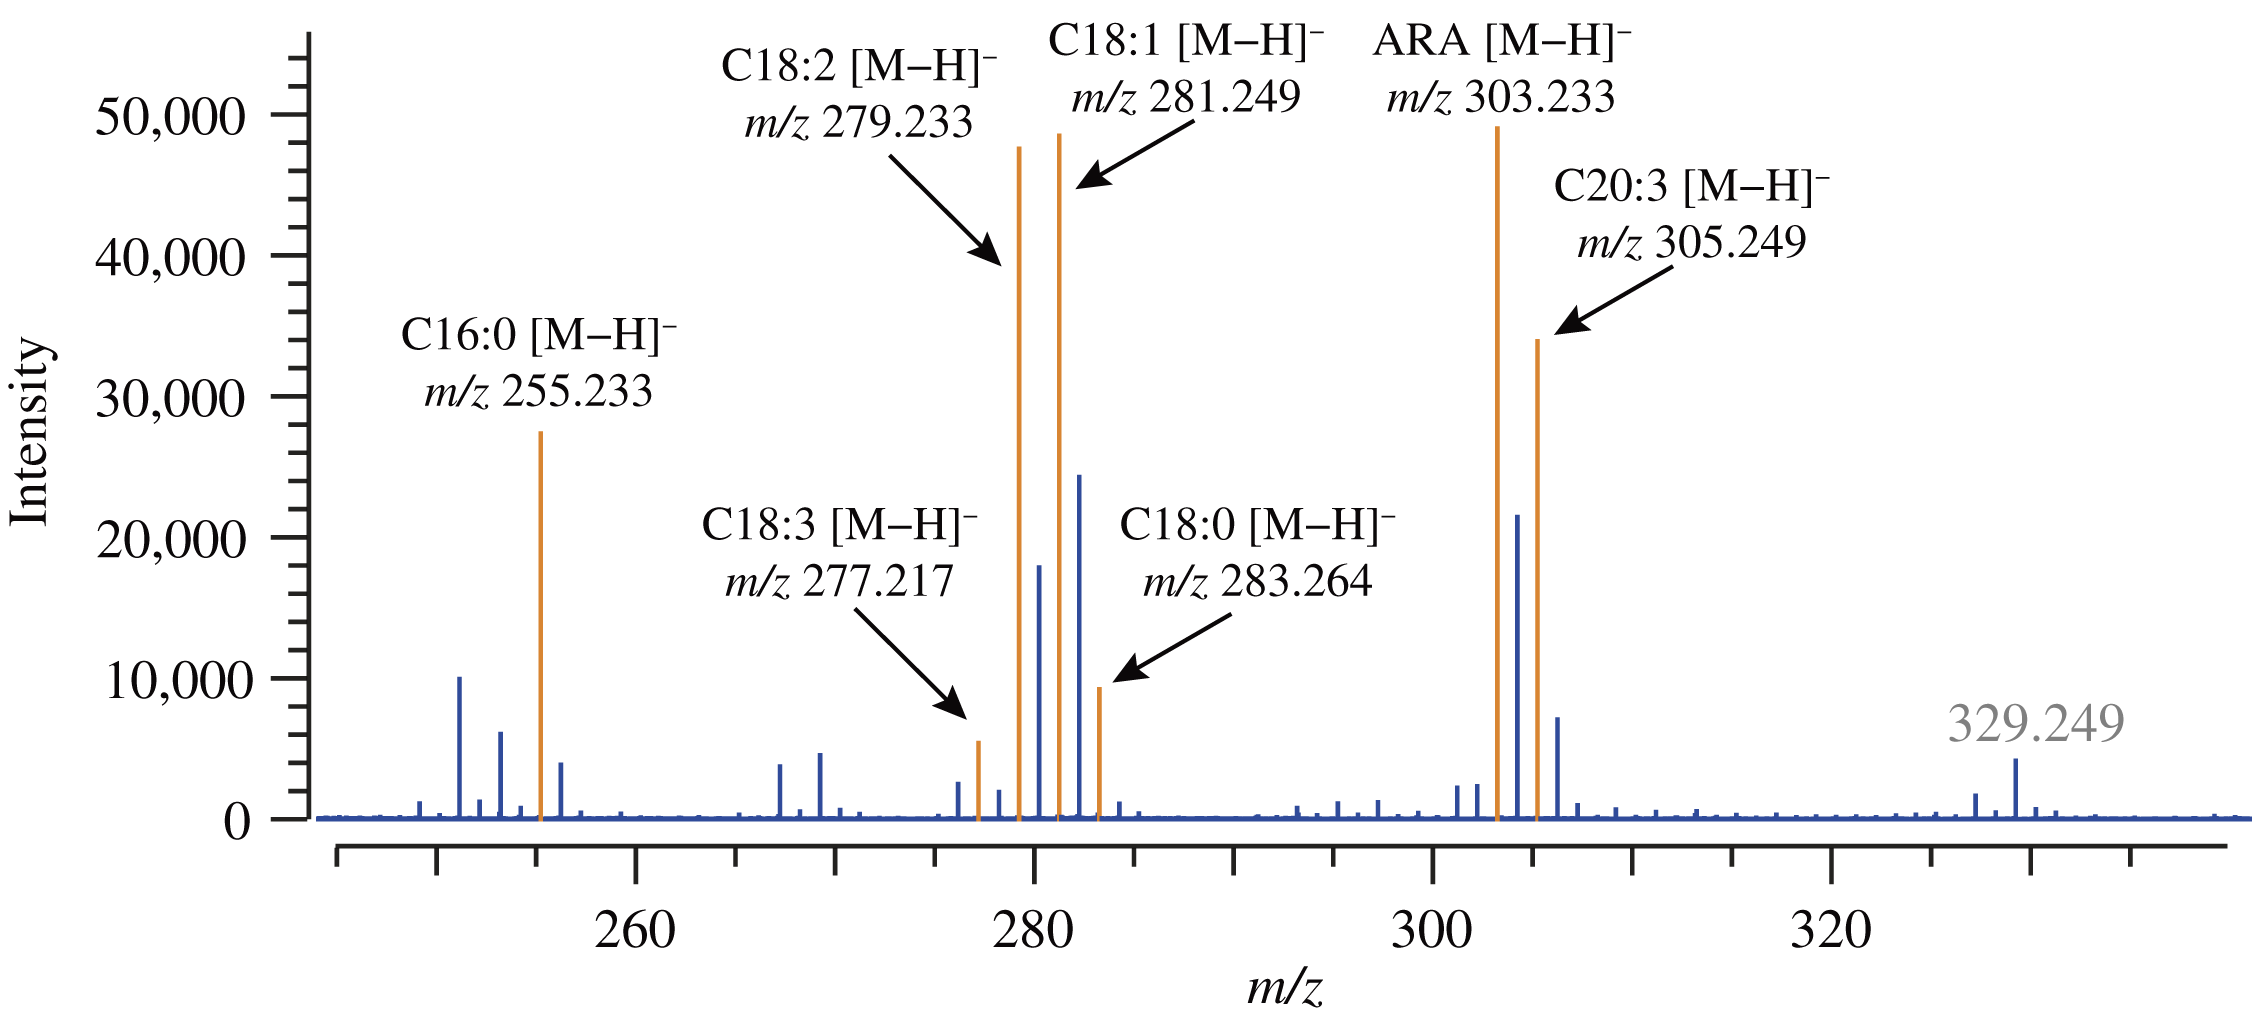
An overlay of extracted ion chromatograms for FFA molecules obtained from the bovine tissue sample analysis was shown in Fig. 6. The co-added mass spectrum obtained from the ARA peak region was shown in Fig. 7. The VK1 peak on the SFC chromatogram was detected in advance and took a co-added mass spectrum for the half-height width region of VK1 SFC peak. The obtained mass spectral peak for VK1 [M]− ion (m/z 450.350) was used to compute a mass drift compensation factor (also known as lock mass). The obtained mass drift compensation factor was applied to further process the given data set for obtaining extracted ion chromatograms and mass spectra. The retention time of VK1 was also used as a reference for relative retention time, which was well agreed to the relative retention times of standard sample analysis. A summary of variance found in each data acquisition relevant to bovine liver tissue FFA analysis was shown in Supplementary Information Figure S4.
The estimated amounts are summarized in Table 2. The amount of each FFA per single hepatocyte was computed from the calculated amount per tissue section analysis divided by 3300. The relative standard deviation (RSD) for peak area was between 12% to 62% except for C18:4, whose peak intensity was extremely low. The obtained result indicates that most of the FFAs tested in this study show 0.07 to 2.6fmol of amounts per hepatocyte. Note that the estimated ARA amount in a single cell was 2.6fmol, which is high enough compared to the previously reported lower limit of quantitation using the method without a modifier,7) but 3-fold insufficient with the modifier. The estimated duty, that is, how many percentages of samples on the frit can be introduced into SFC, is roughly less than three percent, which was calculated from the SFE elution profile, sample loop size, and flow rate. A suspected reason for the relatively larger RSD was due to a more considerable variance of pressure recovery time after the start of SFE. The volume of the SFE vessel used in this study is about 4µL larger than that used in our previous work, which causes a pressure down to approximately 27MPa from the steady state of 30MPa when starting the SFE by switching to the V1 position. Theoretically, 4µL volume should be compensated within two seconds, though it takes three to five seconds for pressure to ramp back to 30MPa. Injection timing from the SFE start was set to 15seconds, though a variance of extraction efficiency and pressure for the sample loop may have caused unexpected variance for the sample injection. The use of a smaller space of SFE vessel or applying static SFE may improve this issue and the insufficient sample duty.
Table 2. Summary of FFA amounts in bovine hepatocytes.
| FFA |
tR |
peak area |
ng |
Estimated amounts |
| pmol |
fmol per cell |
| FA C12:0 |
41.91 ± 0.31 |
157.5 ± 36.1 |
0.433 |
2.16 |
0.66 |
| FA C14:0 |
44.77 ± 0.34 |
509.0 ± 85.7 |
0.657 |
2.88 |
0.87 |
| FA C18:4 |
46.33 ± 0.43 |
25.0 ± 27.6 |
0.064 |
0.23 |
0.07 |
| FA C16:1 |
46.54 ± 0.40 |
1111.1 ± 136.2 |
0.612 |
2.41 |
0.73 |
| FA C18:3 |
47.31 ± 0.49 |
161.9 ± 70.4 |
0.252 |
0.91 |
0.27 |
| FA C20:5 |
48.28 ± 0.50 |
94.3 ± 48.2 |
0.177 |
0.59 |
0.18 |
| FA C16:0 |
48.29 ± 0.53 |
759.0 ± 236.0 |
0.521 |
2.03 |
0.62 |
| FA C18:2 |
48.59 ± 0.56 |
1819.4 ± 474.0 |
1.932 |
6.90 |
2.09 |
| FA C20:4 |
49.65 ± 0.52 |
1697.3 ± 736.4 |
2.655 |
8.73 |
2.64 |
| FA C18:1 |
51.17 ± 0.35 |
3196.3 ± 495.6 |
1.182 |
4.19 |
1.27 |
| FA C22:6 |
51.56 ± 0.47 |
104.5 ± 64.8 |
0.235 |
0.72 |
0.22 |
| FA C20:3 |
51.60 ± 0.35 |
1002.4 ± 424.9 |
2.499 |
8.16 |
2.47 |
| FA C22:5 |
52.63 ± 0.38 |
267.6 ± 111.9 |
0.608 |
1.84 |
0.56 |
| FA C22:4 |
54.27 ± 0.34 |
375.2 ± 164.7 |
0.726 |
2.18 |
0.66 |
| FA C18:0 |
54.50 ± 0.46 |
2355.1 ± 643.8 |
1.507 |
5.30 |
1.61 |
| FA C20:0 |
58.99 ± 0.61 |
139.0 ± 39.0 |
0.235 |
0.75 |
0.23 |
| FA C24:1 |
67.91 ± 0.68 |
70.9 ± 26.3 |
0.146 |
0.40 |
0.12 |
| FA C24:0 |
72.09 ± 0.94 |
209.7 ± 58.2 |
0.200 |
0.54 |
0.16 |
| Vitamin K1 |
77.9 ± 1.1 |
494.3 ± 116.6 |
Recovery |
80.7% |
– |
| RSD (average) |
0.96% |
13.1% |
|
|
|
The amounts of each FFA were estimated with an assumption of 3300 cells per sample using four SFE/SFC analysis replicates. The same SFC condition with Fig. 6 was used.
FFA, free fatty acid; RSD, relative standard deviation.
The repeatability of relative retention time for each FFA was in the range of 0.7% to 1.3% RSD by using VK1 as the reference peak.
3.4 General discussion
The method present in this study also applies to the precise determination of molecule localization on the tissue slice at least one millimeter square of spatial resolution. The spatial resolution could improve if we found a method to cut a sample slice into smaller sections. The one-millimeter spatial resolution may not be so attractive compared to widely studied MS imaging systems; however, a one-millimeter resolution is still worth studying to relate significant biological phenomena such as cell differentiation, polymorphism, signaling, and so forth. Knowing the amount of intermediate metabolite in the small region is crucial to understanding pathway regulation mechanisms utilizing enzyme kinetic study knowledge. Moreover, this method can be adopted to resolve peaks of isomers, including stereoisomers, by choosing columns appropriately.24,25) A significant advantage of the present method is that it opens the way in determining the amounts of molecules as well as precise molecule identification by chromatographic separation combined with tandem mass spectrometry. Furthermore, an excellent advantage of direct tissue section analysis is minimizing sample processing steps before applying a sample to an analytical instrument. The sample can avoid contact with most plastics and laboratory wares to obtain full SFC MS results.
4. CONCLUSION
A 1-mm square for 14µm thickness of bovine liver tissue has been applied to online SFE/SFC MVCI MS analysis without further sample preparation except slicing on the cryostat microtome and sectioning slice into 1-mm square. The repeatability of the relative standard deviation (RSD) for relative retention time was 0.96% on average for 18 FFAs, and the RSD for peak area was 13.1%.
A series of FFA molecules interact with the C18 stationary phase, which exhibits broad chromatographic peaks when using a non-modified CO2 as the mobile phase, particularly on long-chain FFAs. Such peak broadening was greatly improved by adding 1% to 2% of methanol into mobile phase CO2 as a modifier; for example, ARA peak increases 2.5-fold of theoretical plate number and 7.7-fold of peak height by the use of 1% methanol-modified CO2. Adding a 2% methanol modifier shows further improvement in column efficiency, but peak height was slightly dumped, though the result varies depending on each molecule. Note that the presence of a residual level of methanol content drastically degrades the column efficiency. This phenomenon shows us that the modifier solvent line should be physically removed from the system to achieve truly non-modified conditions.
Using optimized SFC conditions, a section of bovine liver tissue was sliced for 14µm thickness by 1-mm square, which is roughly estimated as about 3300 hepatocytes, was applied to determine 18 FFAs amounts for carbon chains of C12 to C24. An amount of each tested FFA was estimated as in the range of 0.07 to 2.6fmol per cell.
ACKNOWLEDGEMENTS
This work was supported by the Program on Open Innovation Platform with Enterprises, Research Institute and Academia, Japan Science and Technology Agency (JST, OPERA, JP-MJOP1861), and JSPS KAKENHI Grant number JP23H01985.
DATA AVAILABILITY STATEMENT
The spectrum data file of Fig. 7 is available in J-STAGE Data.
Notes
Mass Spectrom (Tokyo) 2024; 13(1): A0141
REFERENCES
- 1) W. Lindinger, A. Jordan. Proton-transfer-reaction mass spectrometry (PTR-MS): On-line monitoring of volatile organic compounds at pptv levels. Chem. Soc. Rev. 27: 347–375, 1998.
- 2) K. Sekimoto, A. R. Koss. Modern mass spectrometry in atmospheric sciences: Measurement of volatile organic compounds in the troposphere using proton-transfer-reaction mass spectrometry. J. Mass Spectrom. 56: e4619, 2021.
- 3) T. Hondo, C. Ota, Y. Miyake, H. Furutani, M. Toyoda. Analysis of nonvolatile molecules in supercritical carbon dioxide using proton-transfer-reaction ionization time-of-flight mass spectrometry. Anal. Chem. 93: 6589–6593, 2021.
- 4) Communications TO THE EDITOR. J. Org. Chem. 27: 700–706, 1962.
- 5) L. T. Taylor. Supercritical fluid chromatography for the 21st century. J. Supercrit. Fluids 47: 566–573, 2009.
- 6) K. Yamamoto, K. Machida, A. Kotani, H. Hakamata. Emerging separation techniques in supercritical fluid chromatography. Chem. Pharm. Bull. 69: 970–975, 2021.
- 7) T. Hondo, C. Ota, Y. Miyake, H. Furutani, M. Toyoda. Microscale supercritical fluid extraction combined with supercritical fluid chromatography and proton-transfer-reaction ionization time-of-flight mass spectrometry for a magnitude lower limit of quantitation of lipophilic compounds. J. Chromatogr. A 1682: 463495, 2022.
- 8) T. Hondo, C. Ota, K. Nakatani, Y. Miyake, H. Furutani, T. Bamba, M. Toyoda. Attempts to detect lipid metabolites from a single cell using proton-transfer-reaction mass spectrometry coupled with micro-scale supercritical fluid extraction: A preliminary study. Mass Spectrom. (Tokyo) 11: A0112, 2022.
- 9) U. Jug, K. Naumoska, V. Metličar, A. Schink, D. Makuc, I. Vovk, J. Plavec, K. Lucas. Interference of oleamide with analytical and bioassay results. Sci. Rep. 10: 2163, 2020.
- 10) C. Ota, T. Hondo, Y. Miyake, H. Furutani, M. Toyoda. Rapid analysis of α-tocopherol and its oxidation products using supercritical carbon dioxide and proton transfer reaction ionization mass spectrometry. Mass Spectrom. (Tokyo) 11: A0108, 2022.
- 11) R. W. Stringham, J. A. Blackwell. “Entropically driven” chiral separations in supercritical fluid chromatography. Confirmation of isoelution temperature and reversal of elution order. Anal. Chem. 68: 2179–2185, 1996.
- 12) M. Saito. History of supercritical fluid chromatography: Instrumental development. J. Biosci. Bioeng. 115: 590–599, 2013.
- 13) N. Gibitz Eisath, S. Sturm, H. Stuppner. Supercritical fluid chromatography in natural product analysis — An update. Planta Med. 84: 361–371, 2018.
- 14) I. Brondz, B. Sedunov, N. Sivaraman. Influence of modifiers on supercritical fluid chromatography (SFC) and supercritical fluid extraction (SFE), part I. Int. J. Anal. Mass Spectrom. Chromatogr. 5: 17–39, 2017.
- 15) M. Antonelli, M. Holčapek, D. Wolrab. Ultrahigh-performance supercritical fluid chromatography-mass spectrometry for the qualitative analysis of metabolites covering a large polarity range. J. Chromatogr. A 1665: 462832, 2022.
- 16) T. Fornstedt, M. Enmark, J. Samuelsson. Method transfer in SFC from a fundamental perspective. Trends Analyt. Chem. 149: 116551, 2022.
- 17) M. K. Parr, B. Wüst, J. Teubel, J. F. Joseph. Splitless hyphenation of SFC with MS by APCI, APPI, and ESI exemplified by steroids as model compounds. J. Chromatogr. B Analyt. Technol. Biomed. Life Sci. 1091: 67–78, 2018.
- 18) E. Lemmon, I. H. Bell, M. L. Huber, M. O. McLinden. NIST Chemistry WebBook, SRD 69, National Institute of Standards and Technology, 2022.
- 19) M. Ölander, C. Wegler, I. Flörkemeier, A. Treyer, N. Handin, J. M. Pedersen, A. Vildhede, A. Mateus, E. L. LeCluyse, J. Urdzik, P. Artursson. Hepatocyte size fractionation allows dissection of human liver zonation. J. Cell. Physiol. 236: 5885–5894, 2021.
- 20) Lipid Species Quantification – lipidomicstandards.org. https://lipidomicstandards.org/lipid-species-quantification/.
- 21) Y. Kawai, Y. Miyake, T. Hondo, J.-L. Lehmann, K. Terada, M. Toyoda. New method for improving LC/time-of-flight mass spectrometry detection limits using simultaneous ion counting and waveform averaging. Anal. Chem. 92: 6579–6586, 2020.
- 22) S. A. Wildman, G. M. Crippen. Prediction of physicochemical parameters by atomic contributions. J. Chem. Inf. Comput. Sci. 39: 868–873, 1999.
- 23) M. S. Gachet, P. Rhyn, O. G. Bosch, B. B. Quednow, J. Gertsch. A quantitiative LC-MS/MS method for the measurement of arachidonic acid, prostanoids, endocannabinoids, N-acylethanolamines and steroids in human plasma. J. Chromatogr. B Analyt. Technol. Biomed. Life Sci. 976–977: 6–18, 2015.
- 24) K. Kalíková, T. Slechtová, J. Vozka, E. Tesařová. Supercritical fluid chromatography as a tool for enantioselective separation; A review. Anal. Chim. Acta 821: 1–33, 2014.
- 25) K. De Klerck, Y. Vander Heyden, D. Mangelings. Generic chiral method development in supercritical fluid chromatography and ultra-performance supercritical fluid chromatography. J. Chromatogr. A 1363: 311–322, 2014.