INTRODUCTION
In medicine and biology, mass spectrometry (MS) is a valuable tool that enables label-free analysis and the ability to measure multiple molecules simultaneously. This technology has proven important in capturing a range of phenomena, such as pharmacokinetics in biological tissues. In pharmaceutical research and development, it is necessary to accurately understand specific phenomena in biological tissues1,2) and molecular imaging of small areas using MS enables these analyses.
Mass spectrometry imaging (MSI),3–6) a technique widely utilized for imaging tissue sections of various organs, including small areas such as single cells, stands at the forefront of this research. A primary method employed, matrix-assisted laser desorption/ionization (MALDI)7–13) is mainly performed under vacuum and requires dehydration of the sample, resulting in a low ion signal for volatile components. In addition, the ionization of the matrix competes with the ionization of sample molecules, and the peaks of the matrix ions make the analysis difficult for an overlapping m/z range. In the conventional MALDI-MSI, an acceleration voltage needs to be applied to the sample, and this necessitates thin sample sectioning for electrical conductivity.14) Despite advancements that alleviate some of these requirements, MALDI requires coating of the sample with a matrix and conductive materials such as gold, and many additional sample treatments are necessary, depending on the purpose of the analysis.
By contrast, desorption electrospray ionization (DESI)7,13,15–17) is an ambient, matrix-free ionization technique that allows imaging of tissue sections with minimal sample preparation. Its simplicity, affordability, and ability to perform high-throughput analysis have made it the most popular ambient MSI technique. However, DESI’s application in detailed imaging is limited by thinning, curing, and planarization of the sample, and solubility of the samples.13,16–19)
Electrospray-assisted laser desorption/ionization (ELDI)20–23) and laser ablation electrospray ionization (LAESI),13,24–28) which combines laser ablation and/or laser desorption ionization (LDI) with electrospray ionization (ESI), provides an alternative for matrix-free MSI. As the laser-ablated or desorbed samples are post-ionized by ESI, sample treatments such as dehydration, matrix addition, and conductive coating are not required. Therefore, it is possible to analyze molecules with a mass close to that of the matrix and to analyze molecules with low solubility to solvents used for ESI. However, with conventional ELDI or LAESI-MSI, the sample distance was limited because the spray was positioned directly above the sample. This prevented the efficient focusing of the laser.
In this study, we have developed an ion source that does not require sample preparation such as thinning, curing, planarization, or addition of matrix by the ELDI with gas transportation (GT) at atmospheric pressure and conducted MSI. In this ion source, laser ablation of the sample and ESI were separated by introducing GT with a heated tube to make the distance between the sample and the focusing lens shorter to 15 mm. Flexible arrangements of the sample, focusing lens, and ESI nozzle in the ion source become possible using ELDI-GT, and ionization is promoted by the heated tube without losing the advantages of ELDI. Therefore, preparation of the sample becomes easier because the matrix application, thin sectioning, and voltage application are not required for the sample. However, sample loss due to the gas transport and a decrease in ionization efficiency are possible. In this study, caffeine was measured with ELDI-GT as a model drug, and the sample transport conditions, that is, the gas flow rate, and the heated tube temperature were adjusted to improve the ion signal intensity. The effect of the amount of heat applied to the gas on the ion signal intensity was discussed, and MSI of the caffeine sample was performed at a pixel size of 50 µm.
EXPERIMENTAL SECTION
Sample preparation
Caffeine, a naturally occurring organic compound with a purine ring, was selected as a low-molecular-weight model drug because it easily sublimates and ionizes. A mixture of acetonitrile (34967-1L, Honeywell, Charlotte, NC, USA) and distilled water (07-6060-7-1L, Sigma-Aldrich, St Louis, MO, USA) at a volume ratio of 8:2 was used as a solvent. Caffeine (C0750-100G, Sigma-Aldrich, USA) was dissolved at a concentration of 5 mg/mL to prepare the sample for MSI.
On the other hand, caffeine was dissolved at a higher concentration of 200 mg/mL to obtain a saturated solution to prepare a uniform sample to optimize the measurement condition. Then 3 µL of the solution was dropped onto a glass slide without any coating (S1112, Matsunami, Osaka, Japan) and cut to 9 mm × 10 mm. The sample solution on the glass slide was dried with warm air using a hair dryer to crystallize the solution. The glass slide was attached to an ablation cell and the cell was fixed to a translation stage. A mixture of methanol (34966-1L, Honeywell, USA) and distilled water at a volume ratio of 1:1 with 1% acetic acid (00212-85, Nacalai Tesque, Kyoto, Japan) was used as the solution for ESI.
Ablation cell design
The ablation cell and the heated tube were used to separate laser ablation and ESI. Particles ablated by laser were transported to ESI by nitrogen gas. Therefore, the detection sensitivity was expected to be lower than that of conventional ELDI, considering the losses during transportation.
In laser ablation inductively coupled plasma mass spectrometry (LA-ICPMS), cylindrical ablation cells with a volume of about 10 cm3 are widely used, but dead volume exists, causing stagnation of fluid and turbulence generation.29–31) This is known to cause particles desorbed by the laser to remain in the cell, resulting in reduced peak sensitivity and temporal resolution. To solve this problem, LA-ICPMS has been reported to use a small cell with a volume of 1 cm3 or less and to insert a transport nozzle inside the cell, thereby achieving faster wash-out than conventional methods.32,33)
Therefore, the shape of the ablation cell was so designed that its performance was less affected by the fluid flow in the ablation cell. Fluid flow in the cell was simulated by computational fluid dynamics (CFD) using Open FOAM (Open CFD, Bracknell, Berkshire, UK), an open-source fluid dynamics software. The fluid was assumed to be steady incompressible, and the standard k-e model of Reynolds-averaged Navier–Stokes with low computational cost was used as the turbulence model. The model was designed using a three-dimensional computer-aided design (3D CAD) software Fusion 360 (Autodesk, San Francisco, CA, USA).
The top surface of the cell had an aperture that allowed full transmission of the laser beam (at least 8 mm × 8 mm in size at a height of 8 mm). To suppress pressure loss and fluid stagnation (spread angle less than 7 degrees), dead space was eliminated as much as possible, and the flow path was designed as an ellipsoid without rapid expansion. The joints for connecting the tubes are integrated with the cell body, and the inlet and outlet ports are shaped to allow the connection of transport tubes of 10 mm outer diameter (OD) × 8 mm internal diameter (ID) and 6 mm OD × 4 mm ID, respectively. Figure 1 shows the schematic drawings of the ablation cell and the flow channel.
The inner volume of the ablation cell was 4.45 cm3. An optical 3D printer (Sonic Mini 4K, Phrozen, Hsinchu, Taiwan) was used for the production. The cell was made of a heat-resistant resin (Sculpt Ultra White, Siraya Tech, Los Angeles, CA, USA) with a heat deflection temperature of 493 K. The ablation cell was equipped with an 18 mm × 24 mm cover glass (C018241, Matsunami, Japan) as the laser transmission window at the top of the cell.
Imaging setup and ion sources
Nitrogen gas at room temperature was supplied from a nitrogen generator (12ES, SYSTEM INSTRUMENTS, Tokyo, Japan) through a quadrupole time-of-flight mass spectrometer (Q-TOF Ultima API, micromass, Wilmslow, Cheshire, UK) to the ablation cell, and the flow rate can be adjusted by the software (MassLynx V4.0 SP4, micromass, UK). The ablated sample was transported by the gas and heated through a heated tube connected to the cell outlet. The gas flow rate was changed from 2.8 to 28 cm3/s. Figure 2 shows a schematic diagram of the ion source using ELDI-GT.
A Q-switched Nd:YAG laser (GAIA II 30-T, Rayture Systems, Tokyo, Japan) at the third harmonic wavelength of 355 nm and a pulse repetition rate of 20 Hz was used for ablation. The Nd:YAG laser beam was focused by a focusing lens with a focal length of 175 mm (LA4924-UV, Thorlabs, Newton, NJ, USA) and then the focus was projected onto the sample through an infinity-corrected imaging optics with a magnification of 1/50. The imaging optics were composed of a tube lens (MT-L, Mitutoyo, Japan), a harmonic separator (YHS-25.4C05-355, Sigmakoki, Tokyo, Japan), and an objective lens (PAL-50-NUV-A, Sigmakoki, Japan).
The spot size was about 30 µm and the average energy density was approximately 80 mJ/cm2. Although it was confirmed that the laser spot size of about 1 µm can be obtained by inserting a pinhole at the first focus made with the focusing lens, the experiments in this paper were performed with the spot size of about 30 µm without using the pinhole to obtain a sufficient ion signal intensity for investigation of the dependence of the ion signal intensity on the gas flow rate and the heated tube temperature. Another tube lens (MT-L, Mitutoyo, Japan) connected with an extension tube (C-mount Extension Tube 50 mm & 100 mm, Edmund Optics, Barrington, NJ, USA) and a color complementary metal-oxide-semiconductor (CMOS) camera (EO-5012C, Edmund Optics, USA) was installed to simultaneously observe the sample during the measurement.
A heated tube (hot hose SUS316 flexible [ϕ7.2] ×300L, Kyoto Dennetsu, Kyoto, Japan) with dichromium wire wrapped around a flexible stainless-steel bellows tube was used for transportation from the ablation cell to the electrospray. This increased the surface area, thereby increasing the amount of heat transfer. The temperature can be raised to around 673 K, which is the maximum operating temperature of the tube, using a temperature controller. The temperature was changed from 333 K to 673 K. The temperature of the emitted gas was measured with a thermocouple sensor (IK-300, CUSTOM, Osaka, Japan) and a thermometer (CT-05SD, CUSTOM, Japan).
The sample ejected from the heated tube was ionized by the application of electrospray at a flow rate and a voltage of 3.0 µL/min and 3.5 kV, respectively. The ablation cell was fixed on a two-axis motorized translation stage (HPS60-20XY-M5, Sigmakoki, Japan), and the motion of the stage was controlled with a two-axis stage controller (SHOT-702, Sigmakoki, Japan) and a software (SGTERM Version 6.0.7, Sigmakoki, Japan). To isolate vibrations from the mass spectrometer and vacuum pumps, the stage and the imaging optics were installed on a passive vibration isolator (AVT-0806, Meiriz Seiki, Tokyo, Japan). The bidirectional raster scan was adopted to continuously acquire the ion signals for 100 × 100 points as a single ion chromatogram. The sample was stopped for 3 s at each point for laser irradiation, and the sample was moved to the next position at a speed of 1.0 mm/s and a step size of 50 µm.
The probe tip of the electrospray was positioned 10 mm away from the sample cone. The outlet of the heated tube was 1.0–5.0 mm away from the tip of the electrospray probe depending on the sample position, and the solution was sprayed to the sample ejected from the heated tube. The spray direction was toward the center of the sample cone and the direction of the gas from the heated tube was perpendicular to the spray direction. Ions were not detected when the tube and spray were emitted in the same direction parallel to each other.
The Q-TOF mass spectrometer was operated in the positive ion MS mode. The quadrupole transmission mass was set to m/z 160, and mainly ions in a m/z range of 100–500 were detected. The scan time and the inter-scan time were set to 0.34 s and 0.1 s, respectively.
Construction of MSI data from the chromatogram
Since the MassLynx software for the Q-TOF mass spectrometer used in this study did not have a function to perform MSI, an in-house software, Mass Spectrometry Imaging GUI, was made to convert an extracted ion chromatogram (EIC) to an image for a specified m/z using Visual Studio code 1.84.2 and Python 3.10.5. The m/z value for the monoisotopic proton adduct ion [M + H]+ of caffeine is 195.1 and the EIC within the m/z range of 194–196 was acquired over 8.4 h. It was separated every 3.03 s, the sum of the laser irradiation time to a spot and the sample travel time to the next spot. Then the time of the chromatogram was converted to the two-dimensional coordinate in the image. The ion signal intensity from the sample was derived by subtracting the noise signal intensity at the start of the EIC of caffeine from all signal intensities as background. The value for each pixel in the image was a logarithm of the integral of the signal intensity within 3.03 s in the EIC.
RESULTS AND DISCUSSION
Flow simulation in the ablation cell
Figure 3 shows the results of the CFD simulation. At the center of the ablation cell, cross-sections perpendicular and parallel to the gas flow direction are shown. The gas spreads in an elliptical shape, indicating that the cell is filled with gas. In addition, when the flow rate is doubled, the flow velocity becomes about twice as fast, but the shape of the velocity distribution is maintained. The right figures show the flow velocity is always positive, and the gas does not flow in the opposite direction. And the flow velocity distribution is more broadly spread than in the cylindrical cell.
To distinguish whether the flow in the cell was laminar or turbulent, the calculation was performed using the formula defining the Reynolds number shown in the following equation:
where ρ (kg/m3) is the density of the fluid, v (m/s) is the flow velocity of the cross-section, D (m) is the inside diameter of the cross-section, and μ (Pa∙s) is the viscosity coefficient of the fluid. The Reynolds number calculated using Eq. (1) was 143 at the center of the cell and 310 at the outlet when the flow rate was 8.3 cm3/s. When the flow rate was 17 cm3/s, the Reynolds number was 272 at the center of the cell and 548 at the outlet. All values are below the lower critical Reynolds number limit of 2040 for circular tube flow. Therefore, it is considered that no turbulence is generated inside the cell.
Mass spectra of caffeine
Figure 4 shows the typical mass spectra obtained from the caffeine crystals made with the saturated solution of caffeine measured at a gas flow rate of 22 cm3/s and a tube temperature of 623 K. It is confirmed that the protonated [M + H]+ ions of caffeine at m/z 195.1, 196.1, and 197.1 are detected only when the laser is irradiated to the sample and ESI is turned on as shown in Fig. 4C. The peaks observed in Fig. 4B, where the laser was not irradiated and only ESI was turned on, are the background noises originated from ESI. These results show that ELDI-GT is different from both LDI and ESI. To adjust the conditions for transporting the sample and to improve the ion signal intensity for MSI, we investigated the effects of two parameters: the gas flow rate and the temperature of the heated tube.
Adjustment of gas flow rate and tube temperature
When the density of nitrogen gas is ρ (kg/cm3), the flow rate of nitrogen gas flowing into the heated tube is v (cm3/s), the specific heat at constant pressure is Cp (J/(kg·K)), the inlet temperature is T1 (K), and the outlet temperature is T2 (K), the heat transport rate Q (W) can be expressed as34)
This means how much amount of heat is transported from the tube to the gas within a unit of time. When the volume in the heated tube is V (cm3), the time t (s) taken for the gas to pass through the tube can be expressed as
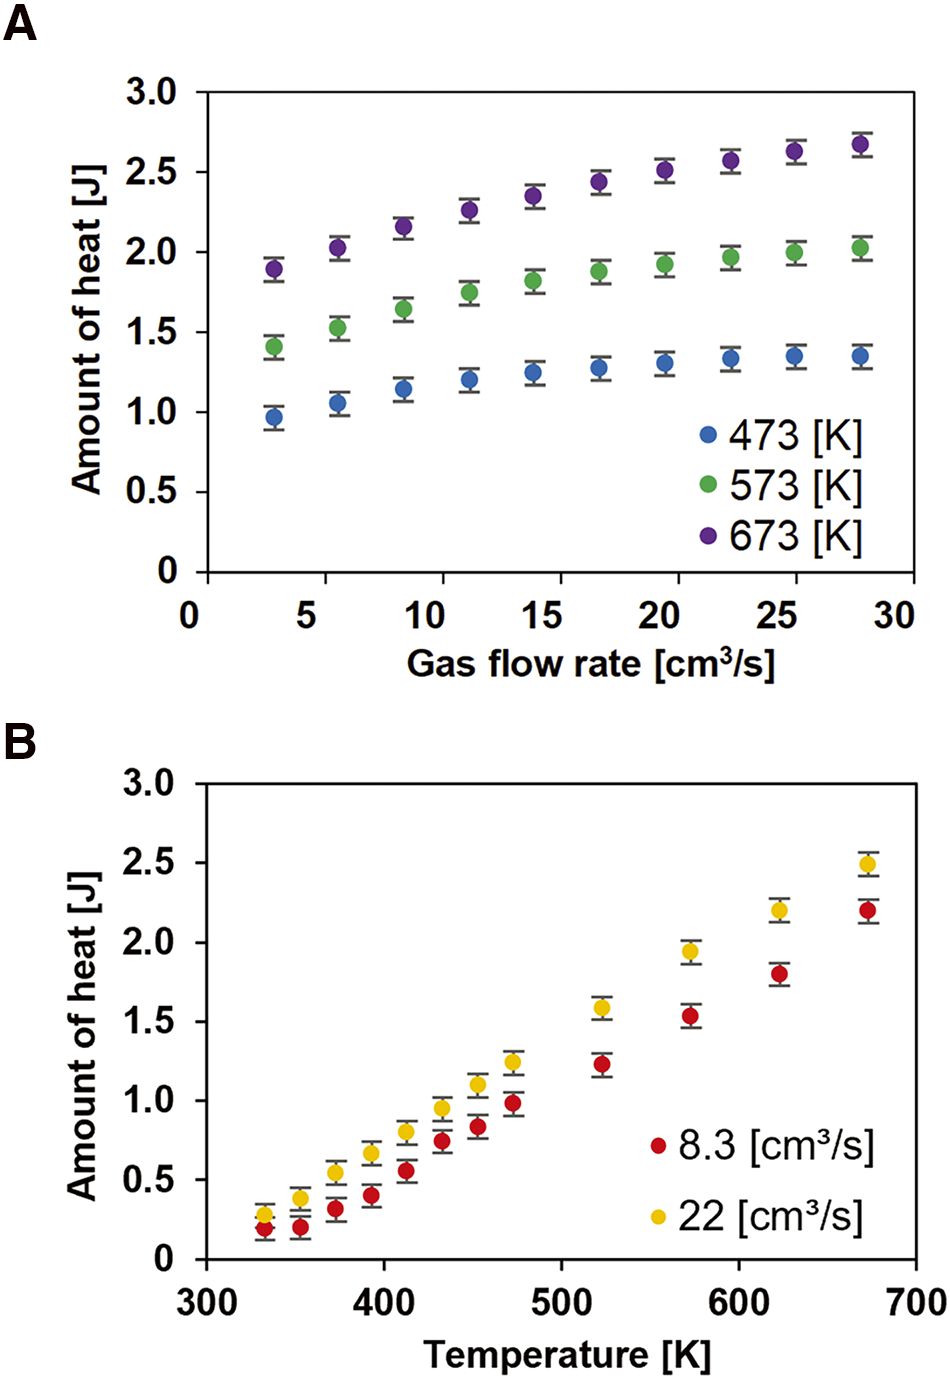
The values used in the calculation are as follows: V = 21 cm3, ρ = 0.70 × 10⁻⁶ kg/cm3, Cp = 1.0 × 10³ J/(kg·K), and T1 = 295.8 K. The value of V was calculated taking account of the diameter of 4.5 mm for the outlet at each end and the minimum and maximum diameters of the heated bellows section of 7.2 mm and 11.1 mm, respectively. The amount of heat gained by the gas per passage through the tube can be expressed as Q∙t (J), i.e., the product of the heat transport rate and the time to pass through the tube. Since the energy required for a single molecule to vaporize or maintain a gaseous state is constant, the amount of heat given to the gas by the tube was related to the number of ions produced. The relationship between the amount of heat and the gas flow rate is shown in Fig. 5A. The heat gained by the gas increased as the flow rate increased. The relationship between the amount of heat and tube temperature is shown in Fig. 5B. The heat obtained from the gas increased almost linearly with the increase in the tube temperature. Because the energy required for molecular sublimation and ionization is constant, the increase in the amount of heat of the gas can be considered to have increased the number of ionized molecules. Figure 6 shows the relationships between the amount of heat applied to the gas and the signal intensity of [M + H]+ of caffeine accumulated within the m/z range of 194–196. The ion signal intensity of caffeine increases as the amount of heat applied to the gas is increased. The ion signal intensity increases at an accelerated rate as the amount of heat applied to the gas increases. Assume that a certain amount of heat was required to ionize the caffeine molecule. Then, as the amount of heat in the gas increases, molecules with the highest energy also increase.
MSI of caffeine crystals
MSI of caffeine crystals prepared with the 5 mg/mL solution was performed. The gas flow rate and the tube temperature were 24 cm3/s and 673 K, respectively. Figure 7A shows the photomicrograph of the caffeine crystal before laser irradiation. Figure 7B shows the result of MSI for caffeine ions at m/z 194–196. Since the sample was precipitated from the rim of the solution droplets, crystals were formed in a ring shape. In both images, the ring-shaped distribution of the crystals and the unevenness of each crystal can be seen to be consistent. In both the photomicrograph and MSI results, strong ion signals from the condensed caffeine crystals were obtained along the edges of the sample, confirming the nearly identical shape of the sample. The distribution of the samples inside the ring was also very similar. The results show that ELDI-GT was able to construct a 2-dimensional distribution of caffeine at a pixel size of 50 µm without the need to apply the voltage and the matrix to the sample at atmospheric pressure. It is supposed that the heated tube effectively imparts the heat to the gas and the efficiency of ESI is increased. This result shows the possibility of detecting samples other than caffeine at atmospheric pressure by maintaining the gaseous state and providing the heat necessary for ionization. Furthermore, if the ion signal intensity increases and the pixel size becomes smaller, imaging at the cellular level may be possible.