Abstract
Congenital disorders of glycosylation (CDG) constitute a group of rare inherited metabolic disorders resulting from mutations in genes involved in the biosynthesis of glycan chains that are covalently attached to proteins or lipids. To date, nearly 200 genes have been identified as responsible for these disorders, with approximately half implicated in N-glycosylation defects. Diagnosis of CDG is primarily achieved through genetic analysis and the identification of glycan abnormalities, referred to as molecular phenotypes. With the increasing use of whole exome and genome sequencing in the investigation of diseases with unknown etiology, the number of cases suspected of CDG is increasing, highlighting the necessity for glycan analysis. Molecular phenotyping in CDG typically targets glycoproteins, with transferrin and apolipoprotein CIII being key representatives of N- and mucin-type O-glycosylation, respectively. Mass spectrometry (MS) provides rapid analysis and yields moderately detailed information, establishing it as a first-line molecular diagnostic tool that complements genetic analysis. Structural anomalies detected by MS can be classified into distinct patterns, which may indicate specific defects within the glycosylation pathway. In cases of CDG types that lack clear molecular phenotypes, characteristic metabolites can often be identified and quantified by MS, further aiding in the diagnostic process. Molecular diagnosis of CDG using MS can be performed with a standard mass spectrometer and a dried blood spot on filter paper, enabling its application in population-based mass screening.
CONGENITAL DISORDERS OF GLYCOSYLATION
Glycans, also referred to as sugar chains, are complex macromolecules composed of monosaccharide units linked by glycosidic bonds. These glycans interact with proteins and lipids, forming glycoconjugates such as glycoproteins and glycolipids. These glycoconjugates play critical roles in a variety of physiological processes, contributing to essential functions within the body. Glycans attached to glycoproteins are classified into several categories based on their attachment sites: N-linked glycans which attach to the asparagine (Asn) residue of the protein backbone, O-linked glycans which bind to serine (Ser) or threonine (Thr), C-Man glycans which attach to tryptophan, and glycolipids which are formed by the attachment of glycans to lipids. Among the O-linked glycans, several subtypes are recognized, including mucin-type O-N-acetylgalactosamine (O-GalNAc), O-mannose (O-Man) (found in dystroglycan), and O-xylose (O-Xyl) (present in glycosaminoglycans).1)
Disorders of glycosylation are generally classified into two primary categories: defects in glycosylation (synthesis) and defects in glycan degradation. The former arise from genetic mutations that affect the synthesis of glycans within the endoplasmic reticulum (ER) and Golgi apparatus.
Glycan synthesis occurs through a series of highly coordinated enzymatic reactions, and congenital defects in these processes are collectively referred to as congenital disorders of glycosylation (CDG). These disorders result from mutations in approximately 190 different genes.2) The concept of CDG was initially developed in the context of N-glycosylation defects, and as a result, the term “CDG” is most commonly associated with N-glycosylation disorders. However, disorders affecting O-glycosylation, such as Fukuyama-type muscular dystrophy, and conditions related to the synthesis of glycosylphosphatidylinositol (GPI), are typically classified as distinct disease categories.
The degradation of glycans occurs within the lysosome, and defects in this process are associated with lysosomal storage diseases, a group of over 70 distinct disorders.3) Within this group, specific subcategories include glycoproteinosis (defects in glycan degradation within glycoproteins), mucopolysaccharidoses (disorders affecting the degradation of glycosaminoglycans), and disorders that impair the breakdown of glycolipids, all of which involve the disruption of glycoconjugate catabolism.
An important consideration in glycosylation disorders is that the sugar residues constituting glycans are derived not only from dietary monosaccharides and polysaccharides but also from monosaccharides released during the degradation of glycans within the lysosome. These recycled monosaccharides are subsequently reused in the synthesis of new glycans. As a result, disorders affecting both glycan degradation and synthesis may co-occur, as exemplified by conditions such as mannosidase (MAN2B2) deficiency, a lysosomal defect that leads to both glycosylation abnormalities and clinical manifestations characteristic of CDG.4)
History
A case report by Jaeken et al. in 1980 is sometimes cited as the beginning of the history of CDG.5) However, the glycosylation defect itself was not described in detail at that time. The concept of glycosylation disorders began to emerge following advancements in protein analysis techniques. In the early 1960s, Svensson et al. introduced isoelectric focusing (IEF), an electrophoretic method for protein separation, which was later applied in Europe around 1980 to study transferrin in various diseases, including alcoholism.6)
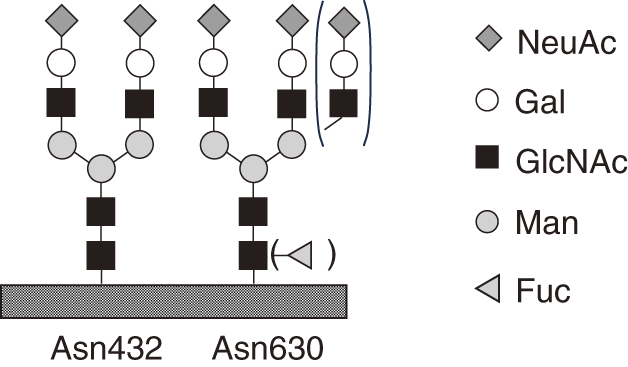
The isoelectric point of transferrin is strongly influenced by an acidic sugar, N-acetylneuraminic acid (NeuAc, sialic acid), which is attached to the terminal galactose (Gal) (Fig. 1). The first evidence of defective glycosylation was reported by Jaeken et al. in 1984, who observed abnormal electrophoretic patterns in twin sisters with neurodevelopmental disorders, linked to a reduced number of NeuAc attachments.7) Subsequently, a new syndrome was described in 1986 in four patients exhibiting a variety of symptoms, including developmental delay. These patients shared the common feature of transferrin lacking not only NeuAc but also other sugars, such as Gal and N-acetylglucosamine (GlcNAc).8) In 1991, this condition was designated as carbohydrate-deficient glycoprotein syndrome, a term that shares the same acronym as the current CDG.9)
In 1992, Wada et al. used mass spectrometry (MS) to demonstrate that transferrin from CDG patients (later identified as PMM2-CDG) lacked entire N-linked glycans.10) Around the same time, a patient was identified who exhibited an abnormal IEF pattern, distinct from the conventional pattern. This case was classified as CDG-II, distinguishing it from the more commonly recognized CDG-I.11) In this CDG-II case, a decrease in N-acetylglucosaminyltransferase activity was observed,12) and the underlying genetic cause was a mutation in the MGAT2 gene,13) marking the first identification of both an enzyme defect and a genetic mutation in CDG. Regarding CDG-I, a deficiency in phosphomannomutase 2 (PMM2) was first identified in 1995,13,14) and the underlying genetic mutation was subsequently discovered.15) The prevalence of PMM2 deficiency is notably high in Europe, with an estimated incidence of approximately 1 in 20,000 individuals.16) Subsequently, a growing number of genes associated with CDG were identified, leading to the establishment of a standardized nomenclature format, where the gene name is followed by the suffix “-CDG” (e.g., PMM2-CDG).17) Meanwhile, the classification of CDGs based on IEF patterns, CDG-I and CDG-II, continues to provide valuable insights as a guide for predicting defect sites in N-linked glycan biosynthesis, as detailed below.
GLYCOSYLATION PATHWAYS AND ENZYMATIC INVOLVEMENT
N-linked glycan synthesis is carried out stepwise on dolichol, a long-chain alcohol that anchors the ER membrane, using sugar nucleotides as donor substrates (Fig. 2). The resulting glycan, consisting of 14 sugars, is then en bloc transferred to the Asn of the Asn-X-Ser/Thr motif of the protein backbone translated and synthesized by the ribosome. After the removal of three glucose (Glc) and one Man residues, the glycoprotein is further transported to the Golgi apparatus, where GlcNAc, Gal, NeuAc, and fucose (Fuc) are added. This process is called glycan processing.
Figure 2 presents a subset of the genes that have been identified in CDG patients to date. These genes are categorized into several groups based on their roles in monosaccharide synthesis and interconversion, nucleotide synthesis and transport, N-linked protein glycosylation, dolichol metabolism, vesicular trafficking, and Golgi homeostasis. A comprehensive list of CDG-associated genes, as of 2023, has been provided by Ng et al.2)
Transferrin, a key diagnostic marker of N-glycosylation disorders
In hereditary diseases, if a known mutation is present and similar clinical symptoms are observed in previous cases or within a family, the diagnosis can often be made based on the identification of the causative gene. However, in other cases, molecular phenotyping, or molecular diagnosis, is necessary. In the context of CDG, the focus is on detecting abnormalities in the glycan structure of glycoproteins. Serum transferrin is the primary choice for analysis of abnormal N-glycosylation.
Transferrin is an 80 kDa glycoprotein composed of 679 amino acid residues, with biantennary complex-type oligosaccharides attached at two specific sites (Asn432 and Asn630) (Fig. 1). The serum concentration of transferrin typically ranges from 250 to 300 mg/dL, making it the second most abundant glycoprotein in serum, following immunoglobulin G (IgG), which has a concentration of 600–1700 mg/dL. The purification of transferrin is facilitated by the use of specific antibodies, and its relatively simple glycan structure allows for the efficient detection of glycosylation abnormalities. NeuAc is attached to the terminal glycan of mature transferrin, and each transferrin molecule, with two biantennary glycans, contains a total of four NeuAc residues. It is important to note that normal glycans are still present in CDG patients, as the complete absence of glycans would result in embryonic lethality. Additionally, glycoproteins with structural abnormalities or a lack of glycans tend to have a fast turnover rate due to quality control mechanisms. As a result, glycan abnormalities may not always be detectable in glycoproteins secreted into the bloodstream, highlighting the limitations of molecular diagnosis in certain cases. In such instances, glycans are typically released from the entire glycoprotein fraction of cultured cells and analyzed using chromatography. The resulting glycan profile is then compared with that of normal cultured cells. However, this level of analysis is generally beyond the scope of routine clinical practice.
IgG is the most abundant glycoprotein in blood, synthesized primarily by lymphocytes, whereas many secretory glycoproteins are produced in the liver. N-linked glycans are attached to the Fc region, and the glycosylation of IgG is more heterogeneous than transferrin, featuring biantennary complex glycans as well as bisecting glycans. The large molecular weight of IgG, combined with the structural diversity of its variable regions, complicates the top-down analysis through techniques such as IEF and MS of intact IgG molecules. Furthermore, IgG does not exhibit glycan defects typical of CDG-I type disorders,18) rendering it unsuitable as a diagnostic marker for CDG. However, IgG stands out for its exceptionally high rate of Fuc attachment compared to other secretory glycoproteins, making it a promising candidate for identifying CDG characterized by impaired fucosylation, as discussed below.
IEF, chromatography, and MS
IEF detects two distinct patterns of abnormalities in transferrin associated with CDG-I and CDG-II (Fig. 3). The CDG-I pattern indicates a disorder in the transfer of glycans to proteins within the ER. This disorder is typically caused by a deficiency in the glycosyltransferases responsible for catalyzing the sequential glycosylation reactions on dolichol, a shortage of biosynthetic enzymes involved in the synthesis of sugar nucleotides, which serve as glycosyl donors, and a malfunction of oligosaccharyltransferase, the enzyme responsible for the final en bloc transfer of glycans to proteins.
CDG-II, on the other hand, involves defects in glycan processing within the ER, occurring after the transfer of glycans, and in the Golgi apparatus. In mature transferrin, NeuAc is added to the terminal glycan, and a single transferrin molecule, with two biantennary glycans at two specific sites, typically carries a total of four NeuAc residues. In CDG-I, transferrin molecules with 2 NeuAc residues (1 glycan) or 0 NeuAc residues (no glycan) are present, representing a reduction of 2 compared to the normal count of 4 NeuAc residues (2 glycans). By contrast, CDG-II exhibits structural abnormalities in the branching chains, with the number of NeuAc residues varying between 3, 2, 1, and 0, in addition to the normal 4 residues, as illustrated in Fig. 3.
IEF detects changes in the number of NeuAc residues at the glycan termini, reflecting structural abnormalities in the glycans in both CDG-I and CDG-II. MS, on the other hand, identifies structural changes in glycans through shifts in molecular mass, including those that do not affect the number of NeuAc.19) The advantage of MS lies in its ability to infer glycan structure based on observed mass alterations, a technique that is part of mass spectrometric molecular phenotyping. This approach relies on the principle of measuring mass changes resulting from structural modifications in proteins, such as amino acid substitutions.20) This capability of MS was demonstrated early in the history of CDG through the detailed characterization of the abnormal structure of transferrin in PMM2-CDG.10) MS utilizes antibodies to selectively extract the transferrin molecules of interest before analysis, while IEF is typically performed by direct separation of the sample followed by western blotting.
In contrast to IEF and MS, which analyze transferrin or specific proteins, chromatography is primarily employed to analyze the glycans of all glycoproteins present in blood or cultured cells.21) In chromatography, glycans are released from glycoproteins and derivatized with labels possessing ultraviolet absorption or fluorescent groups. The labeled glycans are then separated using a column and detected with a photometer or mass spectrometer.22) Due to the large variety of glycans that can be separated and detected, abnormalities in glycan synthesis can be identified through changes in their relative quantities or by comparison to control samples. It is important to note that, in the analysis of glycans released from glycoproteins in blood, IgG contributes a significant proportion to the total glycan pool.
Among the 3 methods, IEF is particularly suited for processing multiple samples concurrently. However, it relies on the visual interpretation of results by the analyst, which limits its ability to provide quantitative evaluations and hampers the detection of subtle abnormalities in glycan structures. Chromatography, while allowing for rapid separation within minutes, involves chemical preparation steps such as glycan release and labeling, which makes it more suitable for research purposes rather than diagnostic applications. Moreover, in CDG-I, where glycans are absent at the Asn attachment site, chromatography would only detect normal glycan structures, rendering it ineffective for this specific condition. By contrast, MS provides rapid analysis and yields moderately detailed information, establishing it as a first-line molecular diagnostic tool that complements genetic analysis.
Electrospray ionization mass spectrum of transferrin
Figure 4A presents the electrospray ionization (ESI) mass spectrum of transferrin from a healthy individual. Protonated molecules, ranging from 27 to 50 charges, are detected between m/z 1500 and m/z 3000. The corresponding structures are displayed in the deconvoluted mass spectrum (Fig. 4B). While the relative signal intensity does not directly correlate with the molecular abundance ratio, it remains reproducible when measured under identical conditions. Notably, glycan analysis by MS demonstrates quantitative accuracy comparable to that of chromatography,23) facilitating the precise evaluation of aberrations when compared to the healthy control group.
Mass spectra of various CDG types
The transferrin glycan structures observed in CDG are illustrated in the patterns shown in Figs. 5–7. In CDG cases characterized by early-stage defects in glycan synthesis, such as PMM2-CDG and ALG9-CDG, a lack of glycans is observed (Fig. 5). In PMM2-CDG, glycan synthesis is disrupted due to a deficiency of mannose donors, whereas in ALG9-CDG, the synthesis of glycan precursors destined for addition to dolichol is impaired at an intermediate stage (Fig. 2). Both conditions result in glycan deficiency, owing to the inadequate supply of mature glycans required for en bloc transfer to nascent proteins. These glycan abnormalities correspond to the CDG-I pattern observed in IEF. The number of glycans per transferrin molecule, typically around 2 in healthy individuals, can be estimated from the intensity of the mass spectrum peaks. Based on the mass spectra shown in Figs. 5A and 5B, this value is approximately 1.1 and 1.7, respectively. However, it is important to note that the degree of glycan deficiency or the failure in glycan addition does not necessarily correlate with the clinical severity of the disease.
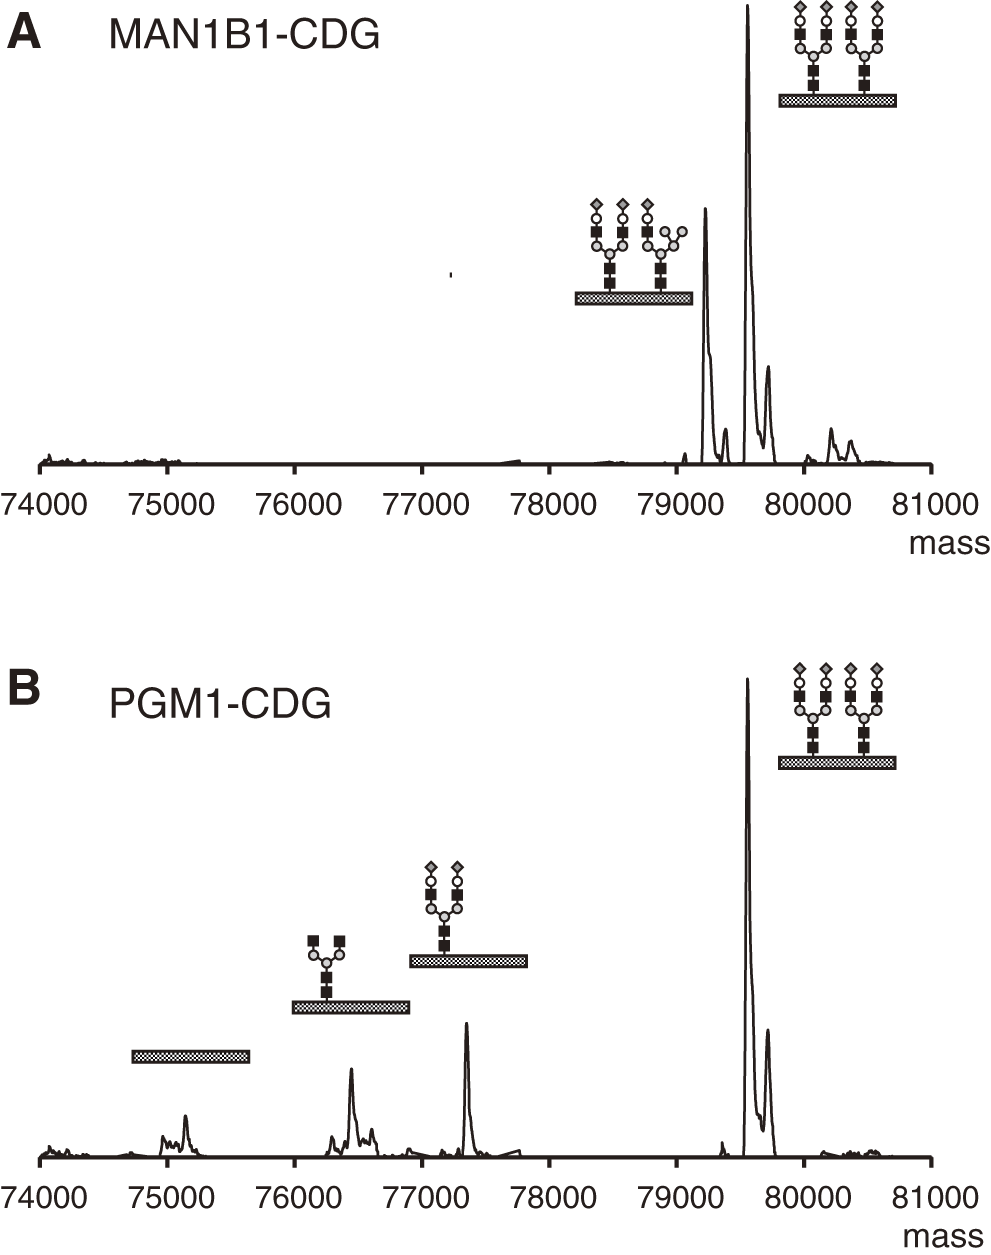
While glycan processing disorders are typically identified by the CDG-II pattern using IEF, MS provides more detailed structural insights (Figs. 6 and 7). In disorders related to vesicular traffickings, such as COG-CDG, or in cases of Golgi homeostasis disruption due to abnormalities in intracellular pH regulation, the absence of NeuAc is particularly evident (Fig. 6A). A concurrent reduction in Gal is often observed (Fig. 6B). In SLC35A2-CDG, a deficiency in the supply of uridine diphosphate Gal (UDP-Gal) to the Golgi apparatus results in truncation of glycans at the Gal moiety (Fig. 6C). Finally, unique mass spectra are presented in Fig. 7. The presence of hybrid glycans in transferrin may be indicative of MAN1B1-CDG (Fig. 7A). PGM1-CDG is characterized by a combination of glycan deficiencies, along with NeuAc/Gal-NeuAc deficiencies, resulting in both CDG-I and CDG-II patterns (Fig. 7B).
QUANTIFICATION TO DEFINE “ABNORMAL”
The diversity of glycan structures is referred to as the glycan profile, and the analysis of their relative content is known as glycan profiling. Glycans inherently exhibit diversity, termed microheterogeneity. Although transferrin typically displays low microheterogeneity, a small proportion of transferrin molecules in healthy individuals may still show NeuAc deficiency or contain only a single glycan. Therefore, “abnormal” should be defined as deviations in the glycan profile from the established reference range.24) This approach by MS is feasible because the vertical axis of the mass spectrum represents the intensity of detected ions, and the relative intensity ratio of each peak is reproducible.
IEF-insensitive CDG: Fucosylation defects
Approximately 10% of N-linked glycans attached to transferrin are fucosylated at the most proximal GlcNAc, with this α1,6-linked Fuc known as core Fuc. Core fucosylation plays a critical role in the function and regulation of glycoproteins. This modification occurs in the Golgi apparatus and is catalyzed by FUT8, utilizing the donor substrate guanosine diphosphate Fuc (GDP-Fuc). Impaired N-linked glycan fucosylation is associated with defects in this glycosylation reaction, as well as with mutations in genes involved in the synthesis of GDP-Fuc in the cytoplasm, the transport of GDP-Fuc to the Golgi apparatus, and the recycling of Fuc degraded in the lysosome. These defects are implicated in disorders such as FUT8-CDG, FCSK-CDG, SLC35C1-CDG, and GFUS-CDG.25) Fuc, being a neutral sugar, cannot be detected by IEF; however, it can be identified through MS, where the Fuc-modified peak, which is 146 Da larger than the main peak, is diminished or absent.26)
Due to the high rate of fucosylation in IgG, disorders related to Fuc addition can be analyzed through chromatography of glycans released from IgG or MS of glycopeptides containing the Fc region.23)
Diagnostic metabolite markers
Even in CDGs, there are cases where glycan fragments, which are degradation products, serve as diagnostic markers, similar to glycoprotein degradation disorders.
GCS1-CDG (MOGS-CDG) is caused by a defect in the removal of the terminal Glc from a dolichol-linked glycan consisting of 14 sugars, after which the glycoprotein is formed and transported to the Golgi apparatus (Fig. 2). In patients, high-mannose glycans, which are absent in the IgG of healthy individuals, can be observed.27) However, in some cases, high-mannose glycans are not detected in transferrin.28) In these cases, the glycan fragments, consisting of four sugars generated during degradation, serve as diagnostic markers.29)
NANS-CDG is a disorder caused by a deficiency in NeuAc synthase (NANS), which is involved in the synthesis of the sugar nucleotide donor for NeuAc. While NeuAc-deficient glycans are not observed in glycoproteins, the enzyme–substrate, N-acetylmannosamine (ManNAc), accumulates in both urine and blood, serving as a diagnostic marker.30)
NGLY1 deficiency, classified as a congenital disorder of de-glycosylation (CDDG), involves a defect in the enzyme responsible for removing glycans from misfolded glycoproteins during synthesis. Although NGLY1 deficiency is not strictly classified as a CDG, it is sometimes included in the CDG category and referred to as NGLY1-CDG. The diagnostic marker for this disorder is Asn-GlcNAc, a metabolite in which the bond between Asn and the glycan remains intact. These diagnostic markers are small molecules that are excreted in urine, making their analysis relatively straightforward. They can be quantified using ESI-MS in both blood and urine samples.
Application to assessing therapeutic efficacy
Since the synthetic pathway is not entirely disrupted in CDG patients, certain disease types may respond to treatments such as monosaccharide supplementation. For example, in SLC35A2-CDG, which is characterized by impaired galactosylation, both clinical symptoms and the glycan profile improve with Gal supplementation.31) This suggests that glycan abnormalities can fluctuate due to various environmental factors, such as diet, potentially becoming a reason why glycan abnormalities, as a molecular phenotype, may not be detectable in some CDG types or cases.
Glycopeptide analysis by MALDI-MS
Matrix-assisted laser desorption/ionization (MALDI) generates singly charged ions, which are subsequently accelerated and detected by a time-of-flight (TOF) mass spectrometer. During the ionization process, glycosidic bonds are easily dissociated, with the loss of NeuAc being particularly prominent. Although this dissociation occurs during ion flight, prior to detection (post-source decay), a linear TOF analyzer can measure the ion’s mass at the point of acceleration, reflecting the mass of the molecule bound to the glycan. Consequently, linear TOF is the preferred method for analyzing glycan structures in glycoproteins and glycopeptides. In MALDI-MS, protonated transferrin molecules generate a broad peak due to the low resolving power (Fig. 8A). Nevertheless, the loss of one glycan (2,206 Da) in CDG-I cases can still be detected (Fig. 8B). While alterations associated with CDG-II are difficult to detect in MALDI-MS of transferrin, they can be identified in MALDI of glycopeptides with molecular weights in the several-thousand range. Unlike ESI, which produces multiply charged ions, MALDI-MS generates singly charged ions, making it easier to identify target peptides in complex mixtures, such as tryptic digests. This provides an advantage over ESI, which generally requires chromatographic separation.
In the tryptic digest of transferrin, there are over 50 types of peptides; however, the peptides (glycopeptides) with sialylated biantennary glycans (average mass, 2206.0) attached to Asn432 and Asn630 have average masses of 3,683.7 and 4,722.8, respectively, with only two other peptides exceeding 3000 Da (Fig. 8C). Molecular diagnosis of CDG is relatively straightforward, such as evaluating the deletion of one sugar residue or assessing the level of Fuc addition in CDG-II.32) In CDG-I, where only normal glycans are present, attention is directed toward the presence or absence of peptides without glycans, such as those derived from Asn432 (m/z 1478.7) and Asn630 (m/z 2517.8). It is sufficient to examine either the glycan at Asn432 or Asn630. However, since Fuc addition is more prominent at Asn630, analyzing peptides containing Asn630 is preferable. In this case, the m/z range of 2500–5000 should be measured.
Since MALDI generates singly protonated molecules, its ionization efficiency is lower for glycopeptides containing NeuAc.33) As a result, the intensity of glycopeptide ions with different numbers of NeuAc residues does not accurately reflect their relative abundance. However, when measurement conditions are consistent, MALDI provides high reproducibility of mass spectra, enabling quantitative evaluation.23) Although MALDI mass spectrometers are less common than ESI mass spectrometers, their use has increased in clinical laboratories for bacterial identification, and this method can be conducted with such equipment. Glycopeptide analysis is also possible with ESI; however, liquid-chromatography (LC)-MS is necessary to separate peptides via chromatography before analysis.
Mucin-type O-glycans: Apolipoprotein CIII
Mucin-type glycans are synthesized in the Golgi apparatus through the addition of GalNAc to the Ser or Thr residues of proteins, followed by the sequential addition of sugars to the non-reducing end of the glycan.
Apolipoprotein CIII (apoCIII) is widely used as a model protein for studying mucin-type glycan addition and has been analyzed by IEF, similar to transferrin.34) ApoCIII is a relatively small glycoprotein (less than 10,000 Da) that contains a single mucin-type O-glycan and lacks N-linked glycans. The O-glycan consists of up to 4 sugar units, which may include 0, 1, or 2 NeuAc residues (Fig. 9A). Of particular note, MALDI-MS can obtain glycan profiles directly from serum with a simple desalting procedure. In contrast to IEF, which requires the use of anti-apoCIII antibodies for detection, this MALDI-MS method eliminates the need for antibody purification. It requires only a few microliters of serum, is significantly faster, simpler, and more sensitive, and provides a distinct advantage over IEF in distinguishing molecular species without NeuAc attachment (Fig. 9B).35)
The primary focus in detecting abnormalities in apoCIII glycans is the reduced levels of NeuAc addition. Defects in the addition of NeuAc to the O-glycans of apoCIII are often accompanied by impairments in the addition of NeuAc to N-glycans. These abnormalities can arise from defects in the cytidine monophosphate NeuAc (CMP-NeuAc) transporter (SLC35A1-CDG), disruption of Golgi homeostasis, or defects in vesicular trafficking. Figure 9C illustrates an example of the absence of O-glycans and impaired terminal NeuAc addition in ATP6V0A2-CDG, a disorder affecting the proton pump involved in intracellular pH regulation.
There are several isozymes of polypeptide GalNAc-transferase (GALNT) that catalyze the addition of GalNAc to protein backbones in mucin-type glycans. Due to redundancy in their substrate specificity, the deficiency of any single GALNT isoform does not typically result in a glycan addition defect. However, the mucin-type glycosylation of apoCIII uniquely depends on GALNT2,36) and a lack of GALNT2 leads to a notable increase in apoCIII without glycosylation in GALNT2-CDG.
ApoCIII can also be analyzed by ESI-MS if purified using an anti-apoCIII antibody, with the same mass spectrometer employed for transferrin analysis.35)
PROMOTING MOLECULAR DIAGNOSIS USING MS
Use of widely available triple-quadrupole mass spectrometers
The multiply charged ions of transferrin generated by ESI span a broad mass range, as shown in Fig. 4A, necessitating a high m/z range to cover all ions. As a result, quadrupole (Q) TOF (QTOF) mass spectrometers are often preferred for these analyses, leading to the misconception that such analyses can only be performed with QTOF instruments.37) However, ESI triple-Q mass spectrometers, which are commonly used in the analysis of metabolites and drugs and thus by far the most popular, have a more limited upper mass range. Figure 10A presents a mass spectrum obtained using a triple-Q mass spectrometer designed for neonatal screening of inborn errors of metabolism. Despite a measurable m/z limit of 2000, ions with a charge state higher than 40 cannot be detected; nonetheless, a deconvolution spectrum comparable to that obtained with a TOF instrument (Fig. 4B) can still be generated. Furthermore, valuable diagnostic information can be derived by closely examining ions with specific charge states, even in the absence of deconvolution. For example, Fig. 10B illustrates the mass spectrum of PGM1-CDG, where ions characteristic of both CDG-I and CDG-II can be identified in a narrow m/z range between m/z 1950 and m/z 2000.24) The same instrument can also be used to analyze ApoCIII.
Use of dried blood spots for mass screening
In the context of receiving analysis requests from external institutions, serum typically needs to be transported under frozen conditions. However, if dried blood spots (DBSs) could be utilized, as in the neonatal mass screening program, they could be sent at ambient temperature, offering a more efficient and cost-effective method of sample transportation. Consequently, DBSs are used as samples in the current mass screening methodology. In standard neonatal mass screening, low-molecular-weight metabolites, such as amino acids, organic acids, fatty acids, and monosaccharides, are analyzed, whereas CDG diagnoses focus on protein analysis. This presents concerns regarding potential protein denaturation during the drying process. Nevertheless, as demonstrated by the successful measurement of galactose-1-phosphate uridyltransferase in the classical neonatal mass screening for galactosemia, protein structure and function remain, to some extent, intact in dried blood samples. In the case of transferrin, the recovery from DBS is relatively high, approximately 75%, when compared to serum. A simple elution of serum from 3 mm diameter DBS with phosphate-buffered saline followed by immunopurification can achieve a glycan profile comparable to that obtained from serum.38) Figure 10C provides an example of PGM1-CDG analysis.
While the CDG analysis methodology appears sufficiently refined for mass screening, it cannot be directly incorporated into the current standard neonatal mass screening process. Current neonatal mass screening employs LC-MS, but the first LC step does not serve to separate components; rather, it functions merely as an introduction, with separation and identification occurring in tandem MS. By contrast, CDG analysis using transferrin (or apoCIII) requires antibody-based purification and reversed-phase LC prior to MS for desalting. Although these steps can be automated, the specialized pretreatment equipment required for CDG analysis presents a challenge in integrating it into the existing neonatal mass screening framework.
CONCLUSION
Diagnosing CDG based solely on clinical symptoms is extremely difficult, which underscores the importance of genetic and molecular analyses in identifying and diagnosing affected cases. Transferrin is the second most abundant glycoprotein, characterized by a simple N-glycan structure, making it a standard diagnostic marker for CDG using MS or IEF. However, transferrin has certain limitations as a biomarker. For example, its N-glycan does not contain structures such as bisecting GlcNAc, high mannose, or hybrid types, which contribute to more complex microheterogeneity. Additionally, in cases where molecular abnormalities in CDG do not manifest in secretory glycoproteins, the analysis of glycans derived from whole cells, typically fibroblasts, becomes necessary. ApoCIII, an exceptionally small glycoprotein with a single mucin-type O-glycan, provides valuable supplemental information, particularly regarding sialylation. The molecular diagnostic methods using MS for transferrin and ApoCIII have become well established as first-line diagnostic tools for CDG. It is essential to further advance their accessibility and integration into clinical practice to enhance our understanding of this emerging group of inherited metabolic disorders.
ACKNOWLEDGMENTS
The author would like to thank Dr. Okamoto (Osaka WCH, Japan) and Dr. Marquardt (University of Muenster, Germany) for providing CDG patient samples, and Ms. Kadoya for her technical assistance. This work was supported by a Grant-in-Aid from AMED (24ek0109614).
Notes
Mass Spectrom (Tokyo) 2025; 14(1): A0169
REFERENCES
- 1) Essentials of Glycobiology, Cold Spring Harbor Laboratory Press, Cold Spring Harbor (NY), 2022.
- 2) B. G. Ng, H. H. Freeze, N. Himmelreich, N. Blau, C. R. Ferreira. Clinical and biochemical footprints of congenital disorders of glycosylation: Proposed nosology. Mol. Genet. Metab. 142: 108476, 2024.
- 3) F. M. Platt, A. d’Azzo, B. L. Davidson, E. F. Neufeld, C. J. Tifft. Lysosomal storage diseases. Nat. Rev. Dis. Primers 4: 27, 2018.
- 4) J. Verheijen, S. Y. Wong, J. H. Rowe, K. Raymond, J. Stoddard, O. M. Delmonte, M. Bosticardo, K. Dobbs, J. Niemela, E. Calzoni, S. Y. Pai, U. Choi, Y. Yamazaki, A. M. Comeau, E. Janssen, L. Henderson, M. Hazen, G. Berry, S. D. Rosenzweig, H. H. Aldhekri, M. He, L. D. Notarangelo, E. Morava. Defining a new immune deficiency syndrome: MAN2B2-CDG. J. Allergy Clin. Immunol. 145: 1008–1011, 2020.
- 5) J. Jaeken, M. Vanderschueren-Lodeweyckx, P. Casaer, L. Snoeck, L. Corbeel, E. Eggermont, R. Eeckels. Familial psychomotor retardation with markedly fluctuating serum prolactin, FSH and GH levels, partial TBG-deficiency, increased serum arylsulphatase A and increased CSF protein: A new syndrome?: 90. Pediatr. Res. 14: 179–1011, 1980.
- 6) H. G. Van Eijk, W. L. Van Noort, G. de Jong, J. F. Koster. Human serum sialo transferrins in diseases. Clin. Chim. Acta 165: 141–145, 1987.
- 7) J. Jaeken, H. G. van Eijk, C. van der Heul, L. Corbeel, R. Eeckels, E. Eggermont. Sialic acid-deficient serum and cerebrospinal fluid transferrin in a newly recognized genetic syndrome. Clin. Chim. Acta 144: 245–247, 1984.
- 8) H. Stibler, J. Jaeken. Carbohydrate deficient serum transferrin in a new systemic hereditary syndrome. Arch. Dis. Child. 65: 107–111, 1990.
- 9) J. Jaeken, H. Stibler, B. Hagberg. The carbohydrate-deficient glycoprotein syndrome. A new inherited multisystemic disease with severe nervous system involvement. Acta Paediatr. Scand. Suppl. 375: 1–71, 1991.
- 10) Y. Wada, A. Nishikawa, N. Okamoto, K. Inui, H. Tsukamoto, S. Okada, N. Taniguchi. Structure of serum transferrin in carbohydrate-deficient glycoprotein syndrome. Biochem. Biophys. Res. Commun. 189: 832–836, 1992.
- 11) V. T. Ramaekers, H. Stibler, J. Kint, J. Jaeken. A new variant of the carbohydrate deficient glycoproteins syndrome. J. Inherit. Metab. Dis. 14: 385–388, 1991.
- 12) J. Jaeken, H. Schachter, H. Carchon, P. De Cock, B. Coddeville, G. Spik. Carbohydrate deficient glycoprotein syndrome type II: A deficiency in Golgi localised N-acetyl-glucosaminyltransferase II. Arch. Dis. Child. 71: 123–127, 1994.
- 13) J. Tan, J. Dunn, J. Jaeken, H. Schachter. Mutations in the MGAT2 gene controlling complex N-glycan synthesis cause carbohydrate-deficient glycoprotein syndrome type II, an autosomal recessive disease with defective brain development. Am. J. Hum. Genet. 59: 810–817, 1996.
- 14) E. Van Schaftingen, J. Jaeken. Phosphomannomutase deficiency is a cause of carbohydrate-deficient glycoprotein syndrome type I. FEBS Lett. 377: 318–320, 1995.
- 15) G. Matthijs, E. Schollen, E. Pardon, M. Veiga-Da-Cunha, J. Jaeken, J. J. Cassiman, E. Van Schaftingen. Mutations in PMM2, a phosphomannomutase gene on chromosome 16p13, in carbohydrate-deficient glycoprotein type I syndrome (Jaeken syndrome). Nat. Genet. 16: 88–92, 1997.
- 16) S. Pajusalu, M. A. Vals, L. Mihkla, U. Šamarina, T. Kahre, K. Õunap. The estimated prevalence of N-linked congenital disorders of glycosylation across various populations based on allele frequencies in general population databases. Front. Genet. 12: 719437, 2021.
- 17) J. Jaeken, T. Hennet, H. H. Freeze, G. Matthijs. On the nomenclature of congenital disorders of glycosylation (CDG). J. Inherit. Metab. Dis. 31: 669–672, 2008.
- 18) J. Gu, A. Kondo, N. Okamoto, Y. Wada. Oligosaccharide structures of immunoglobulin G from two patients with carbohydrate-deficient glycoprotein syndrome. Glycosylation & Disease 1: 247–252, 1994.
- 19) R. Barone, L. Sturiale, D. Garozzo. Mass spectrometry in the characterization of human genetic N-glycosylation defects. Mass Spectrom. Rev. 28: 517–542, 2009.
- 20) Y. Wada, A. Hayashi, T. Fujita, T. Matsuo, I. Katakuse, H. Matsuda. Structural analysis of human hemoglobin variants with field desorption mass spectrometry. Biochim. Biophys. Acta Protein Struct. 667: 233–241, 1981.
- 21) B. Xia, W. Zhang, X. Li, R. Jiang, T. Harper, R. Liu, R. D. Cummings, M. He. Serum N-glycan and O-glycan analysis by mass spectrometry for diagnosis of congenital disorders of glycosylation. Anal. Biochem. 442: 178–185, 2013.
- 22) L. R. Ruhaak, G. Zauner, C. Huhn, C. Bruggink, A. M. Deelder, M. Wuhrer. Glycan labeling strategies and their use in identification and quantification. Anal. Bioanal. Chem. 397: 3457–3481, 2010.
- 23) Y. Wada, P. Azadi, C. E. Costello, A. Dell, R. A. Dwek, H. Geyer, R. Geyer, K. Kakehi, N. G. Karlsson, K. Kato, N. Kawasaki, K. H. Khoo, S. Kim, A. Kondo, E. Lattova, Y. Mechref, E. Miyoshi, K. Nakamura, H. Narimatsu, M. V. Novotny, N. H. Packer, H. Perreault, J. Peter-Katalinic, G. Pohlentz, V. N. Reinhold, P. M. Rudd, A. Suzuki, N. Taniguchi. Comparison of the methods for profiling glycoprotein glycans—HUPO Human Disease Glycomics/Proteome Initiative multi-institutional study. Glycobiology 17: 411–422, 2007.
- 24) Y. Wada, N. Okamoto. Electrospray ionization mass spectrometry of transferrin: Use of quadrupole mass analyzers for congenital disorders of glycosylation. Mass Spectrom. (Tokyo) 11: A0103, 2022.
- 25) A. Hüllen, K. Falkenstein, C. Weigel, H. Huidekoper, N. Naumann-Bartsch, J. Spenger, R. G. Feichtinger, J. Schaefers, S. Frenz, D. Kotlarz, T. Momen, R. Khoshnevisan, K. M. Riedhammer, R. Santer, T. Herget, A. Rennings, D. J. Lefeber, J. A. Mayr, C. Thiel, S. B. Wortmann. Congenital disorders of glycosylation with defective fucosylation. J. Inherit. Metab. Dis. 44: 1441–1452, 2021.
- 26) Y. Wada, M. Kadoya. Quantitative assessment of core fucosylation for congenital disorders of glycosylation. Mass Spectrom. (Tokyo) 13: A0159, 2024.
- 27) M. A. Sadat, S. Moir, T. W. Chun, P. Lusso, G. Kaplan, L. Wolfe, M. J. Memoli, M. He, H. Vega, L. J. Y. Kim, Y. Huang, N. Hussein, E. Nievas, R. Mitchell, M. Garofalo, A. Louie, D. C. Ireland, C. Grunes, R. Cimbro, V. Patel, G. Holzapfel, D. Salahuddin, T. Bristol, D. Adams, B. E. Marciano, M. Hegde, Y. Li, K. R. Calvo, J. Stoddard, J. S. Justement, J. Jacques, D. A. Long Priel, D. Murray, P. Sun, D. B. Kuhns, C. F. Boerkoel, J. A. Chiorini, G. Di Pasquale, D. Verthelyi, S. D. Rosenzweig. Glycosylation, hypogammaglobulinemia, and resistance to viral infections. N. Engl. J. Med. 370: 1615–1625, 2014.
- 28) S. Shimada, B. G. Ng, A. L. White, K. K. Nickander, C. Turgeon, K. L. Liedtke, C. T. Lam, E. Font-Montgomery, C. M. Lourenco, M. He, D. S. Peck, L. A. Umana, C. L. Uhles, D. Haynes, P. G. Wheeler, M. J. Bamshad, D. A. Nickerson, T. Cushing, R. Gates, N. Gomez-Ospina, H. M. Byers, F. B. Scalco, N. N. Martinez, R. Sachdev, L. Smith, A. Poduri, S. Malone, R. V. Harris, I. E. Scheffer, S. D. Rosenzweig, D. R. Adams, W. A. Gahl, M. C. V. Malicdan, K. M. Raymond, H. H. Freeze, L. A. Wolfe; UW Center for Mendelian Genomics. Clinical, biochemical and genetic characteristics of MOGS-CDG: A rare congenital disorder of glycosylation. J. Med. Genet. 59: 1104–1115, 2022.
- 29) R. Anzai, M. Tsuji, S. Yamashita, Y. Wada, N. Okamoto, H. Saitsu, N. Matsumoto, T. Goto. Congenital disorders of glycosylation type IIb with MOGS mutations cause early infantile epileptic encephalopathy, dysmorphic features, and hepatic dysfunction. Brain Dev. 43: 402–410, 2021.
- 30) B. den Hollander, A. Rasing, M. A. Post, W. M. Klein, M. M. Oud, M. M. Brands, L. de Boer, U. F. H. Engelke, P. van Essen, S. A. Fuchs, C. A. Haaxma, B. O. Jensson, L. A. J. Kluijtmans, A. Lengyel, K. D. Lichtenbelt, E. Østergaard, G. Peters, R. Salvarinova, M. E. H. Simon, K. Stefansson, Ó. Thorarensen, U. Ulmen, K. L. M. Coene, M. A. Willemsen, D. J. Lefeber, C. D. M. van Karnebeek. NANS-CDG: Delineation of the genetic, biochemical, and clinical spectrum. Front. Neurol. 12: 668640, 2021.
- 31) P. Witters, S. Tahata, R. Barone, K. Õunap, R. Salvarinova, S. Grønborg, G. Hoganson, F. Scaglia, A. M. Lewis, M. Mori, J. Sykut-Cegielska, A. Edmondson, M. He, E. Morava. Clinical and biochemical improvement with galactose supplementation in SLC35A2-CDG. Genet. Med. 22: 1102–1107, 2020.
- 32) Y. Wada. Matrix-assisted laser desorption/ionization mass spectrometry to detect diagnostic glycopeptide markers of congenital disorders of glycosylation. Mass Spectrom. (Tokyo) 9: A0084, 2020.
- 33) D. I. Papac, A. Wong, A. J. Jones. Analysis of acidic oligosaccharides and glycopeptides by matrix-assisted laser desorption/ionization time-of-flight mass spectrometry. Anal. Chem. 68: 3215–3223, 1996.
- 34) S. Wopereis, S. Grünewald, E. Morava, J. M. Penzien, P. Briones, M. T. García-Silva, P. N. Demacker, K. M. Huijben, R. A. Wevers. Apolipoprotein C-III isofocusing in the diagnosis of genetic defects in O-glycan biosynthesis. Clin. Chem. 49: 1839–1845, 2003.
- 35) Y. Wada, M. Kadoya, N. Okamoto. Mass spectrometry of apolipoprotein C-III, a simple analytical method for mucin-type O-glycosylation and its application to an autosomal recessive cutis laxa type-2 (ARCL2) patient. Glycobiology 22: 1140–1144, 2012.
- 36) M. Zilmer, A. C. Edmondson, S. A. Khetarpal, V. Alesi, M. S. Zaki, K. Rostasy, C. G. Madsen, F. R. Lepri, L. Sinibaldi, R. Cusmai, A. Novelli, M. Y. Issa, C. D. Fenger, R. Abou Jamra, H. Reutter, S. Briuglia, E. Agolini, L. Hansen, U. E. Petäjä-Repo, J. Hintze, K. M. Raymond, K. Liedtke, V. Stanley, D. Musaev, J. G. Gleeson, C. Vitali, W. T. O’Brien, E. Gardella, G. Rubboli, D. J. Rader, K. T. Schjoldager, R. S. Møller. Novel congenital disorder of O-linked glycosylation caused by GALNT2 loss of function. Brain 143: 1114–1126, 2020.
- 37) N. Abu Bakar, D. J. Lefeber, M. van Scherpenzeel. Clinical glycomics for the diagnosis of congenital disorders of glycosylation. J. Inherit. Metab. Dis. 41: 499–513, 2018.
- 38) Y. Wada, M. Kadoya, N. Okamoto. Mass spectrometry of transferrin and apolipoprotein CIII from dried blood spots for congenital disorders of glycosylation. Mass Spectrom. (Tokyo) 11: A0113, 2022.