Abstract
Accurate mass measurement requires the highest possible mass resolution, to ensure that only a single elemental composition contributes to the mass spectral peak in question. Although mass resolution is conventionally defined as the closest distinguishable separation between two peaks of equal height and width, the required mass resolving power can be ∼10× higher for equal width peaks whose peak height ratio is 100 : 1. Ergo, minimum resolving power requires specification of maximum dynamic range, and is thus 10–100× higher than the conventional definition. Mass resolving power also depends on mass-to-charge ratio. Mass accuracy depends on mass spectral signal-to-noise ratio and digital resolution. Finally, the reliability of elemental composition assignment can be improved by resolution of isotopic fine structure. Thus, the answer to the question of “how much is enough mass resolving power” requires that one first specify S/N ratio, dynamic range, digital resolution, mass-to-charge ratio, and (if available) isotopic fine structure. The highest available broadband mass resolving power and mass accuracy is from Fourier transform ion cyclotron resonance mass spectrometry. Over the past five years, FT-ICR MS mass accuracy has improved by about an order of magnitude, based on higher magnetic field strength, conditional averaging of time-domain transients, better mass calibration (spectral segmentation; inclusion of a space charge term); radially dispersed excitation; phase correction to yield absorption-mode display; and new ICR cell segmentation designs.
INTRODUCTION
A primary goal in mass spectrometry is to identify an analyte, particularly in the presence of other analytes, based on measurement of ion mass. This paper addresses the question of the minimum mass resolving power required to provide mass accuracy sufficient to assign a unique elemental composition, CcHhNnOoSs…, from measurement of mass spectral peak position. Our treatment focuses on Fourier transform ion cyclotron resonance mass spectrometry,1) because it offers the highest broadband resolution of any mass analyzer. Recent examples include resolution and identification of tens of thousands of monoisotopic elemental compositions from a single mass spectrum of petroleum crude oil2) and unit mass resolution of an intact 147 kDa antibody.3)
Recent improvements in FT-ICR mass resolution and accuracy are conveniently separated into instrumental and data reduction categories. Optimization of the experiment has until now been based on single-ion simulations,1) but may in future be guided by large-scale simulations of the trajectories of up to a million or more ions4–6) as they are injected into an ICR ion trap for subsequent excitation and detection. We begin with experimental advances, and then proceed to software developments.
EXPERIMENTAL METHODS
ICR trapped ion cell configurationFT-ICR excitation and detection were originally performed with a cubic cell, with dc “trapping” voltage applied to a pair of opposed axial end cap electrodes, rf excitation voltage applied to one pair of opposed transverse electrodes, and induced rf signal detected on the other pair of opposed transverse electrodes.7) Cubic and tetragonal cells were then replaced by a cylindrical cell,8) with a variety of segmentation configurations designed to approach a three-dimensional axial quadrupolar dc trapping potential, and more spatially uniform excitation and detection electric fields.9,10) The best current performance has been obtained with the cells shown schematically in Fig. 1.11–14) The Tolmachev cell extends an original Gabrielse idea of multiple axial segments to which different dc voltages are applied to produce a nearly quadrupolar trapping potential.15) The Nikolaev “dynamically harmonized” cell relies on ion cyclotron motion itself to average out imperfections in the trapping electric field produced by segmented “leaf” electrodes. The Nikolaev cell has achieved mass resolving power greater than 1,000,000 for bovine serum albumin and 20,000,000 for narrow-band detection of reserpine (m/z 609).16)

FT-ICR mass resolving power is directly proportional to the duration of an undamped time-domain ICR signal, which in turn requires maintenance of tight spatial coherence of an orbiting packet of ions of a given m/z ratio. Large-scale simulations have shown that such spatial coherence requires a minimum number of trapped ions.4) Those same simulations also predict coalescence of the trajectories of ions of closely spaced m/z, as a function of the number of trapped ions.17) Thus, for compositionally complex mixtures containing thousands of different elemental compositions, it may be necessary to average 100 or more FT-ICR mass spectra to achieve the desired signal-to-noise ratio and dynamic range. Finally, ion trajectory simulations are also helping to predict (and rectify) degradation in performance due to imperfect construction/alignment of electrodes,6) magnetic field inhomogeneity,18) choice of excitation waveform, etc.
Sample preparationRussian bitumen was dissolved in toluene to yield a 1 mg/mL stock solution. The sample was further diluted to 0.25 mg/mL with 49 : 49 (v/v) toluene–methanol and 2% formic acid for protonation during positive ion electrospray ionization (ESI).
FT-ICR mass spectrometryA custom-built FT-ICR mass spectrometer13) equipped with a passively shielded 9.4 tesla superconducting horizontal solenoid magnet and an electrically compensated cell,12,13) was used for all experiments. Samples were directly pumped through a fused silica capillary at 0.5 μL/min through a 50 μm i.d. fused silica microESI needle under typical ESI conditions (needle, 2.3 kV; tube lens, 350 V; heated metal capillary current, ∼5.0 A). External quadrupole isolation was performed with an Extrel QC 150 quadrupole mass filter (Pittsburgh, PA) and a custom-built accumulation octopole.19–21) Ions in the accumulation octopole were cooled with helium gas at ∼2 mTorr before transfer to the ICR cell. Initial broadband analysis guided the construction of a 4 Mword, 10 Msample/s time-domain excitation waveform.22,23) The SWIFT waveform was stored in the hard drive of a PC data system prior to loading of both the isolation and broadband excitation waveforms to an arbitrary waveform generator (National Instruments (NI) model PXI 5421) and later amplified for output to the ICR cell. After quadrupole and SWIFT isolation of the initial ion population, the resultant spectrum was acquired after broadband excitation of remaining ions at 96 kHz to 961 kHz at 50 Hz/μs and 378 Vp–p. Time-domain data (8 Mword, low m/z cutoff=211) were routed to a differential preamplifier and ultimately digitized (NI Model PXI 5122) by a Predator data station.23)
RESULTS AND DISCUSSION
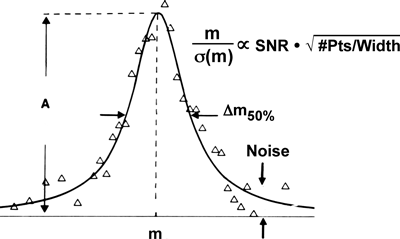
Signal-to-noise ratio and mass measurement precisionFor a discrete mass spectrum (see Fig. 2), mass measurement precision may be defined as m/σ(m), in which m is measured mass and σ(m) is the standard deviation for a large number of measurements. Fortunately, under very general conditions, it is possible to predict the precision for a large number of measurements from the signal-to-noise ratio, S/N, of a single measurement, according to Eq. (1):
 | (1) |
in which the constant depends on mass spectral peak shape and is of order one in magnitude.24) In the absence of systematic error (as recently demonstrated for FT-ICR MS,25) mass accuracy is the same as mass precision. The importance of Eq. (1) is that it shows that mass imprecision (which ultimately limits mass accuracy) depends directly on SNR. Thus, SNR must be specified in any report of mass measurement accuracy.
Dynamic range and mass accuracyMass resolution is conventionally defined as the minimum separation between two mass spectral peaks of equal height and width, such that there is a detectable “valley” between them. Mass resolving power is then defined as (m1/(m2−m1)) (Fig. 3, top). Under that definition, mass resolving power (even for a single peak) is m/∆m50%, in which ∆m50% is mass spectral peak full width at half-maximum peak height. However, if (as is almost always the case experimentally) the two peaks are of unequal height, then the minimum mass resolving power to produce a valley between them can be much higher (e.g., ten times higher for a peak height ratio of 100 : 1 (Fig. 3, bottom). The dynamic range for FT-ICR MS peaks can exceed 10,000 : 1, and may be increased by radially dispersed excitation.26) Thus, dynamic range must also be specified in determining the minimal mass resolving power for a particular application.
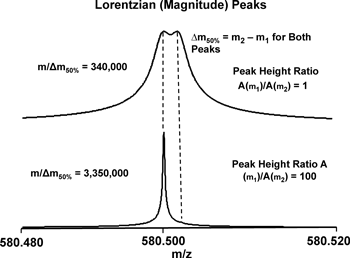
Fig. 3. Barely resolved pairs of Lorentzian magnitude-mode spectral peaks of equal width. Peak height ratio is 1 : 1 (top) and 100 : 1 (bottom). Note that the resolving power required to distinguish the peaks is ∼10 times higher for the 100 : 1 pair.
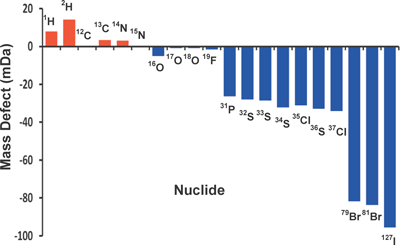
Every isotope of every element has a different mass defect (i.e., the difference between the exact mass of an atom (in Da) and the nearest integer), as shown in Fig. 4 for isotopes of some common elements. Thus, a unique elemental composition may be determined for any molecule from a sufficiently accurate mass measurement.27) For example, a mass resolution of ∼1 mDa suffices to achieve unique elemental composition assignment for essentially all possible elemental compositions, CcHhNnOoSs (as from petroleum crude oil) up to ∼500 Da.28)
Conditional averaging to reduce rms mass errorAs noted above, when direct infusion is available, it is desirable to sum many FT-ICR mass spectra to improve SNR and dynamic range. However, an ionization source may not necessarily produce the same number of ions each time. Because space charge shifts FT-ICR MS peak positions, any variation in ion number will degrade mass measurement accuracy and mass resolving power. We therefore introduced “conditional averaging.” Basically, the idea is to average only those mass spectra whose summed peak heights are the same to within a specified range (say, 10%). It is possible to reduce rms mass error by a factor of 2–3 by such conditional averaging.26)
Mass measurement error may be further reduced by adding a third term to the ICR frequency-to-m/z conversion (mass “calibration”) equation, and (for compositionally complex mass spectra) by separate calibration of multiple mass spectral segments.29) The combination of all of the above data treatments has been shown to reduce rms mass measurement random error to ∼25 ppb, and corresponding systematic error to ∼5 ppb (i.e., essentially negligible).29)
Isotopic fine structure for validation of elemental composition assignmentIt is widely appreciated that the confidence in assigning a monoisotopic elemental composition (mass, M) can be improved by accurate determination of the combined heights of unresolved isotopologue signals at (M+1) and (M+2).30) It is less widely understood that even higher confidence can follow from ultrahigh-resolution mass measurement of individual isotopologues, as shown in Fig. 5. For example, identification of the 34S isotopologue can unequivocally confirm the presence and number of 32S in the monoisotopic species.31)
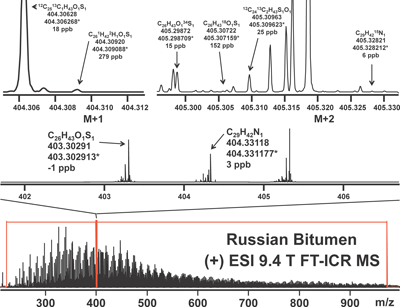
Fig. 5. (+) ESI 9.4 T FT-ICR mass spectra of a Russian bitumen. Bottom: Broadband (+) ESI 9.4 T FT-ICR mass spectrum (black) with a 4 Mword 10 MHz SWIFT excitation waveform overlaid (red). Middle: Mass scale-expanded segment for SWIFT-isolated ions, including assignment of two monoisotopic molecular formulas. Top: Mass scale-expanded segments for ions 1 or 2 Da higher in mass than the assigned monoisotopic ions. Appearance of the 18O and 34S isotopologues serves to validate the monoisotopic compositional assignments. Also note the detection of isotopologues containing 2H, 13C, or 15N.
We have recently described broadband phase correction32,33) to yield an absorption-mode FT-ICR mass spectrum, whose resolving power can be up to twice that for conventional magnitude-mode display.34) Moreover, close mass doublets partially or unresolved in magnitude mode may become resolved in absorption mode (see Fig. 6), thereby increasing the number of correctly assigned elemental compositions. Thus, the improvement in resolution based on absorption-mode display is not only quantitative; it can be qualitative (i.e., being able to assign a peak or not). Finally, the improvement due to phase correction is much greater near the baseline of the peak, where (e.g.) a Lorentzian magnitude-mode peak can be ten-fold wider than for absorption mode.
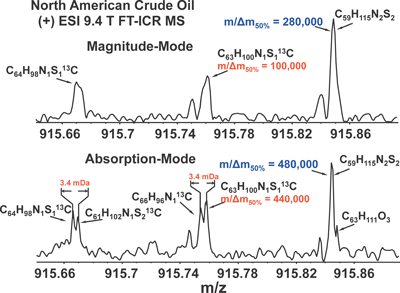
Fig. 6. Magnitude (top) and absorption (bottom) (+) ESI 9.4 T FT-ICR mass spectral segments for a North American petroleum crude oil. Note the absorption-mode resolution of three pairs of peaks (compositions differing by C3 vs. SH4, 0.0034 Da and H4N2S2 vs. C4O3, 0.0032 Da) that are unresolved in magnitude-mode display.
Acknowledgment
This work was supported by the National Science Foundation (DMR-06-54118; CHE-1016942; CHE-1019193), the Florida State University Future Fuels Institute, the BP/Gulf of Mexico Research Initiative, and the State of Florida.
REFERENCES
- 1) A. G. Marshall, C. L. Hendrickson, G. S. Jackson. Fourier transform ion cyclotron resonance mass spectrometry: A primer. Mass Spectrom. Rev. 17: 1–35, 1998.
- 2) R. P. Rodgers, A. G. Marshall. Petroleomics: Chemistry of the underworld. Proc. Natl. Acad. Sci. U.S.A. 105: 1–6, 2008.
- 3) S. G. Valeja, N. K. Kaiser, F. Xian, C. L. Hendrickson, J. C. Rouse, A. G. Marshall. Unit mass resolution for an intact 148 kDa therapeutic monoclonal antibody by FT-ICR mass spectrometry. Anal. Chem. 83: 8391–8395, 2011.
- 4) E. N. Nikolaev, R. M. A. Heeren, A. M. Popov, A. V. Pozdneev, K. S. Chingin. Realistic modeling of ion cloud motion in a Fourier transform ion cyclotron resonance cell by use of a particle-in-cell approach. Rapid Commun. Mass Spectrom. 21: 3527–3546, 2007.
- 5) F. E. Leach 3rd, A. Kharchenko, R. M. A. Heeren, E. N. Nikolaev, I. J. Amster. Comparison of particle-in-cell simulations with experimentally observed frequency shifts between ions of the same mass-to-charge in Fourier transform ion cyclotron resonance mass spectrometry. J. Am. Soc. Mass Spectrom. 21: 203–208, 2010.
- 6) G. Vladimirov, C. L. Hendrickson, G. T. Blakney, A. G. Marshall, R. M. A. Heeren, E. N. Nikolaev. Fourier transform ion cyclotron resonance mass resolution and dynamic range limits calculated by computer modeling of ion cloud motion. J. Am. Soc. Mass Spectrom. 23: 375–384, 2012.
- 7) M. B. Comisarow, A. G. Marshall. Fourier transform ion cyclotron resonance spectroscopy. Chem. Phys. Lett. 25: 282–283, 1974.
- 8) S. C. Beu, D. A. Laude, Jr. Open trapped ion cell geometries for FT/ICR/MS. Int. J. Mass Spectrom. Ion Process. 112: 215–230, 1992.
- 9) A. G. Marshall. Milestones in Fourier transform ion cyclotron resonance mass spectrometry technique development. Int. J. Mass Spectrom. 200: 331–336, 2000.
- 10) A. G. Marshall, C. L. Hendrickson. Fourier transform ion cyclotron resonance detection: Principles and experimental configurations. Int. J. Mass Spectrom. 215: 59–75, 2002.
- 11) I. A. Boldin, E. N. Nikolaev. Fourier transform ion cyclotron resonance cell with dynamic harmonization of the electric field in the whole volume by shaping of the excitation and detection electrode assembly. Rapid Commun. Mass Spectrom. 25: 122–126, 2011.
- 12) A. V. Tolmachev, E. W. Robinson, S. Wu, H. Kang, N. M. Lourette, L. Paša-Tolić, R. D. Smith. Trapped-ion cell with improved DC potential harmonicity for FT-ICR MS. J. Am. Soc. Mass Spectrom. 19: 586–597, 2008.
- 13) N. K. Kaiser, J. J. Savory, A. M. McKenna, J. P. Quinn, C. L. Hendrickson, A. G. Marshall. Electrically compensated FT-ICR cell for complex mixture analysis. Anal. Chem. 83: 6907–6910, 2011.
- 14) A. M. Brustkern, D. L. Rempel, M. L. Gross. An electrically compensated trap designed to eighth order for FT-ICR mass spectrometry. J. Am. Soc. Mass Spectrom. 19: 1281–1285, 2008.
- 15) G. Gabrielse, L. Haarsma, S. L. Rolston. Open-endcap Penning traps for high precision experiments. Int. J. Mass Spectrom. Ion Process. 88: 319–332, 1989.
- 16) E. N. Nikolaev, I. A. Boldin, R. Jertz, G. Baykut. Initial experimental characterization of a new ultra-high resolution FTICR cell with dynamic harmonization. J. Am. Soc. Mass Spectrom. 22: 1125–1133, 2011.
- 17) I. A. Boldin, E. N. Nikolaev. Theory of peak coalescence in Fourier transform ion cyclotron resonance mass spectrometry. Rapid Commun. Mass Spectrom. 23: 3213–3219, 2009.
- 18) G. Vladimirov, Y. Kostyukevich, A. G. Marshall, C. L. Hendrickson, G. T. Blakney, E. N. Nikolaev. In influence of different components of magnetic field inhomogeneity on cyclotron motion coherence at very high magnetic field. Proc. 58th Amer. Soc. Mass Spectrom. Annual Conf. on Mass Spectrometry & Allied Topics, Salt Lake City, UT, 23–27 May, 2010.
- 19) N. K. Kaiser, J. P. Quinn, G. T. Blakney, C. L. Hendrickson, A. G. Marshall. A novel 9.4 tesla FTICR mass spectrometer with improved sensitivity, mass resolution, and mass range. J. Am. Soc. Mass Spectrom. 22: 1343–1351, 2011.
- 20) M. W. Senko, C. L. Hendrickson, M. R. Emmett, S. D.-H. Shi, A. G. Marshall. External accumulation of ions for enhanced electrospray ionization Fourier transform ion cyclotron resonance mass spectrometry. J. Am. Soc. Mass Spectrom. 8: 970–976, 1997.
- 21) B. E. Wilcox, C. L. Hendrickson, A. G. Marshall. Improved ion extraction from a linear octopole ion trap: SIMION analysis and experimental demonstration. J. Am. Soc. Mass Spectrom. 13: 1304–1312, 2002.
- 22) A. G. Marshall, T.-C. L. Wang, T. L. Ricca. Tailored excitation for Fourier transform ion cyclotron resonance mass spectrometry. J. Am. Chem. Soc. 107: 7893–7897, 1985.
- 23) G. T. Blakney, C. L. Hendrickson, A. G. Marshall. Predator data station: A fast data acquisition system for advanced FT-ICR MS experiments. Int. J. Mass Spectrom. 306: 246–252, 2011.
- 24) L. Chen, C. E. Cottrell, A. G. Marshall. Effect of signal-to-noise ratio and number of data points upon precision in measurement of peak amplitude, position, and width in Fourier transform spectrometry. Chemom. Intell. Lab. Syst. 1: 51–58, 1986.
- 25) C. M. Yanofsky, A. W. Bell, S. Lesimple, F. Morales, T. T. Lam, G. T. Blakney, A. G. Marshall, B. Carrillo, K. Lekpor, D. Boismenu, R. E. Kearney. Multicomponent internal recalibration of an LC-FTICR-MS analysis employing a partially characterized complex peptide mixture: Systematic and random errors. Anal. Chem. 77: 7246–7254, 2005.
- 26) A. G. Marshall, G. T. Blakney, C. L. Hendrickson, A. M. McKenna, R. P. Rodgers. Fourier transform ion cyclotron resonance: The mass spectrometry zenith. New Alternatives in High-Resolution Mass Spectrometry Symp., Pittcon 2012, Orlando, FL, 11–15 March, 2012.
- 27) J. H. Beynon. Qualitative analysis of organic compounds by mass spectrometry. Nature 174: 735–737, 1954.
- 28) S. Kim, R. P. Rodgers, A. G. Marshall. Truly ‘exact’ mass: Elemental composition can be determined uniquely from molecular mass measurement at ∼0.1 mDa accuracy for molecules up to ∼500 Da. Int. J. Mass Spectrom. 251: 260–265, 2006.
- 29) J. J. Savory, N. K. Kaiser, A. M. McKenna, F. Xian, G. T. Blakney, R. P. Rodgers, C. L. Hendrickson, A. G. Marshall. Parts-per-billion Fourier transform ion cyclotron resonance mass measurement accuracy with a “walking” calibration equation. Anal. Chem. 83: 1732–1736, 2011.
- 30) T. Kind, O. Fiehn. Metabolomic database annotations via query of elemental compositions: Mass accuracy is insufficient even at less than 1 ppm. BMC Bioinformatics 7: 234, 2006.
- 31) S. D.-H. Shi, C. L. Hendrickson, A. G. Marshall. Counting individual sulfur atoms in a protein by ultrahigh-resolution Fourier transform ion cyclotron resonance mass spectrometry: Experimental resolution of isotopic fine structure in proteins. Proc. Natl. Acad. Sci. U.S.A. 95: 11532–11537, 1998.
- 32) S. C. Beu, G. T. Blakney, J. P. Quinn, C. L. Hendrickson, A. G. Marshall. Broadband phase correction of FT-ICR mass spectra via simultaneous excitation and detection. Anal. Chem. 76: 5756–5761, 2004.
- 33) F. Xian, C. L. Hendrickson, G. T. Blakney, S. C. Beu, A. G. Marshall. Automated broadband phase correction of Fourier transform ion cyclotron resonance mass spectra. Anal. Chem. 82: 8807–8812, 2010.
- 34) A. G. Marshall, M. B. Comisarow, G. Parisod. Relaxation and spectral line shape in Fourier transform ion cyclotron resonance spectroscopy. J. Chem. Phys. 71: 4434–4444, 1979.
- 35) V. V. Lobodin, R. P. Rodgers, A. G. Marshall. Analysis of complex organic mixtures by FT-ICR mass spectrometry. Petroleomics. In Comprehensive Environmental Mass Spectrometry (Ed.: A. Lebedev), ILM Publications, St. Albans, Hertfordshire, UK, pp. 415–442, 2012.