Abstract
Understanding of behavior of ion ensembles inside FT-ICR cell based on the computer simulation of ion motion gives rise to the new ideas of cell designs. The recently introduced novel FT-ICR cell based on a Penning ion trap with specially shaped excitation and detection electrodes prevents distortion of ion cyclotron motion phases (normally caused by non-ideal electric trapping fields) by averaging the trapping DC electric field during the ion motion in the ICR cell. Detection times of 5 min resulting in resolving power close to 40,000,000 have been reached for reserpine at m/z 609 at a magnetic field of only 7 Tesla. Fine structures of resolved 13Cn isotopic cluster groups could be measured for molecular masses up to 5.7 kDa (insulin) with resolving power of 4,000,000 at 7 Tesla. Based on resolved fine structure patterns atomic compositions can be directly determined using a new developed algorithm for fine structure processing. Mass spectra of proteins and multimers of proteins reaching masses up to 186 kDa (enolase tetramer) could be measured with isotopic resolution. For instance, at 7 Tesla resolving power of 800,000 was achieved for enolase dimer (96 kDa) and 500,000 for molecular masses above 100 kDa. Experimental data indicate that there is practically no limit for the resolving power of this ICR cell except by collisional damping in the ultrahigh vacuum chamber.
INTRODUCTION
The leading role Fourier transform ion cyclotron resonance mass spectrometry (FT-ICR MS) played for many years in analyses of very complex chemical mixtures like physiological liquids, tissue lisates, oil and humus, is directly related to its unsurpassed resolution and mass accuracy. Besides FT-ICR MS has the possibility of utilizing all known ionization and fragmentation methods. Improvement of resolving power and mass accuracy has been greatly facilitated by a detailed understanding of the behavior of ions during the whole cycle of mass spectrum measurement in FT-ICR mass spectrometry: ion introduction into the FT-ICR cell, excitation of their cyclotron motion, fragmentation and detection of induced signal. Starting from the early days of FTICR-MS the theory of ion motion in the ICR cell was an important research topic in this field. The dynamics of single particles inside the FTICR trap were analyzed by many groups in both the FTICR and physics communities.1–6) The FTICR community has been interested mainly in obtaining a calibration formula, which connects measured frequency with ion mass.7) The availability of the SIMION program8) simplified the task of understanding different aspects of single ion motion in cells of arbitrary geometry. This PC-based ion trajectory program is able to show single ion trajectories in different kinds of ICR cells with relatively high accuracy. The simulated time-scales are comparable with the time-scales of typical FTICR experiments. Because of the lack of appropriate ion–ion interaction routines SIMION fails in the study of the influence of Coulomb interaction and image charge on ion motion. FTICR-MS generally deals with ion clouds containing at least hundreds of ions rather than single particles. As a result the trajectory obtained from single ion simulations does not provide a realistic insight into the ion trajectories in the presence of other ions. In accurate mass measurements using ion traps single ions of different m/z are introduced into the cell consecutively. The first attempt to implement Coulomb interaction in realistic three-dimensional (3D) calculations of simulations involving a relatively small number of interacting particles was undertaken by the groups of Inoue and Nikolaev. They developed a 3D parallel code to integrate the equations of motion of up to 1,024 interacting particles for 50,000 time-steps.9,10) They used a parallel processing approach implemented on a supercomputer with up to 1,024 processors to calculate the time and space evolution of a single m/z ion cloud. These simulations took into account ion–ion interaction but neglected image charge effects. A different approach to this problem was used by Dale Mitchell and Richard Smith, who applied a 3D many particle simulator using a particle-in-cell (PIC) algorithm developed in plasma physics.5,11) This approach permits the incorporation of Coulomb ion–ion and ion–image charge interactions for an experimentally realistic number of ions in the cell. Later Nikolaev’s group has extended this particle-in-cell approach to allow for the simulation of many particle dynamics inside the FTICR cell on the basis of improved computational algorithms and using the most powerful computers available at this time.12,13) They have implemented the new 3D particle-in-cell code. The code can model a complete FTICR experiment with up to 106 coulombically interacting ions in the ICR cell for 10,000,000 time-steps. This new code allows for the simulation of almost any practical FT-ICR sequence and experimental conditions. In addition it can easily be extended to model other types of devices relevant to modern high-performance mass spectrometric studies.
To trap ions in FTICR-MS and measure their frequencies of cyclotron motion an ICR trap (Penning trap) is used. Ions are confined radially by the use of a strong magnetic field parallel to the axis of symmetry.14–16) Trapping potentials applied to trapping electrodes of the trap simultaneously confine the ions in a direction parallel to the magnetic field. A typical sequence of an FTICR-MS measurement consists of successive steps of ion accumulation in the ICR trap, damping ion axial motion (along magnetic field), excitation of the cyclotron motion, and signal detection by measuring the oscillating image charge induced on the detection plates. A radio-frequency (RF) voltage applied to a set of excitation plates (positioned parallel to the magnetic field and creating an RF electric field perpendicular to the magnetic field) excites the cyclotron mode during the excitation period. The image charge induced on an additional set of trap electrodes is detected as a decaying time-dependent signal during the detection period. A Fourier transform of this time-domain signal yields the cyclotron frequency spectrum containing the cyclotron frequency of the ions. The measured signal results from induced charge on the FT-ICR trap detection electrodes caused by synchronous motion of ions. Ion motion synchronization is produced by RF-sweep excitation of ion cyclotron motion and results in a separate, synchronous ion cloud for each m/z. It is well known that during excitation and detection, ions undergo complex three-dimensional motion. Only in electric field free space ions are rotating in magnetic field with pure cyclotron. For an ideal hyperbolic Penning trap, the motion in the plane perpendicular to the magnetic field is a combination of cyclotron and magnetron motions. Magnetron motion is induced by the radial component of the trap electric field and the axial magnetic field and is manifested as a modulation of the center of ion cyclotron rotation at a frequency typically ten thousand times smaller than the cyclotron frequency. Radial component of the trap electric field always presents in a Penning trap because of the presence of the trapping field along magnetic field, which according to Laplace equation should be accompanied by non-zero electric field in the orthogonal direction. In a hyperbolic trap and spatially homogeneous magnetic field, ions synchronized during cyclotron excitation continue to be synchronized indefinitely in the absence of collisions with neutrals and ion–ion interactions due to complete decoupling of cyclotron, magnetron, and axial oscillations. In an actual ICR trap, the three modes of motion are coupled and the cyclotron and magnetron frequencies depend on the axial oscillation amplitude, resulting in ion cloud dephasing and “comet” structure formation. Ion cloud dephasing results from accumulated phase difference in the measured (cyclotron minus magnetron) motion for ions with different z-oscillation amplitude in an ion cloud, which can be evaluated for any ion trap by calculating the radial electric field dependence on axial z-coordinate. After some time, the phase difference across the original cloud becomes 2π, corresponding to the head of the comet reaching the tail and resulting in complete loss of signal from the cloud. FT-ICR MS resolving power is proportional to the duration of synchronous motion and is, therefore, limited by the time needed for dephasing to take place, which depends on ion trap geometry and magnetic field homogeneity.
Higher magnetic field strength results in smaller difference in measured cyclotron frequencies of ions in each cloud and smaller rate of phase difference accumulation. In a cubic and cylindrical cells (in contrast to the cell with hyperbolic potential) at small ion number comet structures are formed leading to disappearance of the ICR signal after about 1 s at 1 T and 7 T12,13) corresponding to mass resolution in accordance with the expression for FT-ICR resolution as a function of observation period. In previous works,12,13) we have determined the dependence of minimum number N, of ions in the cloud for onset of coalescence on magnetic field strength B, cyclotron radius R, ion mass m, and difference between ion masses m2–m1, for two ion ensembles of different m/z and equal abundance, excited to the same nominal cyclotron radius. Empirical expressions for N as a function of each of the above listed experimental parameters have been obtained.13)
SIMULATION RESULTS
Computational methodIn the present supercomputer simulations we have used a previously developed computer code based on a PIC algorithm for calculation of electric forces acting on an individual ion in an ion cloud from other ions in the cloud, from the field of trap electrodes, and from image charges on these electrodes.12) Briefly, the whole space occupied by the cell was subdivided by the mesh. The ion density distribution is determined at every node of the mesh by dividing the total charge extrapolated to that particular node by the ions contained in the volume of each elementary cube of the mesh. By use of a direct fast Fourier transform (FFT) Poisson solver with the trap boundary conditions, corresponding to DC and RF potentials on the trap electrodes, the charge density on each grid point is converted into potentials at those points, and electric field is determined from the spatial derivatives of the potentials. The electric field at an individual ion position is calculated by interpolating the electric fields from the nearest grid points based on the same weighting algorithm as for charge projection to each grid point. The mathematical description of the whole procedure for solving the Poisson equation by the FFT method is described in ref. 12. The particle positions and velocities for the next time-step are calculated with the Boris integrator.11,12) For the simulation we used a 64×64×64 and 30×30×70 PIC grids for a 50.8×50.8×50.8 mm cubic cell and open cylindrical cell. The electrostatic field of the trap for an open cylindrical cell was calculated in SIMION 8. For the open cell a 150×150×350 SIMION mesh was used, which corresponds to a 75 mm×75 mm×175 mm simulation region (trap length 152 mm, trap diameter 60 mm). The number of time steps for one cyclotron period was 50 or 100 depending on the magnetic field strength. The number of stored snapshots per simulation was determined from the snapshot repetition rate, namely, after every 13,560 steps.
Ion cloud condensation. Comet structure formation at small number of ionsIn previous PIC-based simulations, “ion condensation” has been observed,13,14,18) resulting in formation of a compact elliptical ion cloud if the number of ions in the cloud is higher than some critical value. In a spatially homogeneous magnetic field, the condensation effect is not influenced by inhomogeneity of the trapping electric field, and enables high mass resolution even if the ion trap electric field deviates significantly from quadrupolar. Figures 1B and 1C show that for nonlinear electrostatic field ions condense to form a compact elliptical cloud when the number of ions reaches ∼10,000. Additional simulations17) show that the number of ions required for cloud stabilization depends linearly on nonlinearity approximation coefficient for electrostatic field of FT-ICR cell: e.g., Electrostatic field for open cell (Finnigan LTQ-FT geometry, without grid) and open cell with compensation rings could be approximated by:
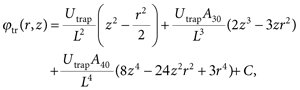 | (1) |
where L=7.5 cm, Utrap=1.31 V, A30=−0.008, A40=0.408 for FINNIGAN LTQ-FT open cell, and L=7.4 cm, Utrap=2.53 V, A30=6×10⁻⁴, A40=−0.1529 for PNNL open compensated cell.
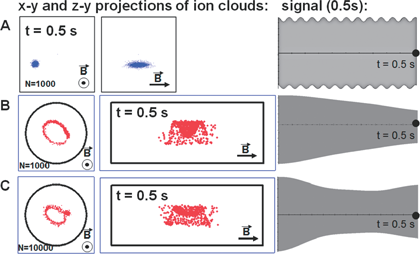
Fig. 1. x–y (left) and y–z (middle) projections of ion clouds taken at 0.5 s after excitation and time-domain ICR signals (right, 0.5 s of duration) m/z=500, at 7 T for (A)—1,000 singly charged ions in Quadrupolar trapping potential; (B) 1,000 singly charged ions (C) 10,000 singly charged ions in open ICR cell geometry (Finnigan LTQ-FT, without grid).
For condensation to take place in an open compensated cell for the same cyclotron radius as in an open cell without compensation around ∼5,000 ions are required. Compensation is also observed in the case of an inhomogeneous magnetic field. Figure 1A shows that in the case of quadrupolar electrostatic field and uniform magnetic field there is no destruction of ion cloud and comets formation. A more detailed analysis of ion trajectories obtained in the simulation shows that increase of number of ions in an ion cloud leads to dramatic effect on distribution of ion axial oscillation amplitude. As the total ion number increases the axial oscillation average amplitude slightly increases but the amplitude distribution width decreases. This leads to equalizing the effective cyclotron frequency of ions in ion cloud, and preventing comets formation.
Dynamic range limitations. The nature of upper and lower limitsAs was discussed in the introduction there are some phenomena caused by ion–ion interaction which leads to the limitation of resolving power. These phenomena are determined by space charge and depend on charge density. They considerably influence the dynamic range which is the ratio of maximal ion number to minimal ion number in the cell in conditions when we see long time domain signal without coalescence and pronounced frequency drift.
Dynamic range could be limited by (Fig. 2):
1) Minimal number of ions in a cloud that can be detected by used detection electronics.
2) Minimal number of ions in a cloud needed for its stabilization by coulomb interaction. This limitation is extremely important for cases of inharmonic electric field and inhomogeneous magnetic field.12,13,17)
3) Maximal ion number at which peaks of spectra do not coalesce.13)
4) Capacity of ICR cell determined by equality of coulomb repulsive force and trapping force of the cell.
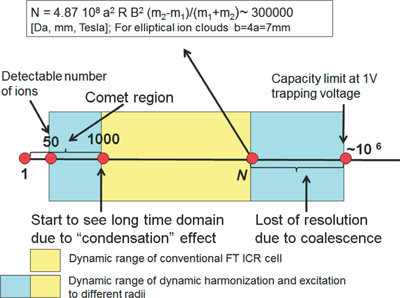
Fig. 2. Effects which are determining the dynamic range.
For typical experimental conditions the numbers given by limits 2 and 4 exceed the numbers given by limits 1 and 3 and so dynamic range is the ratio of maximal ion number at which peaks is spectra do not coalescent to minimal number of ions in a cloud needed for its stabilization by coulomb interaction.
How to shift lower limit of dynamic range to the limit of detection?Lower boundary of dynamic range determines the number of ions required for stabilization of ion cloud and preventing its destruction caused by inharmonic electric field and inhomogeneous magnetic field. Lower boundary of the dynamic range can be reduced to the detectable number of ion (approximately equal to 100 singly charged particles for broadband detection). To achieve that the electric field of ion trap must be equivalent to hyperbolic field. That may be achieved by using hyperbolic electrodes ion traps or by dynamic harmonization.18) The limitation of dynamic range caused by inhomogeneous magnetic field can be reduced in some mass range interval by using compensation of inhomogeneity of the magnetic field by electric field created from special electrodes.19) For most magnets the limitation of resolving power caused by inhomogeneity of the magnetic field is much weaker than limitation caused by inharmonic electric field. Simulations show that the faster is dephasing caused by inharmonic electric or inhomogeneous magnetic field, the more ions are needed to initialize “condensation” which stabilizes ion clouds and prevent dephasing.17)
How to shift the upper limit to the limit of cell capacity?To lift the upper limit of the dynamic range we need to prevent coalescence and small ion cloud destruction by bigger clouds of ions with close m/z ratio. Both these phenomena could be prevented by increasing the magnetic field and by the excitation of different m/z ions to different cyclotron orbits.20)
FT-ICR cell harmonizationComputer simulations demonstrate that the hyperbolic field is the best for achieving long time of synchronous ion motion and by this obtaining high resolving power. Making the electric field distribution inside the FT-ICR cell close to the field in a hyperbolic cell we call cell harmonization. The most effective approach to cell harmonization is based on the so-called dynamic harmonization of the electric field. Electric field formed by the set of shaped electrodes laying on the same cylindrical surface becomes hyperbolic after being averaged by the cyclotron motion. The principal design of such a cell was previously described in ref. 18 and is presented in Fig. 3.
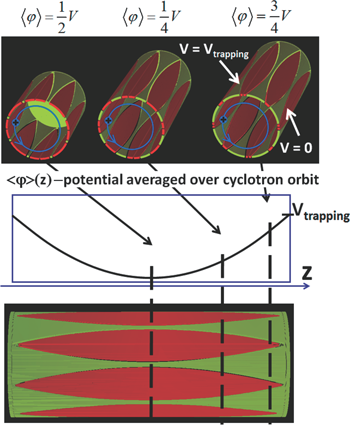
Fig. 3. Principle of electric field averaging in the dynamically harmonized FT-ICR cell with shaped excitation and detection electrodes.
EXPERIMENTAL RESULTS
MethodA dynamically harmonized cell used in our experiments is shown in Fig. 4. The inner surface of the end-cap electrodes was made spherical as this was easier to manufacture than a hyperbolic. The end-cap electrodes have orifices of 6 mm diameter in their centers. An additional electrode at the entrance of the cell is added here to provide focusing of incoming ions. On both end cap electrodes as well as the entrance lens a typical DC voltage of 1.5 V is directly applied during the detection sequence, the same DC voltage is applied to the convex electrodes of the cylindrical surface, while the concave electrodes remain grounded. During the injection of ions the entrance lens and the front end cap electrode are pulsed down to typically −10 V. Experiments were performed using a special ESI-Qh-FT-ICR mass spectrometer. An actively shielded 7 Tesla superconducting magnet (Bruker Biospin, Wissembourg, France) with a room temperature bore of 160 mm diameter was used. The mass spectrometer had an electrospray ion source, a quadrupole mass selector, a hexapole collision cell and a hexapole ion guide for transferring ions to the ICR cell. Ions were generated in the electrospray ion source (Apollo II) that contains a dual ion funnel system and a hexapole ion guide. Passing through the glass electrospray capillary with metallized ends ions entered into the first vacuum stage orthogonal to the ion funnels, i.e.; orthogonal to the transfer axis of the FT-ICR system. On their travel to the ICR cell, ions were accumulated in the collision cell. They were then extracted and transferred through the hexapole ion guide into the ICR cell in the center of the magnetic field.
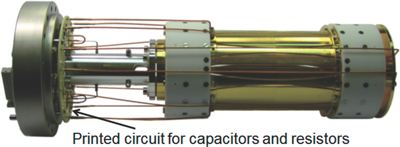
Fig. 4. View of ICR cell with dynamic harmonization (lab prototype). Gold plated copper, macor insulator. Printed circuit ceramic board as interface board instead of free wired elements.
This cell showed the highest resolving power ever achieved on peptides and proteins.21) The time of transient duration reaches 300 s for m/z= 609 (reserpine) and seems to be limited only by the vacuum inside the FT-ICR cell and magnetic field inhomogeneity.19) It was demonstrated on reserpine that it is possible to achieve a resolving power 39,000,000 (Fig. 5). With this cell we have resolved an 13C cluster isotopic structure of Enolase Tetramer with mass around ∼186,000 Da (Fig. 6). These results were obtained using superconducting magnets of very high homogeneity of the magnetic field. For magnets with lower homogeneity the time of transient duration should be smaller. We developed a method of compensation the inhomogeneity of the magnetic field by adding additional segments shaped by curve of 4-th order inside trapping electrodes it is possible to introduce a 4-th order correction to the field which can be used to compensate quadratic inhomogeneity of magnetic field.19)
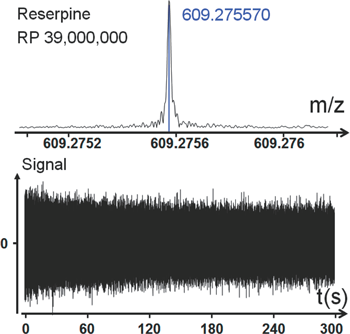
Fig. 5. Record resolution observed for FT-ICR with dynamically harmonized cell (lab prototype cell, 7 T magnet). (top) Mass-spectra; (down) Signal.
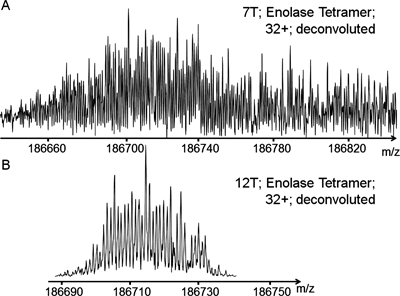
Fig. 6. Mass-spectra of isotopically resolved protein. FT-ICR cell with dynamic harmonization lab prototype version used (top) 7 T; (down) 12 T.
Acknowledgment
The authors gratefully acknowledge Ivan Boldin for drawing Fig. 3, Yury I. Kostyukevich, Alan G. Marshall, for their profound comments of various aspects of this work. E. N. and G. V. acknowledge the support from the Russian Foundation of Basic Research (Grant 10-04-13306, 12-08-31460), from the Russian Federal Program (state contracts 16.740.11.0369, No. 2012-1.2.1-12-000-1014-084), and from the Fundamental Sciences for Medicine Program of the Russian Academy of Sciences.
REFERENCES
- 1) E. N. Nikolaev, M. V. Gorshkov. Dynamics of ion motion in an elongated cylindrical cell of an ICR spectrometer and the shape of the signal registered. Int. J. Mass Spectrom. Ion Process 64: 115–125, 1985.
- 2) Y. Naito, M. Inoue. Peak confluence phenomenon in Fourier transform ion cyclotron resonance mass spectrometry. J. Mass Spectrom. Soc. Jpn. 42: 1–9, 1994.
- 3) D. W. Mitchell, R. D. Smith. Prediction of a space charge induced upper molecular mass limit towards achieving unit mass resolution in Fourier transform ion cyclotron resonance mass spectrometry. J. Mass Spectrom. 31: 771–790, 1996.
- 4) D. W. Mitchell, R. D. Smith. Two dimensional many particle simulation of trapped ions. Int. J. Mass Spectrom. Ion Process 165/166: 271–297, 1997.
- 5) D. W. Mitchell. Realistic simulation of the ion cyclotron resonance mass spectrometer using a distributed three-dimensional particle-in-cell code. J. Am. Soc. Mass Spectrom. 10: 136–152, 1999.
- 6) L. S. Brown, G. Gabrielse. Geonium theory: Physics of a single electron or ion in a Penning trap. G. Rev. Mod. Phys. 58: 233–311, 1986.
- 7) E. B. Ledford, Jr., D. L. Rempel, M. L. Gross. Space charge effects in Fourier transform mass spectrometry. Mass calibration. Anal. Chem. 56: 2744–2748, 1984.
- 8) D. A. Dahl. SIMION 3D Version 7.0 User’s Manual, 1995.
- 9) N. V. Miluchihin, K. Miura, M. Inoue. Application of a parallel computer to simulation of ion trajectories in an ion cyclotron resonance spectrometer. Rapid Commun. Mass Spectrom. 7: 966–970, 1993.
- 10) E. N. Nikolaev, N. V. Miluchihin, M. Inoue. Evolution of an ion cloud in a Fourier transform ion cyclotron resonance mass spectrometer during signal detection: Its influence on spectral line shape and position. Int. J. Mass Spectrom. Ion Process 148: 145–157, 1995.
- 11) R. W. Hockney, J. W. Eastwood. in Computer Simulation Using Particles, Adam Hilger, New York, p. 540, 1988.
- 12) E. N. Nikolaev, R. M. A. Heeren, A. M. Popov, A. V. Pozdneev, K. S. Chingin. Realistic modeling of ion cloud motion in a Fourier transform ion cyclotron resonance cell by use of a particle-in-cell approach. Rapid Commun. Mass Spectrom. 21: 3527–3546, 2007.
- 13) G. Vladimirov, C. L. Hendrickson, G. T. Blakney, A. G. Marshall, R. M. Heeren, E. N. Nikolaev. Fourier transform ion cyclotron resonance mass resolution and dynamic range limits calculated by computer modeling of ion cloud motion. J. Am. Soc. Mass Spectrom. 23: 375–384, 2012.
- 14) M. B. Comisarow, A. G. Marshall. Fourier transform ion cyclotron resonance spectroscopy. Chem. Phys. Lett. 25: 282–283, 1974.
- 15) A. G. Marshall, F. R. Verdun. in Fourier Transforms in NMR, Optical and Mass Spectrometry: A User’s Handbook, Elsevier, Amsterdam, p. 450, 1990.
- 16) A. G. Marshall, C. L. Hendrickson, G. S. Jackson. Fourier transform ion cyclotron resonance mass spectrometry: A primer. Mass Spectrom. Rev. 17: 1–35, 1998.
- 17) G. Vladimirov, Y. Kostyukevich, A. G. Marshall, C. L. Hendrickson, G. T. Blakney, E. N. Nikolaev. Ion cloud stabilization via ion–ion interactions for various ICR cell imperfection levels with inhomogeneous magnetic and inharmonic electric fields. Proc. 59th Amer. Soc. Mass Spectrometry Conf. on Mass Spectrometry & Allied Topics, Denver, Colorado, 4–9 June, 2011, Poster MP102.
- 18) I. A. Boldin, E. N. Nikolaev. Fourier transform ion cyclotron resonance cell with dynamic harmonization of the electric field in the whole volume by shaping of the excitation and detection electrode assembly. Rapid Commun. Mass Spectrom. 25: 122–126, 2011.
- 19) Y. I. Kostyukevich, G. N. Vladimirov, E. N. Nikolaev. Dynamically harmonized FT-ICR cell with specially shaped electrodes for compensation of inhomogeneity of the magnetic field. Computer simulations of the electric field and ion motion dynamics. J. Am. Soc. Mass Spectrom. 23: 2198–2207, 2012.
- 20) N. K. Kaiser, J. J. Savory, A. M. McKenna, C. L. Hendrickson, A. G. Marshall. Tailored ion spatial distribution in FT-ICR MS for improved analysis of complex mixtures. Proc. 57th ASMS Conf. on Mass Spectrometry and Allied Topics, Salt Lake City, 2010.
- 21) E. N. Nikolaev, I. A. Boldin, R. Jertz, G. Baykut. Initial experimental characterization of a new ultra-high resolution FTICR cell with dynamic harmonization. J. Am. Soc. Mass Spectrom. 22: 1125–1133, 2011.