Original Article
Determination of Niacin and Its Metabolites Using Supercritical Fluid Chromatography Coupled to Tandem Mass Spectrometry
2014 年 3 巻 1 号 p. A0029
詳細
2014 年 3 巻 1 号 p. A0029
Niacin, a water-soluble vitamin belonging to the vitamin B group, has been known to cause various problems in the human body when deficient. The vitamin is derived from the diet and afterwards, niacin and its metabolites are secreted in blood or urine. It can be analyzed using liquid chromatography (LC) coupled to mass spectrometry, but niacin and its metabolites are very polar compounds. Recently, supercritical fluid chromatography (SFC) is gaining attention for polar compound analysis. To our best knowledge, the report on the analysis of endogenous-very hydrophilic metabolites in biofluids by SFC has not been found. In this study, we investigated whether the separation of hydrophilic metabolites in biofluids is achievable by SFC. In addition, we also examined the applicability of SFC coupled to MS in extrapolating unknown metabolites by means of spectra information. As a result, an analysis method to quantify the target compounds using SFC/MS/MS was constructed for niacin and its metabolites. Additional putative metabolites from niacin were also identified using the MS fragmentation spectra in plasma and urine. Consequently, the method using SFC/MS/MS allowed for the analysis of polar compounds with low log P ranging from −3.7 to 0.29. This study is the first report of the separation of niacin and its seven metabolites in human urine and these results showed that SFC-MS/MS can be an alternative technique for hydrophilic metabolite analysis.
Supercritical fluid chromatography (SFC) was first introduced in 1962,1) and has recently been gaining popularity since the launch of new instruments to the marketplace. SFC employs supercritical or subcritical fluid, which sets the temperature and/or pressure above or near its critical points of CO2 in the mobile phase. In other words, the use of supercritical or subcritical CO2 in SFC brings low density and high diffusivity,2) resulting in the improvement of resolution and throughput in the separation. In addition, SFC offers additional benefits due to the polar diversity of the mobile phase. For example, supercritical CO2 itself is non-polar and the polarity is similar to n-hexane.3) SFC can be tunable using two different approaches. The first approach is by controlling the temperature and pressure,4–6) and the second one is by mixing other solvents with CO2 because supercritical/subcritical CO2 is miscible with polar solvents, such as methanol and acetonitrile, as well as acid, base or water. This means that the polarity of the mobile phase can be changed from non-polar like n-hexane to polar like methanol. Once the target compounds are retained on a column, the elution is controllable within the elution power scope of the mobile phase. Therefore SFC is applicable to not only hydrophobic but also hydrophilic compound analysis, and the applicability to polar compound analysis is one of the reasons why the technique recently is gaining more attention.7,8) Additionally, several reports indicated that SFC is applicable for practical use in metabolite analysis.9–13) However, there is no reported application of SFC focusing on hydrophilic metabolite analysis of biofluids.
Niacin belongs to the vitamin B group which is metabolized through different pathways, and transformed into other forms.14,15) These metabolites are involved in critical reactions in the body such as cellular oxidation-reduction reactions, DNA repair, calcium mobilization, and deacetylation,15,16) in which deficiency in niacin causes health issues in our body.17) In addition, it is known that niacin possess the ability to elevate high density lipoprotein (HDL) levels while reducing levels of total cholesterol, low density lipoprotein (LDL), triglycerides and lipoprotein (a).18) Moreover, the recent result on HPS2-THRIVE reported that the addition of extended release niacin/laropiprant to simvastatin increased the risk of myopathy in patients at high risk of vascular events although the cause remains uncertain.19)
For the determination of niacin and its metabolites secreted in blood or urine, liquid chromatography (LC) can be used to analyze niacin and its metabolites. Due to their hydrophilic properties, the use of HILIC, RP ion-pair and normal phase mode are preferred instead of reversed phase mode.20,21) However, there are no previous reports of the analysis using SFC even though SFC can be an alternative tool for hydrophilic metabolite analysis.
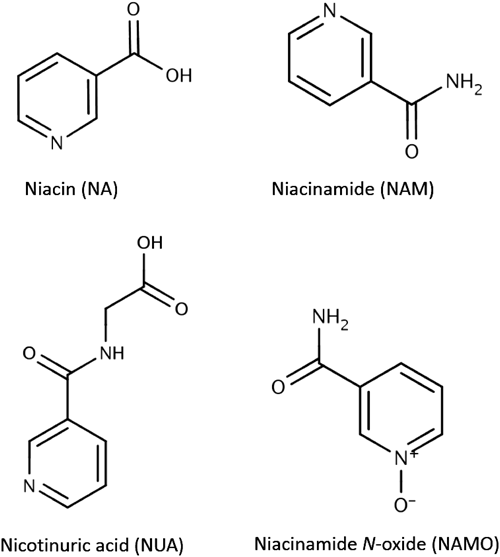
The goal of this study is to investigate the applicability of SFC coupled to MS to hydrophilic metabolite analysis. First, we developed an analytical method for niacin and its metabolites using SFC coupled to electrospray-tandem mass spectrometry (ESI-MS/MS). Secondly, the method was applied to rabbit plasma and human urine for the quantification of the target compounds shown in Fig. 1.
Also we attempted to extrapolate unknown metabolites in plasma and urine samples using the fragmentation spectra obtained in the analysis. Consequently we used these results to determine the practicality of using SFC/MS for hydrophilic metabolite analysis.
Methanol (optima LC/MS) was purchased from Fisher Scientific (Pittsburg, PA). Formic acids (88%, certified ACS), ammonium formate (LC/MS), niacin (NA), nicotinamide (NAM), nicotinamide N-oxide (NAMO), and nicotinuric acid (NUA) were purchased from Sigma-Aldrich (St. Louis, MO). Carbon dioxide (medical grade), which was used as the mobile phase in SFC, was purchased from Airgas, Inc. (Radnor, PA). De-ionized water was prepared by a Milli-Q system (Millipore, MA).
SFC/MS/MS analysisSFC/MS/MS analysis was performed using an ACQUITY Ultra Performance Convergence Chromatography (UPC2) system (Waters, Milford, MA) with a Xevo TQD tandem mass spectrometer (Waters). The SFC system was equipped with a convergence manager which controls backpressure, binary solvent manager, temperature-controlled column manager and fixed loop sample manager. The MS was equipped with an ESI source. The flow was split to MS and convergence manager after a column so that supercritical fluid conditions of CO2 can be maintained. The final SFC conditions for the analysis were as follows: mobile phase A, CO2; mobile phase B, methanol/water (95/5, v/v) with 0.1% (w/v) ammonium formate and 0.15% (v/v) formic acid; column, ACQUITY UPLC HSS Cyano (Waters, 3.0×50 mm, particle size: 1.8 μm); injection volume, 1 μL; flow rate, 1.6 mL/min; temperature of column manager, 40°C; temperature of sample manager, 8°C; active back pressure regulator (ABPR), 20.68 MPa. The MS analysis conditions were as follows: capillary voltage, 0.4 kV; desolvation temperature, 600°C; cone gas flow rate, 50 L/h; desolvation gas flow rate, 1200 L/h. The dwell time was 0.022 ms for each analysis. Multiple reaction monitoring (MRM) was employed in this study. The SFC/ESI-MS/MS system was controlled by MassLynx version 4.1 (Waters). MassLynx version 4.1 equipped with application manager TargetLynx was used for acquisition, processing, and calibration of the SFC/ESI-MS/MS data.
Sample preparationStandard stock solutions were prepared by dissolving each compound in methanol. A series of standard mixtures of varying concentrations was prepared by spiking known concentrations of the analytes into the blank matrixes. 100 μL of rabbit plasma and human urine were added into 300 μL of methanol. After vortexing, the mixtures were centrifuged at 13,000×g for 10 min to get the supernatant. The supernatant of urine was diluted 50-fold with methanol.
NA and its metabolites were detected in positive mode (Table 1).
| Target analytes | Selected ion | Precursor ion (m/z) | Product ion (m/z) | Dwell (s) | Cone (V) | Collision (V) |
|---|---|---|---|---|---|---|
| NAM | [M+H]+ | 123 | 80 | 0.022 | 45 | 24 |
| NA | [M+H]+ | 124 | 80 | 0.022 | 45 | 24 |
| NAMO | [M+H]+ | 139 | 106 | 0.022 | 45 | 28 |
| NUA | [M+H]+ | 181 | 135 | 0.022 | 45 | 30 |
The transition of NA, NAM, and NUA in MRM was the same as previous reports using LC-MS.14,17,21) In other words, any change of fragmentation pattern was not observed in the method using SFC. Using the method, rabbit plasma and human urine were quantified as shown in Tables 2 and 3, respectively.
| Target analytes | RT (n=5) | Concentration (n=5) | Linearity | ||
|---|---|---|---|---|---|
| Ave.±S.D. (min) | Conc.±S.D. (ng/mL) | RSD (%) | R2 | Range (ng/mL) | |
| NAM | 1.21±0.00 | 50.9±1.29 | 2.5 | 0.9987 | 1–200 |
| NA | 1.48±0.00 | 19.3±0.21 | 1.1 | 0.9994 | 1–100 |
| NAMO | 1.55±0.01 | 27.6±0.71 | 2.6 | 0.9993 | 1–300 |
| NUA | ND | ND | ND | 0.9980 | 1–100 |
| Target analytes | RT (n=5) | Concentration (n=5) | Linearity | ||
|---|---|---|---|---|---|
| Ave.±S.D. (min) | Conc.±S.D. (ng/mL) | RSD (%) | R2 | Range (ng/mL) | |
| NAM | 1.20±0.00 | 1.4±0.05 | 3.8 | 0.9984 | 0.4–200 |
| NA | 1.50±0.00 | 24.7±0.38 | 1.6 | 0.9992 | 0.2–100 |
| NAMO | 1.55±0.00 | 0.6±0.15 | 27.1 | 0.9981 | 0.6–300 |
| NUA | 1.66±0.00 | 637.7±13.08 | 2.1 | 0.9989 | 1–1000 |
Although NUA was not detected in rabbit plasma, all other analytes were found in the samples with retention time standard deviation of <0.01 min. While the standard deviation of concentration varied from 0.15 to 13.08 ng/mL, the % RSD was less than 3.8% except for NAMO in human urine sample. The standard curves were observed to be linear in the range with a correlation coefficient of >0.998 for each analyte as shown in Tables 2 and 3.
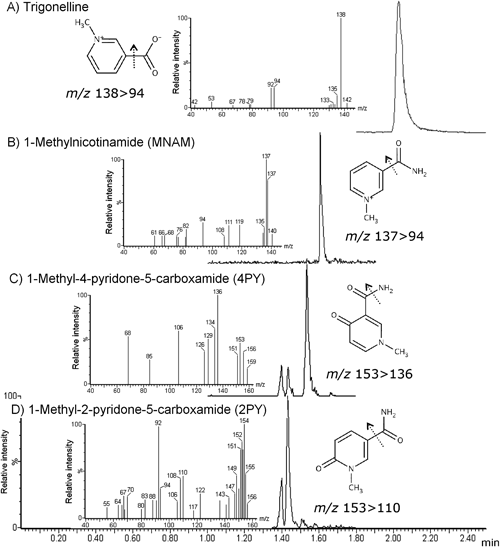
In addition to the quantified analytes, other metabolites were observed in the biofluid samples when it was analyzed in MS scan mode. Based on the observed m/z, we ran product ion scan and obtained the ion spectra. Comparing the obtained information with KEGG (http://www.genome.jp/kegg/), HMDB (http://www.hmdb.ca/) and a previous study,17) we identified the following putative metabolites of NA; 1-methyl-2-pyridone-5-caroxamide (2PY), 1-methyl-4-pyridone-5-carvoxamide (4PY), 1-methylnicotinamide (MNAM), and trigonelline (Fig. 2). As shown in Fig. 3, three (NAM, MNAM, and NAMO) and seven (NAM, MNAM, NAMO, 2PY, 4PY, NUA, and trigonelline) metabolites of NA were found in the rabbit plasma and human urine sample, respectively.
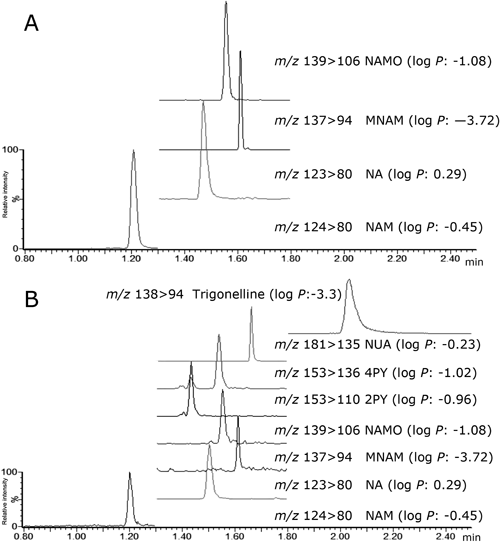
To achieve peak top separation in NA and its 7 metabolites, the modifier was changed from 2% B to 20% B for 1.2 min, followed by an incremental increase to 50% B for 0.1 min. The modifier composition was then held at 50% B for 0.7 min, and returned to the initial condition of 2% B for 0.2 min. Consequently, the method separated niacin and seven metabolites with low log P ranging from −3.72 to 0.29.
The established method based on SFC/MS/MS was successfully applied to biofluids such as rabbit plasma and human urine. The SFC system was able to quantify metabolites of NA that were very hydrophilic with negative log P values. This result indicated that SFC can be useful for the analysis of hydrophilic compounds in biofluids. Aside from quantification, this method also enabled putative metabolite identification of 2PY, 4PY, MNAM, and trigonelline. As a result, niacin and seven metabolites were separated simultaneously. To the best of our knowledge, this is the first report describing the chromatographic separation of niacin and seven metabolites. Consequently, these results demonstrate that the SFC/MS/MS system can be a powerful tool for hydrophilic compound analysis and applicable to hydrophilic metabolite analysis for putative metabolite identification.
This work was partially supported by the Development of Systems and Technology for Advanced Measurement and Analysis Project (JST).