METHODS
The development of a workflow approach for CASMI 2013 entries involved pre-processing the challenge data files, creating query files for batch processing with MetFrag and MetFusion with multiple databases for a broader chemical coverage, then filtering and joining the results to automatically create the submission files. Each run of the workflow aimed to produce valid submission files and additional constraints were added progressively following manual inspection of the intermediate results. Several checks were also added to ensure that the individual steps of the process did not return wrong or incomplete results, in an “agile programming” approach.
Challenge data and pre-processingThe challenge data for 2013 came from a variety of instruments with different accuracies, isolation windows and various measurement phenomena in the MS1 and MS/MS files. The instruments (written as {challenge numbers} instrument, ionisation, polarity abbreviation) were: {1–3} LCMS-IT-TOF, ESI+; {4,5,9,10} LTQ Orbitrap Velos, nano-ESI+; {6} APEX-II FT-ICR, ESI-; {7,8} Xevo QTOF, ESI+; {11,12} LC-IT-TOF, ESI-; {13} AXIMA QIT MALDI+; {14} LCMS-IT-TOF, APCI+; {15} Exactive Orbitrap and Xevo TQ, ESI+; {16} Exactive Orbitrap and Xevo TQ, ESI-. Additional information was also provided for some challenges and, where possible, this was included in the automatic methods as indicated below. More details on the measurements and the additional information are available elsewhere.5,6)
A degree of pre-processing was necessary to apply a consistent workflow on the files, while different parameters were necessary for the different challenges to take full advantage of highly accurate data when it was available. As neither MOLGEN-MS/MS nor MetFrag/MetFusion account for isotope patterns in the MS/MS, unequivocally identifiable isotope peaks were removed from the MS/MS files (Challenges 1 & 2, 4–6, 9, 11, 14–16) to avoid incorrect formula/fragment assignment to isotope peaks, especially problematic for MS/MS where e.g. the error is greater than the mass difference between 13C and 1H. Several MS1 files contained additional peaks which affect MS match scores in MOLGEN-MS/MS and these files were trimmed to the precursor and associated isotope peaks (Challenges 3–5, 15 & 16). For Challenges 15 and 16, three MS1 (high mass accuracy, at various collision energies) and two MS/MS files (unit mass accuracy only) were provided for each challenge. As the workflow was designed for accurate mass data, the high accuracy fragments from the MS1 files were merged (within 15 ppm error, retaining the peak of maximum intensity) and scaled (to 1,000 for both files, pre-merging) to create MS/MS files for submission calculations for these two challenges, without consideration of the unit mass accuracy peaks.
Category 1: Molecular formulaThe pre-processed, tab-separated MS1 and MS/MS text files were used as input for MOLGEN-MS/MS with the existence filter “exist,” accounting for odd and even ions, reporting ring and double bond counts (RDB) in the results. Calculations were performed for [M+H]+ (Challenges 1–5, 9 & 10, 16) or [M−H]− (Challenges 6, 11 & 12, 15). Formulas were provided in the challenge data for Challenges 7 & 8 and 13 & 14. The mass accuracy settings for MS1 (“ppm”) and MS/MS (“acc”) formula fitting, both in ppm, were (written as {challenge number(s)} ppm&acc: {1–3} 10&10; {4} 5&10; {5} 3&10; {6} 3&5; {9} 5&25; {10,15,16} 5&15; {11,12} 10&30. The results were sorted by the combined match value, except Challenge 15 which was sorted by MS/MS match value as no isotope peaks were present in the MS1.
Generally, the challenges were calculated with the elements C, H, N, O, P and S (hereafter abbreviated to CHNOPS), although additional restrictions were added according to information provided for certain challenges6) or as a result of manual inspection of the MS1 data and intermediate results files. Challenge 1 and 2 formulas were filtered according to RDB≧4 (additional information “aromatic structures present”6)), while Challenge 3 formulas were filtered according to C, N and O>1 and RDB≧1 (additional information “amide bonds present”6)). Elements for formula calculations were restricted for Challenges 9 (5–15 C, 3 Cl), 10 (30–50 C) and 16 (5–20 C, 9–100 H, O>2) using information from the MS1 and MS/MS. For Challenge 15, the ppm error in the MS/MS was used to separate formula scores, with MS/MS peak scores scaled linearly from 1 to 0 between 5 and 15 ppm (all better than 5 ppm with score 1, all outside 15 ppm rejected completely). A detailed explanation of the parameters in MOLGEN-MS/MS is available elsewhere.7,14) For the submissions, the Category 1 results were cross-checked with MetFrag results calculated with an exact mass search and no element restrictions to see if any high-scoring candidates with additional formulas were present.
For this manuscript, the molecular formula of all structural candidates were extracted from the MetFrag candidate lists (via the InChI), together with the highest score per candidate with the given formula. The formulas were then ranked according to the score. These calculations were performed for MetFrag using exact mass searches without any element restrictions, MetFrag exact mass searches restricted to compounds containing CHNOPS and also MetFusion exact mass searches restricted to elements CHNOPS except for Challenges 9, 15, and 16 (no restriction). These results were then summarised across the databases to be comparable with the joined datasets from Category 2. For the purpose of concise display in this manuscript, the exact mass search without element restrictions will be hereafter represented as CHNOPS=F (where F stands for false) and with element restrictions as CHNOPS=T (where T stands for true), consistent with the MetFrag and MetFusion settings.
Category 2: Structural formulaMetFrag and MetFusion were used to retrieve candidate structures from the compound databases PubChem,10) ChemSpider11) and KEGG12) for submission as Category 2 entries. The MetFrag parameters consisted of the exact mass of the precursor ion (to search the databases within the error given, “ppm”) and the peak list retrieved from the challenge data (for in silico fragmentation, within the given ppm (parameter “mzppm”) and absolute boundaries (parameter “mzabs,” in Da)). The parameters per challenge (written as {challenge numbers} ppm&mzppm&mzabs) were as follows: {1–3,7,8,11–14} 10&10&0.005; {4,5,9,10,15,16} 5&5&0.001; {6} 3&3&0.001. The in silico fragmentation was performed up to a tree depth of two. The ionization mode and charge were set for [M+H]+ or [M−H]− as listed for Category 1. Further details about MetFrag and the scoring are given in Wolf et al.8) For challenges where the molecular formula was provided (Challenges 7, 8, 13 and 14) and where one formula was clear from the Category 1 results (Challenges 3, 4 and 9), the MetFrag candidate retrieval was performed using the formula instead of the exact mass.
MetFusion combines the in silico fragmentation approach of MetFrag with spectral database searching.9) The parameters for the MetFrag part of MetFusion were as described above. The spectrum search in MassBank required additional parameters. The list of instruments consisted of all ESI and additionally selected APCI and APPI instruments currently available in MassBank,15) including 21 different combinations of QqQ, QTOF, IT and ITFT instruments. The ionization mode used in the spectrum search was chosen according to the information given with the challenges. The relative intensity cut-off was set to the MassBank default of 5, indicating that peaks with a relative intensity below that value are not examined in the peak matching algorithm of the spectrum search. MetFusion was set to limit the MassBank result list to 200 entries, which in general does not eliminate reference spectra that would improve the results. The database search was performed on the Japanese MassBank server. Both MetFrag and MetFusion kept all results from the compound database for a given query, only removing charged or disconnected compounds (e.g. salts). The candidates of the result lists obtained were filtered based on the first part of their InChI Key, to remove multiple stereoisomers of a given molecule (treated as equal in terms of MS).9)
Additional submissions with different strategies were created for this manuscript. To assess the effect of database joining, candidate lists obtained from individual databases were evaluated separately, while all challenges were re-run with and without element restrictions to assess the formula filtering applied and, especially for Challenges 15 and 16, to generate results retrospectively that contained the correct candidate. Otherwise the settings and scoring were identical to the contest submissions.
Post-processingAfter generating MetFrag and MetFusion batch query files for the individual databases, the results were joined to create the final submissions. All manipulations and plots were performed with scripts in the statistical language R,16) using the CDK,17) rCDK18) and OpenBabel19) for cheminformatics functionality. The database results were joined using the first block of the InChI Key, taking the highest scoring candidate from all databases. Charged structures that arose during post-retrieval interconversions were detected and removed (all structures containing “/[p or q][+ or −][0–9]” entries, e.g. “/p+1” at the end of the InChI string). For challenges where more than one possible formula was selected based on the MOLGEN-MS/MS results (Challenges 1, 2, 5, 15 and 16), the candidate structures were selected via the formula part contained at the front of the InChI string. The results, including additional calculations in this manuscript, were evaluated using the procedure from CASMI 2012,1) specifically including the concept of “worst case rank” to evaluate candidates with equal scores. The worst case rank is the total of all candidates with better and equal scores compared with the correct candidate, so if an entry contains 5 candidates with higher scores and 2 additional candidates with the same score as the correct candidate, the best case rank would be 6 and the worst case rank 8.
To facilitate the assessment of the scored candidate lists, a hierarchical clustering based on the chemical similarities between candidates was performed. This representation allows a quick assessment of structural similarity, as well as indicating whether clusters contain only individual candidates, or several consistently high-scoring candidates. In addition, the maximum common substructure (MCSS) of all candidates contained in a cluster provided information about the scaffold of the candidates. Additional visualisations included 1) the structural “distance” between the correct solution and the top ranking candidates, represented by the Tanimoto similarity,1) 2) the overlap of the MCSS from each cluster and the correct solution using AMBIT20) and 3) the peaks of the MS/MS spectrum explained by MetFrag overlaying the experimental spectrum. The resulting plots are given in the Supporting Information (SI), merged and numbered sequentially per challenge, as well as for selected challenges below. Explanations to assist interpreting the plots can be found on the first page of the SI.
RESULTS AND DISCUSSION
Category 1The calculations for MOLGEN-MS/MS were generally very quick and were under 1 s for all challenges except Challenges 15 (2 s), 6 (94 s) and 10 (1,027 s) on an Intel® Core™ i5 CPU M560 with 4 GB memory. However, the results for Category 1 reflected the difficulty of using a purely combinatorial approach in molecular formula determination for compounds with large masses. These are summarised in Table 1 (column “Cat. 1 Entries”), along with the precursor m/z and the formula. The results with MOLGEN-MS/MS were generally good (rank 1 or 2) for compounds with small m/z precursors, but no longer competitive for larger m/z values where other CASMI participants with different approaches outperformed MOLGEN-MS/MS.5,6) The winner of Category 1 ranked the correct formula in first place for all challenges.
Table 1. Summary of Category 1 data and results, including the CASMI 2013 MOLGEN-MS/MS submissions and retrospective entries compiled using MetFrag and MetFusion with exact mass searches with (CHNOPS=T) or without (CHNOPS=F) element restrictions. Results are Rank (Total Candidates).
| Chal. | Precursor m/z* | Formula | MOLGEN-MS/MS Entries | MetFrag CHNOPS=F | MetFrag CHNOPS=T | MetFusion CHNOPS=T/F |
|---|
| 1 (+) | 314.1364 | C18H19NO4 | 2 (11) | 1 (44) | 1 (13) | 1 (13) |
| 2 (+) | 265.1524 | C14H20N2O3 | 1 (2) | 1 (13) | 1 (7) | 1 (7) |
| 3 (+) | 301.1843 | C13H24N4O4 | 1 (3) | 1 (21) | 1 (9) | 1 (9) |
| 4 (+) | 211.1121 | C15H14O | 1 (4) | 1 (6) | 1 (4) | 1 (4) |
| 5 (+) | 291.0719 | C12H18O4S2 | 1 (9) | 4 (46) | 1 (10) | 1 (10) |
| 6 (−) | 935.6224 | C49H93O14P | 8 (144) | 1 (9) | 1 (9) | 1 (7) |
| 9 (+) | 349.9337 | C9H11Cl3NO3PS | 1 (6) | 1 (16) | − (0) | − (0)/1 (15) |
| 10 (+) | 922.5351 | C42H71N11O12 | 45 (283) | 3 (10) | 3 (7) | 1 (3) |
| 11 (−) | 337.1080 | C20H18O5 | 4 (41) | 1 (55) | 1 (21) | 1 (21) |
| 12 (−) | 269.0449 | C15H10O5 | 9 (27) | 2 (40) | 2 (12) | 1 (12) |
| 15 (−) | 462.9974 | C10H5F17O | − (177) | 22 (105) | − (10) | − (7)/1 (69) |
| 16 (+) | 362.1527 | C18H20FN3O4 | − (6) | 4 (51) | − (12) | − (15)/1 (56) |
*Exact mass of ion (i.e., [M+H]+ or [M−H]−).
Pre-submission, the MOLGEN-MS/MS results were cross-checked with preliminary Category 2 results using MetFrag with an exact mass search to see if any high-scoring candidates had different formulas to those proposed by MOLGEN-MS/MS, which could indicate that the element restrictions used were incorrect. These results are shown in the fifth column of Table 1, sorted using the highest-scoring candidate in the MetFrag results list with the given formula. The correct formulas for Challenges 15 and 16 were ranked 22nd and 4th, respectively, and as a result, F-containing formulas were not considered for these challenges (incorrectly in hindsight). In 9 of 12 challenges, taking the highest-scoring MetFrag candidate per formula to rank the formula resulted in an equal or better rank than that achieved with MOLGEN-MS/MS. Challenge 5 was an exception, however restricting the elements to C, H, N, O, P and S only (6th column of Table 1) resulted in likewise 9 of 12 challenges with equal or better results than MOLGEN-MS/MS, but losing the correct formulas for Challenges 9, 15 and 16, which all contained halogens. The retrospective results were more remarkable with MetFusion. If the Category 1 submissions had been made using the formula from the top scoring MetFusion candidates, all challenges would have had the correct formula ranked in first place, including no element restrictions for Challenges 9, 15 and 16. This is shown in the last column of Table 1.
In retrospect, a workflow approach for unknown identification on the basis of database queries may be performed efficiently using an exact mass search with post query formula filtering to ensure that all possible candidates are captured and considered. However, the drawback of such an approach is that database queries, even of large databases, will never ensure 100% coverage of chemical space and thus the results of formula generation should not be discounted completely. To demonstrate this, if only KEGG was used for the database queries, 8 of the 12 formulae would have been correctly ranked 1st, but the remaining 4 challenges would have had no candidate formulae. Thus, true non-target identification will always require formula calculation to ensure that the results are not only restricted to database entries.
Category 2The results submitted for CASMI 2013 in Category 2 are shown in Table 2. The calculation times for MetFrag and MetFusion per challenge, including database retrieval, ranged from less than one minute for challenges with few candidate structures up to 30 min for challenges with several thousand candidates. The run time depends on many factors such as the speed of the online query, settings, number of candidates and fragments to match as well as the system configuration. The post-processing took just under 6 hrs for all challenges at this conceptual stage, with interconversions between representations the most time-consuming. Calculations were performed on a computing server, equipped with two 6176 AMD Opteron™ Processors (24 cores) and 96 GB RAM for efficient parallel computations and multi-user configuration.
Table 2. Category 2 results as submitted using database joining, compared with MetFrag & MetFusion with individual databases. Columns include “Worst Case Rank (Total Candidates).”
| Challenge | CASMI Entry | MetFrag ChemSpF | MetFrag KEGGF | MetFrag PubChemF | MetFusion ChemSpT | MetFusion KEGGT | MetFusion PubChemT |
|---|
| 1 | 9 (5631)C | 1124 (4247) | 1 (4) | 1078 (5479) | 7 (4064) | 1 (4) | 9 (4723) |
| 2 | 44 (12702)C | 107 (3244) | 1 (1) | 649 (11925) | 20 (3228) | 1 (1) | 34 (11566) |
| 3R | 21 (335)* | 1 (52) | − (—) | 21 (325) | 2 (52) | − (—) | 15 (325) |
| 4R | 238 (721) | 6 (323) | − (4) | 7 (705) | 90 (323) | − (4) | 233 (705) |
| 5 | 4 (366)C | 9 (891) | 1 (1) | 39 (2303) | 3 (258) | 1 (1) | 4 (593) |
| 6 | 1 (6) | − (5) | − (—) | 1 (1) | − (5) | − (—) | 1 (1) |
| 7R | 17 (17)* | 16 (16) | 2 (2) | 17 (17) | − (—)P | − (—)P | − (—)P |
| 8R | 1 (1) | 1 (1) | − (—) | 1 (1) | 1 (1) | − (—) | 1 (1) |
| 9R | 1 (4)* | 1 (2) | 1 (1) | 2 (4) | 1 (2) | 1 (1) | 1 (4) |
| 10 | 1 (9) | 4 (14) | − (—) | 6 (24) | 1 (3) | − (—) | 1 (9) |
| 11B | 1 (2392) | 2 (2317) | 1 (10) | 15 (3843) | 1 (1450) | 1 (9) | 1 (2204) |
| 12 | 35 (902) | 149 (561) | 15 (18) | 207 (1103) | 38 (438) | 9 (18) | 41 (813) |
| 13R | 12 (227) | 11 (78) | − (—) | 17 (210) | 7 (78) | − (—) | 13 (210) |
| 14R | 1 (8219) | 151 (4793) | 4 (10) | 250 (7307) | 71 (4793) | 1 (10) | 146 (7308) |
| 15T | − (6)C | − (11) | − (—) | − (16) | − (2) | − (—) | − (5) |
| 15F | − (—) | 135 (449) | − (—) | 179 (663) | 1 (127) | − (—) | 1 (401) |
| 16T | − (3976)C | − (4271) | − (—) | − (6955) | − (4270) | − (—) | − (3663) |
| 16F | − (—) | 5251 (5251) | 1 (1) | − (8855) | 1 (3101) | 1 (1) | 1 (5071) |
BBest tautomer results reported. RRestricted by formula. CCASMI entry only restricted by Category 1 results (see text for details). TResults with CHNOPS=True. FResults with CHNOPS=False. Note for Challenges 15 and 16 the letter in the row name takes precedence over the column header. PNo peaks found in MassBank. *CASMI submission performed using MetFrag, not MetFusion. Bold type in “CASMI Entry” indicates challenge was equal or outright winner.
In total these submissions were the (joint) winner in 7 of the 16 challenges, where 6 of these had the correct compound ranked number 1—including two challenges (11, 14) with over 2,000 possible candidates. The joining of the three database results meant that the correct entry was present in all submissions despite the fact that 7, 1 and 1 of the correct entries were missing in KEGG, ChemSpider and PubChem, respectively. Thus, the automatic database joining avoided the coverage problem experienced by participants who relied on PubChem alone, and approached the manual strategy to include many data sources applied by the winners.5,6)
In addition to the contest submissions, the results that would have been achieved with either MetFrag or MetFusion alone on the individual databases are shown in the remaining columns of Table 2, as well as additional rows for Challenges 15 & 16 with an exact mass search and no element restrictions, to demonstrate what could have been achieved for these challenges. As expected, MetFusion outperformed MetFrag, with better or similar ranks for all challenges except Challenges 4 and 7. For Challenge 4, many candidates with high MetFrag scores were also structurally similar to the best spectral match in MassBank (Resveratrol, accession number CE000096, spectral similarity 0.5), which elevated the scores for these candidates above the score of the correct structure. No peaks corresponding to the spectrum of Challenge 7 were found in MassBank, such that only MetFrag results were available. As seen in Table 2, Challenges 15 and 16 were a missed opportunity, as running MetFusion with an exact mass search and no element restrictions would have resulted in two additional wins with the correct compound ranked first. Further details are given per challenge below.
Challenge 1: The Category 2 entries for Challenge 1 were restricted to the formulas C14H15N7O2 and C18H19NO4 using information from Category 1. MetFusion improved the results dramatically over MetFrag, where the results contained many candidates with the same scores. The maximum common substructure (MCSS) of the cluster containing the correct candidate (cluster 13, see the Supporting Information (SI), Figure S1) covers the majority of the backbone, excluding only one methoxy and hydroxy substituent per aromatic ring.
Challenge 2: This challenge had the most candidates of all challenges and although formula pre-selection was performed (candidates with C14H20N2O3 or C10H16N8O), the vast majority of candidates had the former (correct) formula. Challenge 2 was one of the only two challenges where the joining of the databases resulted in a worse rank than the worst of the individual database results (see Table 2; the other was Challenge 4). Both challenges had reasonably large candidate numbers and very little difference between the scores (Challenge 2 scores 0.7350–1.0885, with differences between the candidates in the 2nd decimal place). These are cases where the measured spectra and resulting spectral database matches do not provide enough discrimination power between all candidates. Although MetFrag explains the three most intense peaks in both Challenge 2 (Figure S2, SI) and 4 (Figure S4, SI), this is not sufficient to separate such a large number of candidate structures. Despite this, the rank of 44 of 12,702 candidates is a good result for automatic methods. A cluster plot of the top 50 compounds (Fig. 2a) shows that the correct structure forms a single-compound cluster (Fig. 2d), which is very different to the maximum common substructure from the cluster of the top scoring compounds (Fig. 2e) and other clusters containing high-scoring candidates (Figs. 2b & c). Thus, for this challenge the clustering would not even help to isolate a compound class, supporting the conclusions above that the measured spectrum does not provide sufficient information to rank so many candidates.
Challenge 3: These entries were restricted to candidates with the formula C13H24N4O4 using the Category 1 results. The MetFrag and MetFusion results were very similar for this challenge, indicating a lack of database spectra in MassBank for these compounds (highest spectral similarity 0.26). Submissions were thus made using MetFrag, which explained the two most intense peaks (see SI, Figure S3), the third was very low intensity. The CASMI 2013 organisers provided a “highly commended” alternative structure for Challenge 3 (see also SI, Figure S3) with isoleucine instead of leucine.5,6) Both structures had equal MetFrag scores, which resulted in a worst case rank of 21 for both, while a best case rank would equal to 1 for both structures. The clustering and similarity plot shows the relationship between the two structures impressively, with the two clustering together and clearly separated in similarity from the rest of the candidates (Figure S3, SI). Again, as few fragments were present in the measured spectrum, the high-scoring candidates were distributed amongst many clusters.
Challenge 4: was a disappointing result where MetFusion made the result worse than MetFrag, which is surprising for a reasonably simple structure where MetFrag covered the predicted spectrum reasonably well (see SI, Figure S4). Only candidates with the formula C15H14O were considered. This challenge also had highly commended alternative solutions, which were both ranked lower than the correct solution (ranks 293 and 299 for 2-(2-methylphenyl)-1-phenylethanone and 2-(4-methylphenyl)-1-phenylethanone, respectively). Interestingly, these two highly commended structures group together with some other similar compounds in the similarity plot (SI, Figure S4).
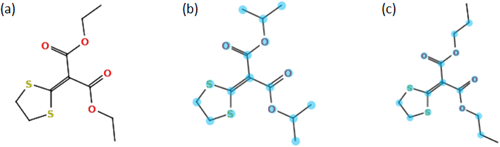
Challenge 5: was another challenge with a highly commended structure; the original submission had the correct structure isoprothiolane ranked 4th (Fig. 3b) and the highly commended structure, dipropyl 1,3-dithiolan-2-ylidenemalonate, was ranked 1st (Fig. 3c). These two structures cluster together in Cluster 30 with a very good MCSS (Fig. 3a) and are also clearly separated from all other candidates in the similarity plot (SI, Figure S5). Many single-compound clusters are present for this challenge, showing the diversity of candidates. Formula preselection was performed using all 9 formulas present in the Category 1 submission.
Challenge 6: was a very successful challenge with the correct structure ranked first of six candidates, without applying any formula preselection. Each candidate was member of a single-compound cluster, as shown in the SI, Figure S6.
Challenge 7: The formula was provided for this challenge (C75H62O30) and as there were no matching peaks in MassBank, the submission was performed using MetFrag. Although the overall result looks poor (17th of 17), this is only a result of the CASMI evaluation using the “worst case rank”1) and in fact all candidates had equal scores.
The correct solution is a flavonoid pentamer, the challenge spectrum shows major peak groups every 288 Da (C15H12O6), with MetFrag explaining one peak in every major peak group. Minor peak groups represented a loss of 152 Da (C8H8O3). Challenge 7 is a very large molecule and all 17 candidates are very similar, manual interpretation indicates that all candidates explain the challenge spectrum equally well, as shown in Figure S7 (SI).
Challenge 8: This challenge was a trivial case, with one (correct) candidate in both PubChem and ChemSpider with the given formula C45H38O20, to result in a rank 1 of 1.
Challenge 9: The candidates for this challenge were restricted to C9H11NO3PSCl3 and submissions were made using MetFrag. Although only a minor part of the spectrum was explained (see Figure S9, SI), the O,O,O-substituted phosphorothioates (score>0.6) were clearly separated from the O,O,S-substituted phosphorothioates (score <0.2). Although the top two isomers actually had the same MetFrag score, one candidate (chlorpyrifos) is much more common than the other candidate (supported by the number of references in ChemSpider, 1,457 versus 4) and a spectrum was available internally (also now on MassBank, accession numbers EA295001–EA295014, with a spectral match of 0.92). On the basis of this evidence, 0.5 was added to the score of chlorpyrifos manually, resulting in a final rank of 1. The MCSS and two top structures are shown in Fig. 4, while the cluster plot is given in the SI.
Challenge 10: This was another good result, where most participants in CASMI 2013 picked the correct structure at rank 1. MetFusion improved the good MetFrag result further, as the majority of the peaks were explained by MetFrag. No formula restriction was used for this challenge.
Challenge 11: No formula restrictions were used for this challenge, which had three equally valid solutions in the end due to the presence of different tautomeric forms of Challenge 11 in the compound databases.5,6) The different location of the single and double bonds meant that in silico methods and databases regarded these structures differently and the three participants who submitted entries for these challenges reported either two or three of the tautomers, each with different ranks.6) MetFrag clarified two peaks more of the spectrum with the first tautomer (Figure S11, SI), which was ranked first and thus a winning entry (shown in Fig. 5a). The other tautomers were ranked 21st and 22nd (Figs. 5b and c) and cluster together to form a much bigger MCSS than the cluster containing the winning tautomer (Figure S11, SI). Interestingly, the change in resonance form has a large impact on the similarity calculation, the tautomer ranked in first place only has a similarity of ∼0.65 to the other two tautomers (see Figure S11). Despite this, the MCSS for the major clusters show that most candidates have similar connectivity and if the MCSS were less sensitive to resonance structures, all tautomers could be encompassed into a general MCSS with the SMARTS c1cc(O)ccc1C=C~C(~O)~C~C(~O)~C=Cc2ccc(O)cc2.
Challenge 12: Challenge 12 was a reasonably solid result, with rank 35 of 902 candidates, without any formula restrictions to the candidate lists. MetFrag clarified most of the high intensity peaks (see SI Figure S12) and the similarity plot shows that the top 40 compounds are all very similar (>0.75). With many similar structures amongst the candidates, this rank is a reasonable result and a more detailed manual analysis, such as that performed by other participants, would be required to find the correct structure.
Challenge 13: This was the one challenge where the MetFrag/MetFusion submission was the only winner, with a rank of 12 (of 227) compared with 24 and 42 for the other two teams participating in this challenge, using the formula C17H30N2O5 provided. In this case both MetFrag and MetFusion returned very similar results as there were no very similar spectra in MassBank (highest match 0.58 for Etodolac, CO000187). MetFrag only clarified one of the 7 peaks, while both the cluster and similarity plots show that the candidates for this challenge were very diverse, with many single-compound clusters (see Figure S13, SI). As such, it would be difficult to define a substance class using automated methods for this challenge, similar to Challenge 2.
Challenge 14: This challenge had an exceptional result of top rank of 8219 candidates with the formula C21H24N2O3 (given), where the joining of database results had a big influence on the outcome. Like Challenge 2, there is little differentiation in the scores, visible in the ChemSpider and PubChem ranks of 71 and 146, respectively. However, the top two KEGG candidates had higher scores (0.7148 and 0.7132) than all PubChem and ChemSpider candidates (top scores 0.7112 and 0.7091, respectively). The cluster plots show that the top six compounds cluster into two groups, again with a large MCSS that explain a large proportion of the molecule. A very similar compound with rank 8 is also included in the cluster with the correct molecule, these three compounds are clearly separated in the similarity plot (Figure S14, SI), while the compounds in the second cluster form the next group of similar compounds (ranks 3–6) in the similarity plot. This excellent result for MetFusion is due to a high matching MassBank spectrum for Ajmalicine (FIO00003), a stereoisomer of the correct answer with a spectral similarity score of 0.8.
Challenge 15: As mentioned above, Challenges 15 and 16 were missed opportunities as MetFrag was used to see if high scoring candidates with different formulas to the pre-selected formulas were present. MetFusion results were then submitted using the CHNOPS=T filter (no further formula restrictions). The poor performance of MetFrag for both challenges can be seen easily looking at the overlay of measured and predicted spectra (SI, Figure S15). However, the (retrospective) MetFusion results in Table 2 show that both these challenges would have been ranked number 1 if MetFusion had been used with exact mass and no element restrictions. For Challenge 15 the correct candidate had a MetFrag score of 0.26675, which was raised to 1.00739 after weighting with MassBank, due to a high structural similarity (0.78) between the correct answer and the best and high-scoring spectral match, 82Fluorotelomer Acid (FFF00410).
Challenge 16: While the original CASMI submission did not contain the correct compound, retrospective calculations were performed using an unrestricted exact mass search to obtain results containing the correct compound. These calculations showed that the original MetFrag score of 0.489 for the correct candidate increased to 1.526 after MetFusion due to a spectral match of 0.69 with the correct compound Ofloxacin in MassBank (UF407501), which elevated the correct candidate into first place. This clearly shows the benefits of adding spectra of standard compounds into openly accessible spectral libraries and also the strength of the combined approach of MetFrag and MetFusion. The clustering results shown in Figure S16 (SI) were also interesting and despite the very high similarities with many top candidates, informative MCSS were formed to allow a good separation of candidates.
The results from the challenges above show that the approach used here was generally very successful for an automated approach using large compound databases and the results were a great improvement on the compound database submissions for the 2012 CASMI competition. The implementation of filtering criteria post-candidate retrieval proved an efficient and also flexible means of reviewing the results and preparing the desired submission files. Prior determination the molecular formula and then searching on that formula only is generally performed in non-target identification21) and can reduce the number of higher scoring incorrect candidates. However, restricting the submissions to one or a few formulas upfront can result in missing solutions as seen in Challenges 15 and 16. For those challenges where the formula was not clear, the exact mass search with post-retrieval filtering for selected formulas certainly proved a viable alternative. MetFusion was also often able to rank the correct candidate highly even without formula restrictions. As mentioned above, the joining of the databases improved coverage while lowering the ranks below the lowest rank for an individual database in only two cases. This may be partially due to the score normalisation implemented in individual MetFrag and MetFusion runs, which is an issue being investigated beyond the scope of CASMI 2013. Other features that would be useful in the future to improve the results further would be ways to incorporate more of the additional information provided by the organisers, such as “the compound is a secondary metabolite” (Challenge 1) or “this is a synthetic product” (Challenge 3). While some research has been done into indexes of metabolite likeness (e.g. Hamdalla et al.,22) Peironcely et al.23)) or using references to rank candidates (Little et al.24)), these features were not yet implemented into MetFrag or MetFusion at the time of CASMI 2013.
While the workflow approach here was generally successful, a number of anomalies exist. The interconversions between various cheminformatic data formats (mol, SDF, SMILES, InChI) during the workflow can lead to changes in the structures and the location of hydrogens, especially where aromatic nitrogens are involved. The MCSS in several cases seemed to be much smaller than necessary due to inconsistencies in aromatic and/or tautomeric perception. Large compound databases inherently have errors, which any workflow will need to catch or work around (e.g. PubChem CID: 59694784 retrieved for Challenge 2, but with a CH group instead of CH3, or PubChem CID 24209464 for Challenge 4 which does not generate valid fingerprints for clustering). As observed by the CASMI organisers for Challenge 11, tautomeric structures and other chemically equivalent forms of structures that are considered different informatically but interchangeable chemically, pose a problem for any workflow especially as the different representations can generate different ranks. The assumption made during MetFrag/MetFusion and in the post-generation filtering to use the InChI Key first block (i.e., not considering stereochemistry) holds reasonably well for mass spectral-based methods, where the stereochemistry cannot be determined (unless e.g. chiral chromatography or ion mobility is used, i.e., via separation, not detection). This sometimes (but not always) captures tautomers and the issue of tautomerism should be investigated closer in the future. While the post-filtering options applied were very efficient at removing some undesired phenomena in the results lists (e.g. charged structures), it is unlikely that this affected the ranks in the CASMI contest dramatically as these were generally low scoring candidates. Although the total candidate numbers were reduced, the absolute rank is what matters in the end for identification.