Abstract
Serum and plasma contain thousands of different proteins and peptides, which can provide valuable information about the numerous processes that take place within the body. However, detailed analysis of proteins and peptides in serum and plasma remains challenging due to the presence of many high-abundance proteins, the large dynamic range of protein and peptide concentrations, the extensive complexity caused by posttranslational modifications, and considerable individual variability. In particular, detailed analysis and identification of native peptides is extremely difficult due to the tremendous variety of cleavage possibilities and posttranslational modifications, which results in extremely high complexity. Therefore, widely ranging searches based on peptide identification are difficult. Herein, we describe the highly accurate and sensitive quantitative analysis of over 2,500 peptides with the concentration limit of about 10 pM. The strategy combined isobaric tag labeling, amine-reactive 6-plex tandem mass tag labeling, and a modified differential solubilization method for high-yield peptide extraction [Saito, T. et al. J. Electrophoresis 2013 57: 1–9]. Using this strategy, we quantitatively analyzed six pooled plasma samples (three pre-surgery and three post-surgery) to discover potential candidate biomarker peptides of renal cell carcinoma. The concentrations of 27 peptides were found to be altered following surgery. A preliminary validation study was conducted using about 80 plasma samples to demonstrate the possibility that even unidentified potential candidate biomarker peptides can be verified using the isotope tag/dimethyl labeling method. We also discuss technical consideration and potential of this strategy for facilitating native peptide research.
INTRODUCTION
Serum and plasma proteins/peptides reflect physiologic or pathologic states in humans and are attractive targets for the discovery of disease biomarkers. Native peptides include members of several physiologically important classes, such as peptide hormones and fragments of larger proteins generated by disease-specific fragmentation. However, the existence of high-abundance proteins and the large dynamic range of serum and plasma protein/peptide concentrations make any quantitative analysis of low-abundance proteins/peptides challenging.1,2) Furthermore, detailed analyses of peptides are more difficult due to the presence of many interfering proteins, binding to carrier proteins, and complexity resulting from the large number of cleavage products. Powerful pretreatment and highly reproducible analytical methods are essential for the discovery of biomarker candidates, and quantitative methods suitable for verification and validation studies are necessary for the development of clinically usable diagnostic biomarkers. However, identifying native peptides in serum/plasma is much more difficult than identifying tryptic peptides derived from proteins isolated from cells/tissues, even when using high-resolution mass spectrometry, thereby increasing the difficulty of biomarker peptide discovery and validation using identification-based strategies. Furthermore, the use of selected reaction monitoring (SRM)/multiple reaction monitoring (MRM) or specific antibodies for the validation of unidentified peptides is not possible. Therefore, a strategy that permits quantitative peptide analysis without the need for prior identification is essential for the discovery of clinically usable biomarkers.
The most widely used approaches for examining native peptides in serum/plasma employ MALDI-TOF-MS following simple solid-phase extraction or functionalized-bead pretreatment methods. Some of the peptides that have been discovered and validated using these methods are indicative of disease onset,3–9) suggesting that native peptides may represent an as yet unexplored archive of histologic information. However, only a small proportion of peptides present in serum/plasma at concentrations above 100 nM can be analyzed using conventional approaches. In 2010, we developed a novel differential solubilization (DS) method for extracting LMW proteins/peptides from serum/plasma.10) Furthermore, in 2013, we optimized the concentration of acetonitrile (ACN) in the redissolving solution of the DS method to enhance the concentration ratio of peptides less than about 6 kDa and developed a high-quality comparative analysis strategy for the discovery and small-scale validation of nanomolar-range biomarker peptides in serum/plasma using this modified DS method followed by highly reproducible LC-MS method employing conventional HPLC.11) This method involves detection of MS peaks associated with potential candidate biomarker peptides without identification, followed by identification of the candidate peptides using concentrated samples. However, even using this method, direct analysis of low-abundance peptides, such as bioactive peptides present in the sub-nanomolar concentration range, has not been achieved. The discovery and validation of low-abundance disease-specific biomarker peptides thus requires the development of a more sensitive and highly reproducible strategy to analyze tens of samples without prior identification of the peptides.
The use of a nano-flow LC-MS system is essential for enhancing the sensitivity of quantitative peptide analyses. However, the LC-MS systems are not as mechanically robust as conventional systems. Stable-isotope labeling technologies can be employed to enhance the reproducibility and sensitivity of quantitative analyses using nano-flow LC-MS because peptides in two or more samples are tagged with stable isotopes of differing mass and then mixed before MS analysis, enabling quantitative analyses with high precision.
Two types of stable-isotope labeling technologies are currently available: isotopic tags and isobaric tags.12,13) Isotopic tag methods such as dimethyl (DM) labeling14) are reliable, easy to use and not require expensive reagents. Therefore, DM labeling is useful for validation studies involving more than 10 samples. However, the complexity of MS spectra increases by a factor of two if both light and heavy labels are used. Furthermore, it is difficult to recognize doublet peaks of unidentified peptides labeled with light and heavy reagents because it is possible that there may be more than two reactive sites for isotopic tags, particularly for native peptides. In addition, compared with the identification of tryptic peptides, identifying native peptides in serum/plasma is more difficult due to the variety of potential cleavage sites and posttranslational modifications, which may affect native peptides in serum/plasma more than those in cells and organs. In contrast, isobaric tags such as isobaric tags for relative and absolute quantitation12) (iTRAQ) and the tandem mass tag13) (TMT) do not increase the complexity of MS spectra, making it possible to quantitatively analyze every peptide measured by MS/MS, even those that are unidentified. However, large-scale validation studies using these tags are costly. Furthermore, as isolation width of precursor ion for MS/MS analysis is not enough narrow, the intensity of reporter ion has the potential to include the abundance information of a few peptides with adjacent m/z within isolation width. Therefore, for the discovery of disease biomarker peptides in serum/plasma, it is ideal to use isobaric tag for discovery study and isotopic tag for validation study.
In this study, we established a strategy for discovering disease-related native peptides in serum/plasma that involves combining an isobaric tag/amine-reactive 6-plex TMT method with the modified DS method for high-yield peptide extraction. The lower limit of accurate comparative analysis for the discovery study was estimated to be on the order of 10 pM, enabling the discovery of low-abundance candidate biomarkers such as peptide hormones. A preliminary validation study was conducted using patient samples to demonstrate the possibility that even previously unidentified potential candidate biomarker peptides can be verified using the isotope tag/DM labeling method.
EXPERIMENTAL
Chemicals and reagentsUrea, thiourea, dithiothreitol(DTT), HCl for DS method were purchased from Wako Pure Chemical Industries, Ltd. (Osaka, Japan). Invitrosol and NV-10 used for redissolving peptides were obtained from Thermo Fisher Scientific (MA, Waltham, USA) and AMR (Tokyo, Japan), respectively. All kinds of TMT reagents and hydroxyamine were purchased from Thermo Fisher Scientific and triethyl ammonium bicarbonate buffer (TEAB) were done from Sigma-Aldrich (St. Louis, MO, USA). CH2O, NaBH3CN, CD2O, NaBD3CN and ammonia for DM labeling were purchased from Sigma-Aldrich. For nano-flow HPLC equipped to Hybrid quadrupole-orbitrap mass spectrometer (Q-Exactive, Thermo Fisher Scientific), solvent of ACN/0.1% formic acid (FA), distilled water/0.1% FA were obtained from Thermo Fisher Scientific. For conventional HPLC equipped to hybrid ion trap-orbitrap mass spectrometer (LTQ-Orbitrap Discoverer, Thermo Fisher Scientific), ACN, FA were purchased from Wako Pure Chemical Industries, Ltd. and distilled water done from Nacalai Tesque (Kyoto, Japan).
Human plasma samplesPlasma samples were allowed to clot at room temperature and were then centrifuged at 2,000×g for 15 min at room temperature. Aliquots (55 μL) were stored at −80°C until use. A total of 40 pre- and post-surgery plasma samples from 20 renal cell carcinoma (RCC) patients (Table 1) and 30 plasma samples from 15 of the RCC patients described in Table 1 were pooled to attempt discovery of potential candidate biomarker peptides using the TMT approach. A total of 37 pre- and post-surgery plasma samples from 20 bladder tumor (BT) patients were used to verify the potential candidate biomarkers (Table S1). All subjects provided written informed consent, and the Ethics Committee of Kitasato University approved the study. Plasma samples were kept frozen, thawed only once, used rapidly, and the unused remainder was discarded. Clotting time was measured for each sample, and the results are shown in Table 1 and Table S1. Each tumor was histopathologically classified according to the recent classification criteria, which includes stage of disease and degree of tumor invasion.15)
Table 1. Clinical features of RCC patients.
| Patient No. | Gender | Age | Stage | Grade | Clotting time (h)a) | Post-surgery timeb) (weeks) | Pool group |
|---|
| Pre-surgery | Post-surgery |
|---|
| 1 | Female | 56 | T2 | G2 | *1 | 3 | 53.1 | *2 |
| 2 | Male | 59 | T1 | G2 | *1 | *1 | 4.1 | *2 |
| 3 | Male | 59 | T3 | G3 | *1 | *1 | 4.7 | 2 |
| 4 | Female | 75 | T2 | G2 | *1 | 4 | 13.6 | 3 |
| 5 | Male | 43 | T1 | G2 | 2 | 4 | 3.9 | 2 |
| 6 | Male | 60 | T1 | G2 | 4 | 4 | 6.7 | 2 |
| 7 | Male | 75 | T3 | G2 | *1 | 3 | 8.3 | *2 |
| 8 | Male | 56 | T3 | G2 | 2 | 3.5 | 4.3 | 1 |
| 9 | Male | 52 | T1 | G2 | 2 | 3 | 3.7 | 2 |
| 10 | Male | 61 | T3 | G2 | 2 | 2 | 4.1 | 1 |
| 11 | Male | 69 | T1 | G1 | 2 | 3 | 8.7 | 3 |
| 12 | Male | 67 | T1 | G1 | 2 | 4.5 | 3.4 | 1 |
| 13 | Male | 40 | T1 | G2 | 3 | 4 | 3.9 | 3 |
| 14 | Male | 73 | T3 | G2 | 2 | 3 | 8.9 | 2 |
| 15 | Male | 61 | T1 | G2 | 2 | 3 | 13.1 | 3 |
| 16 | Male | 43 | T1 | G1 | 4 | 3.5 | 3.3 | 3 |
| 17 | Male | 63 | T1 | G2 | 2 | 6.5 | 4.3 | *2 |
| 18 | Male | 57 | T1 | G2 | 2 | 4 | 8.9 | 1 |
| 19 | Male | 77 | T1 | G1 | 2 | 5 | 2.6 | 1 |
| 20 | Male | 57 | T1 | G2 | 2 | 2 | 5.3 | *2 |
a) Period between blood collection and centrifugation. b) Period between surgery and blood collection. *1 Clotting time unclear, but less than 7 h. *2 Use in validation study, but not use in discovery study as pool plasma.
A 20-μL plasma sample was diluted 1 : 2 with 40 μL of denaturing solution (7 M urea, 2 M thiourea, and 20 mM DTT), slowly added drop-wise into 900 μL of ice-cold acetone and immediately stirred at 4°С for 1 h, then centrifuged at 19,000×g for 15 min at 4°С. The precipitate was taken up in 200 μL of redissolving solution, 80% ACN containing 12 mM HCl, mixed at 4°С for 1 h, and then centrifuged again at 19,000×g for 15 min at 4°С. The peptides were extracted into the supernatant, which was then lyophilized and stored at −80°C until use.
TMT labelingLyophilized peptides extracted according to the modified DS method from 4 μL of plasma were redissolved in 20 μL of 500 ng/mL NV10 (AMR, Tokyo, Japan). Subsequently, the solution was desalted using Stop and go extraction tips (Stage tips) filled with Empore™ SDB-XC sealant (3 M, MN, USA). The peptides were eluted with 40 μL of 80% ACN containing 200 mM TEAB. Each 6-plex TMT label reagent was redissolved to a concentration of 16 μg/μL with anhydrous ACN. A total of 5 μL of TMT solution was added to the eluate and incubated for 1 h at room temperature, and the reaction was stopped by the addition of 2 μL of 5% hydroxyamine. Six samples labeled with TMT reagents were combined and lyophilized. The sample was redissolved in 20 μL of 500 ng/mL NV10 and analyzed using LC-MS. Three samples of pre-surgery plasma pooled from five patients were labeled with TMT-126, TMT-128, and TMT-130, whereas three samples of post-surgery plasma pooled from the five patients were labeled with TMT-127, TMT-129, and TMT-131 (Table 1).
DM labelingFor light-isotope labeling, lyophilized peptides extracted from 24 μL of plasma were redissolved in 48 μL of 100 mM TEAB in Invitrosol (by mixing for 1 h at room temperature). Next, 19.2 μL of 4% CH2O and 9.6 μL of 0.6 M NaBH3CN were added to the sample, followed by incubation for 1 h at room temperature. The labeling reaction was stopped by the addition of 19.2 μL of 1% ammonia and vortexing to mix the reagents. Subsequently, the sample was acidified by adding 9.6 μL of 100% FA and vortexing to mix the reagents. The final volume of the light-isotope-labeled sample was 105.6 μL from 24 μL of plasma. For heavy-isotope labeling, lyophilized peptides extracted from 20 μL of plasma were labeled according to the same procedure as described above for light-isotope labeling using 16 μL of 4% CD2O and 8 μL of 0.6 M NaBD3CN. The final volume of the heavy-isotope-labeled sample was 88 μL from 20 μL of plasma.
Light-isotope-labeled peptides from 77 plasma samples obtained from the patients described in Table 1 and Table S1 were pooled, and 70.4 μL of the total volume of 8131.2 μL (corresponding to 16 μL of pooled plasma) was mixed as an internal standard with 88 μL of each heavy-isotope-labeled sample.
LC-MS/MS analysisTo analyze TMT-labeled samples in the discovery phase of the study, the samples were injected onto a C18 0.075×20 mm trap column (Acclaim PepMap 100; GL Sciences, Tokyo, Japan) and then eluted onto a C18 0.075×120 mm analytical column (Nano HPLC Capillary Column; Nikkyo Technos, Tokyo, Japan) configured to an EASY-nLC 1000 HPLC system (Thermo Fisher Scientific). The flow rate of the mobile phase was 300 nL/min; mobile phase (A) consisted of 0.1% FA and mobile phase (B) consisted of 0.1% FA/90% ACN. The mobile phase gradient was programmed as follows: 5–25% B (0–96 min), 25–50% B (96–106 min), 50–95% B (106–108 min), and 95% B (108–120 min). Separated peptides were introduced from the HPLC to a Q-Exactive operated in data-dependent mode to automatically switch between full-scan MS and MS/MS acquisition. Full-scan MS spectra (m/z 400–1,200) were acquired in an Orbitrap instrument with 70,000 resolution at m/z 200 after accumulation of ions to a 1×10⁶ target value. The 12 most intense full-scan peaks with charge state ≥2 were selected with an isolation window of 1.6 Da and fragmented in the high-energy collisional dissociation cell at a normalized collision energy of 30%. Tandem mass spectra were acquired in the Orbitrap mass analyzer with a mass resolution of 17,500 at m/z 200 after accumulation of ions to a 1×10⁵ target value. The ion selection threshold was 2×10⁴ counts, and the maximum allowable ion accumulation times were 120 ms for full MS scans and 500 ms for tandem mass spectra. Typical mass spectrometric conditions were as follows: spray voltage, 2 kV; no sheath or auxiliary gas flow; heated capillary temperature, 250°C; dynamic exclusion time, 60 s.
For the validation study, peptides were injected onto a 2.0 mm (i.d.)×50 mm CAPCELL PACK MGIII-H S3 column (Shiseido Fine Chemicals, Tokyo, Japan) attached to a Nanospace SI-2 HPLC system (Shiseido Fine Chemicals). The column temperature was maintained at 45°C. The flow rate of the mobile phase was 200 μL/min; mobile phase (A) consisted of 0.05% FA and mobile phase (B) consisted of 0.05% FA 90% ACN. The mobile phase gradient was programmed as follows: 0–0% B (0–5 min), 0–50% B (5–25 min), 50–60% B (25–27.5 min), 60–95% B (27.5–29 min), and 95% B (29–37 min). Peptides were introduced from the HPLC to an LTQ-Orbitrap Discoverer. Full-scan MS spectra (m/z 300–2,000) were acquired using an Orbitrap instrument with 30,000 resolution at m/z 400.
Peptide identification and quantitationDatabase searches were performed using the SEQUEST algorithm incorporated in Proteome Discoverer 1.4.0.288 software (Thermo Fisher Scientific). The search parameters were as follows: enzyme, no enzyme; variable modification, oxidation of M residue; variable modification, TMT labeling of N-terminal and K residues; peptide ion mass tolerance, 6 ppm; fragment ion mass tolerance, 0.02 Da; peptide charges, +2 to +8. The identified peptides were searched against the decoy database and the false discovery rate (FDR) was set as 0.01 using Percolator scoring with posterior error probability validation. Peptide quantitation was also performed using Proteome Discoverer 1.4.0.288. A TMT 6-plex quantitation method was used for higher-energy collisional dissociation-based quantitation. The mass tolerance was 2 ppm for reporter TMT tags. Both peptide identification and quantitation were performed in an overall workflow in Proteome Discoverer.
Statistical analysisFrom the results of the validation study, p-value was calculated from the peak intensities of potential candidate peptides using Wilcoxon signed-rank test with a statistical analysis software Graphpad Prism (version 5.02).
RESULTS
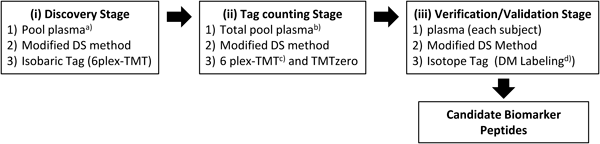
A flowchart of the strategy used for the discovery and verification of biomarker peptides (including unidentified peptides) is depicted in Fig. 1. In discovery stage (i), potential candidate biomarker peptides were discovered using 6-plex TMT reagent, which made it possible to comparatively analyze an extensive variety of peptides, even if these peptides have not been identified. In tag counting stage (ii), the number of TMT binding sites for each unidentified potential candidate peptide was determined as follows: (1) aliquots of the six plasma samples used in the discovery study were pooled to prepare a total pooled plasma sample; (2) the total pooled plasma sample was divided into two portions, one of which was labeled with non-isotope TMT reagent (TMTzero; molecular weight 224.1 Da) and the other labeled with one of the 6-plex TMT reagent (molecular weight 229.1 Da); (3) the TMTzero- and 6-plex TMT-labeled portions were mixed and analyzed using LC-MS; and (4) the number of TMT binding sites for each peptide was determined from differences in m/z for doublet peaks. Finally, in verification/validation stage (iii), potential candidate peptides were verified by analyzing plasma samples from tens of patients and healthy subjects using a DM labeling method in which a light-isotope-labeled sample of total pooled plasma was added as an internal standard to each sample labeled with the heavy isotope reagent.
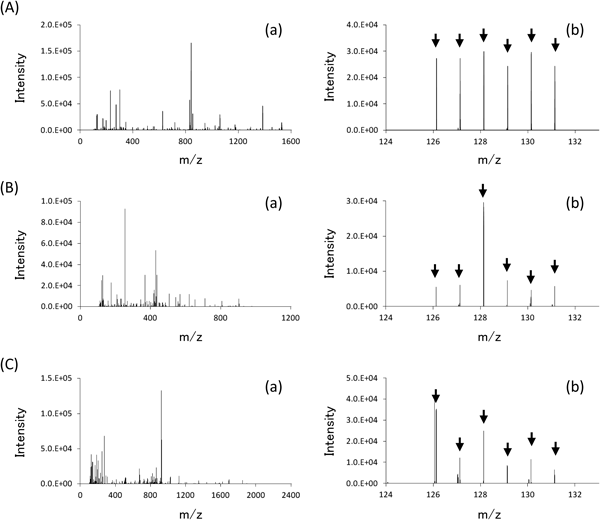
In the discovery stage (i), peptides from six samples of pooled plasma (three pre-surgery and three post-surgery samples from the patients described in Table 1) were extracted using the modified DS method. Each sample was labeled with 6-plex TMT reagent, a mixture of the six samples was analyzed twice using LC-MS/MS, and the intensities of the six reporter ions for each peptide were compared (Fig. 2). A total of 12,661 MS/MS spectra (6,491 and 6,168 spectra from the respective LC-MS/MS analyses) were acquired. Reporter ions were observed in 12,408 of the MS/MS spectra (6,337 and 6,071 from the respective LC-MS/MS analyses), and approximately 2,700 distinct peptide groups were quantitatively analyzed (2,097 and 2,085 from the respective LC-MS/MS analyses). Peaks for which the monoisotopic mass differed between the respective analyses by <6 ppm were assumed to represent the same peptide. A total of 74 native peptides derived from 33 proteins were identified. The ratios of reporter ions for each paired pooled plasma sample originating from the same patient (TMT126 : TMT127, TMT128 : TMT129, TMT130 : TMT131) were calculated to determine pre- and post-surgery relative levels. Average ratios were calculated for peptides that were observed in a number of MS/MS spectra. Peptides for which all three reporter ion ratios were >1.25 or <0.80 (=1/1.25), twice of average standard deviation estimated from monitor peptides spiked into plasma samples prior to peptide extraction (Fig. 4), were selected as potential candidate biomarkers. A total of 27 candidate peptides (including 13 downregulated and 14 upregulated following surgery) were discovered in this study and are summarized in Tables 2 and 3, respectively, with the observed m/z, number of TMT binding sites, and molecular weight data provided. Only two of 27 candidate peptides were identified.
Table 2. Potential candidate RCC biomarker peptides down-regulated following surgery.
| Peptide No. | Intensity ratios of reporter ions of TMT | Charge | m/z 6 plex-TMT1) | No. reactive site | Molecular weight2) | Gene name | Amino acid sequence |
|---|
| 127/126 | 129/128 | 131/130 | Average |
|---|
| a1 | 0.76 | 0.58 | 0.62 | 0.65 | 2 | 449.6940 | 1 | 668.2105 | Not identified | |
| a2 | 0.41 | 0.63 | 0.40 | 0.48 | 2 | 492.7200 | 1 | 754.2626 | Not identified | |
| a3 | 0.70 | 0.63 | 0.59 | 0.64 | 2 | 501.7249 | 1 | 772.2723 | Not identified | |
| a4 | 0.61 | 0.66 | 0.60 | 0.62 | 2 | 522.7354 | 1 | 814.2932 | Not identified | |
| a5 | 0.70 | 0.43 | 0.26 | 0.46 | 3 | 516.5599 | 2 | 1088.3321 | Not identified | |
| a6 | 0.63 | 0.50 | 0.46 | 0.53 | 4 | 545.0582 | 3 | 1488.7150 | Not identified | |
| a7 | 0.72 | 0.66 | 0.43 | 0.60 | 5 | 528.5377 | 5 | 1491.8373 | Not identified | |
| a8 | 0.74 | 0.55 | 0.59 | 0.63 | 5 | 482.7059 | 4 | 1491.8413 | Not identified | |
| a9 | 0.61 | 0.56 | 0.55 | 0.57 | 2 | 985.0003 | 1 | 1738.8231 | Not identified | |
| a10 | 0.68 | 0.76 | 0.74 | 0.73 | 3 | 746.1359 | 2 | 1777.0601 | Not identified | |
| a11 | 0.43 | 0.45 | 0.78 | 0.55 | 3 | 835.7786 | 2 | 2045.9880 | Not identified | |
| a12 | 0.75 | 0.70 | 0.60 | 0.68 | 4 | 815.4955 | 4 | 2341.3011 | Not identified | |
| a13 | 0.30 | 0.40 | 0.58 | 0.43 | 5 | 672.1757 | 2 | 2897.5161 | Not identified | |
1) The observed m/z of precursor ion of each potential candidate peptide labeled with 6 plex-TMT. 2) Molecular weight was calculated from observed m/z of 6 plex-TMT.
Table 3. Potential candidate RCC biomarker peptides up-regulated following surgery.
| Peptide No. | Intensity ratios of reporter ions of TMT | Charge | m/z 6 plex-TMT1) | No. reactive site | Molecular weight2) | Gene name | Amino acid sequence |
|---|
| 127/126 | 129/128 | 131/130 | Average |
|---|
| b1 | 1.64 | 1.55 | 1.59 | 1.59 | 4 | 499.0623 | 3 | 1304.7314 | Not identified | |
| b2 | 2.15 | 1.75 | 1.61 | 1.84 | 4 | 420.4967 | 1 | 1448.7947 | Not identified | |
| b3 | 1.53 | 1.38 | 2.22 | 1.71 | 3 | 641.4273 | 2 | 1462.9342 | Not identified | |
| b4 | 1.87 | 1.40 | 1.32 | 1.53 | 4 | 490.0336 | 2 | 1497.7794 | C4A | NGFKSHALQLNNR3) |
| b5 | 2.27 | 1.33 | 1.37 | 1.66 | 4 | 550.3187 | 2 | 1738.9199 | C4A | NGFKSHALQLNNRQI3) |
| b6 | 1.91 | 1.43 | 1.27 | 1.54 | 5 | 468.2714 | 2 | 1877.9949 | Not identified | |
| b7 | 2.59 | 2.09 | 1.34 | 2.01 | 5 | 468.6766 | 2 | 1880.0206 | Not identified | |
| b8 | 1.92 | 1.39 | 1.43 | 1.58 | 4 | 589.3443 | 2 | 1895.0223 | Not identified | |
| b9 | 1.78 | 1.44 | 1.30 | 1.51 | 5 | 479.6830 | 2 | 1935.0527 | Not identified | |
| b10 | 1.52 | 1.39 | 1.35 | 1.42 | 5 | 646.7739 | 2 | 2770.5075 | Not identified | |
| b11 | 1.44 | 1.80 | 1.31 | 1.52 | 5 | 619.9148 | 1 | 2865.3746 | Not identified | |
| b12 | 2.13 | 1.48 | 1.37 | 1.66 | 5 | 679.1589 | 1 | 3161.5954 | Not identified | |
| b13 | 2.51 | 2.18 | 1.71 | 2.13 | 5 | 724.9980 | 2 | 3161.6277 | Not identified | |
| b14 | 1.44 | 1.30 | 1.33 | 1.36 | 4 | 982.2256 | 2 | 3466.5474 | Not identified | |
1) The observed m/z of precursor ion of each potential candidate peptide labeled with 6 plex-TMT. 2) Molecular weight was calculated from observed m/z of 6 plex-TMT. 3) Underlined amino acid was labeled by TMT.
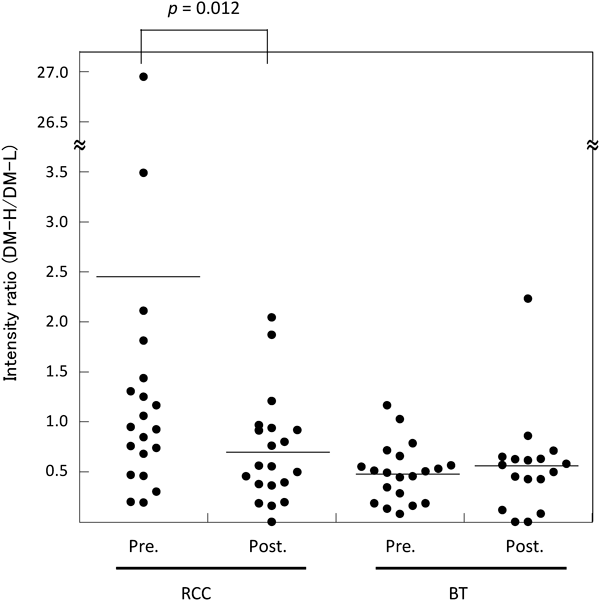
For the first trial in the validation study, we examined 77 plasma samples from 20 RCC patients (Table 1) and 20 BT patients (Supplemental Table S1) using the DM labeling method by an LC-MS system equipped with a conventional HPLC. Though the sensitivity of the LC-MS system was lower than that of nano-flow LC-MS system used in discovery study, six of the 27 potential candidate peptides, a11 and a13 in Table 2 and b2, b4, b6 and b8 in Table 3, were detected and ratios of the intensity of heavy-isotope-labeled peptide (DM-H) to that of light-isotope-labeled peptide (DM-L) were analyzed. The results are shown in Fig. 3 and Figure S1 as preliminary data. The concentration of peptide a11 significantly decreased after surgery (p<0.05) and the levels in plasma of BT patients were lower than those of RCC patients. Though the concentration of the other peptides shown in Figure S1 were not significantly changed following surgery, similar to the results observed in the discovery study using TMT labeling.
DISCUSSION
In this study, we established a comparative analysis strategy for discovering disease-related peptides in plasma using an isobaric tag method and demonstrated the possibility that even previously unidentified potential candidate biomarker peptides can be verified using isotopic tags.
In the discovery stage (i), the accuracy, sensitivity, and comprehensiveness of the comparative analysis are important. To assess the accuracy and sensitivity of our proposed method, monitor peptides (tryptic peptides of E. coli β-galactosidase [β-Gal]) were spiked into plasma samples at a concentration of 10 nM prior to peptide extraction. Figure 4 shows the relative standard deviation (CV%) of the intensities of the six reporter ions for all 109 MS/MS spectra collected from 36 tryptic peptides of β-Gal observed in the first LC-MS/MS measurement. The horizontal axis represents the peak intensity of the precursor ion in the MS spectrum observed just before each MS/MS measurement. With respect to the accuracy of the comparative analyses, the CV% of more than three-fourths of all precursor ions was less than 15%, and for all but four precursor ions, the CV% values were less than approximately 20%, with an average CV% of 12.3%. These results suggest that all of the steps, including peptide extraction, were highly reproducible, resulting in a high degree of accuracy in the quantitative analyses.
As mentioned above, tryptic peptides of β-Gal were spiked into plasma samples at a concentration of 10 nM prior to peptide extraction. The maximum intensity of precursor ion of these peptides was 4×10⁷, and the lower limit of the intensity of precursor ion for accurate comparative analysis, CV% less than 20%, was 4×10⁴ from the results of Fig. 4. From these results, we estimated that the concentration limit for accurate comparative analysis was 10 pM from 7.4 μL of plasma (1.23 μL from each of the six samples). This estimation is not inconsistent with the result which the well-known bioactive peptide bradykinin, concentration in plasma/serum has been reported to pM–200 pM,16–19) was detected at a peak intensity of 4×10⁵ (Fig. 2). The above-mentioned results indicate that the sensitivity of the comparative analysis in the discovery study was extremely high, even though most of the peptides were not identified.
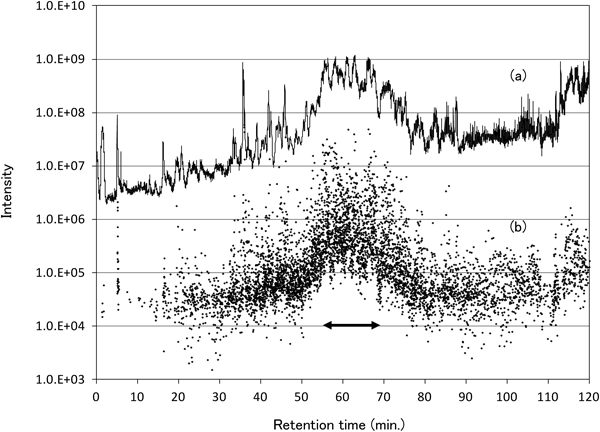
With respect to the comprehensiveness of the method, the number of native peptides observed during the 2-h LC-MS/MS analysis was approximately 2,700. Although this is a large number of native peptides, it is fewer than would be expected based on the method’s sensitivity. Figure 5 shows the total ion current (TIC) chromatograph of the LC-MS/MS analysis (a) and the intensities of the MS/MS precursor ions at each retention time (b). In terms of intensity, the total dynamic range of the precursor ions was approximately four orders of magnitude, but the range of the intensities at retention times between 55 and 70 min (indicated by an arrow where the TIC intensity was higher than about 108) was less than 3 orders of magnitude. In this retention time range, the intensity of most precursor ions was >105. Numerous ions with an intensity <105 were detected, but MS/MS spectra for these ions were not observed; one possible reason for this is the MS/MS measurement rate. In our method, precursor ions for MS/MS analyses are automatically selected from the monoisotopic mass of the 12 most intense peptide ions in the MS spectrum, where peptide ions without charge estimation and those analyzed within the previous 15 s are excluded. Even at retention times between 55 and 70 min, six or fewer MS/MS spectra were collected for each MS spectrum. In this retention time region, peptide ions with an intensity between 104 and 105 were observed, but recognition of the charge state failed, even though the charge states of peaks with an intensity of 104 at retention times outside of the 55- to 70-min range were properly recognized. Because the MS ion accumulation time is automatically controlled by the TIC at each retention time, the time was too short to collect accurate MS spectra of low-intensity peptide ions at retention times between 55 and 70 min, even though many low-intensity ions were observed. Therefore, we tried automatic MS/MS analysis without recognition of the charge state. However, this did not work well because many ions from the same peptides were measured, resulting in many MS/MS spectra from the same peptides as the high-intensity peptide ions. These results suggest that the limit of detection for comparative analyses using this method is 10 pM, but the analytical sensitivity at retention times in which the TIC is >108 (between 55 and 70 min) is one or two orders of magnitude lower (e.g., 100 to 1,000 pM). This factor explains why the number of peptides analyzed was lower than what would be expected based on the sensitivity of this method. Therefore, extending the duration of the LC-MS/MS analysis and/or prefractionating samples (e.g., using techniques such as ion exchange chromatography) should enhance the comprehensiveness of the method, particularly for isotope-tagged samples, which can be fractionated without lowering the accuracy.
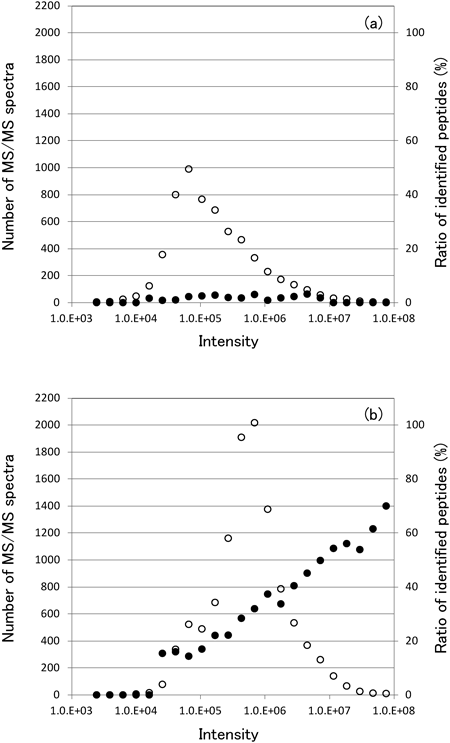
The identification of native peptides in plasma/serum is fundamental and unavoidable problem. To determine why identifying peptides in plasma/serum is challenging, we analyzed TMTzero-labeled tryptic peptides from rat liver using the same LC-MS/MS method used for the analysis of native peptides in plasma. The total concentration of peptides of the rat liver sample was almost the same as that of the native peptide of plasma sample. Only 115 (1.8%) of 6,375 MS/MS spectra were identified in a 2-h LC-MS/MS analysis of the plasma peptide sample, compared with 3,322 (30.3%) of 10,961 MS/MS spectra identified in the rat liver sample. The distribution of precursor ion intensity and the ratio of peptides identified for precursor ions at each intensity are calculated and plotted in Fig. 6. In the rat liver sample, the maximum intensity distribution was about 1×10⁶, but in the plasma sample, the maximum intensity distribution was about 7×10⁴, indicating that the ratio of low-abundance peptides was higher in the plasma sample than in the liver sample. The most important difference was observed in the ratio of peptides identified. In the liver sample, the ratio increased as the intensity of precursor ions increased. However, in the plasma sample, the ratio did not increase, even for precursor ions with high intensity. These results suggest that the difficulty in identifying native peptides in plasma/serum is due to the fact that these peptides represent a variety of cleavage products of proteins modulated by various posttranslational modifications. Therefore, it is stochastically difficult to lower the false discovery rate because of the analytic challenges posed by the enormous variety in plasma/serum peptide lengths and modifications, even when employing mass spectrometers capable of high-resolution and high-accuracy analyses. Therefore, it is essential to discover and validate potential candidate biomarker peptides prior to identification. Candidate peptides should then be identified using higher resolution MS/MS analysis or an electron-transfer dissociation technique combined with de novo sequencing software.
CONCLUSION
Native peptides in plasma/serum are some of the most interesting targets in biomarker discovery research, and it is generally held that many bioactive peptides have yet to be discovered. However, plasma/serum native peptides are also extremely difficult to analyze in detail. In the present study, we established a strategy combining two stable-isotopic-tag methods. In the discovery phase of the study, the method involving isobaric tags was shown to provide high-accuracy quantitative analyses with high sensitivity. The detection limit for quantitative analysis in this method is 10 pM, an extremely high sensitivity that enables the analysis of bioactive peptides from less than 10 μL of plasma. Furthermore, using almost 80 plasma samples, we demonstrated the possibility that even unidentified potential candidate biomarker peptides can be verified using the DM labeling method. The strength of this strategy is the use of isotope tag technologies, which make it possible to explore the deeper peptidome zone with equal accuracy by incorporating additional separation technologies. We believe this strategy will play a prominent role in the discovery of novel bioactive biomarker peptides that are indicative of the primary stages of diseases.
Acknowledgements
This study was supported in part by a Grant-in-Aid for Scientific Research (B) (22390117), Grant-in-Aid for Exploratory Research (23659305, 26640115), a Grant-in-Aid for JSPS Fellows (23·10925), and MEXT Supported Program for the Strategic Research Foundation at Private Universities.
REFERENCES
- 1) N. L. Anderson, N. G. Anderson. The human plasma proteome: History, character, and diagnostic prospects. Mol. Cell. Proteomics 1: 845–867, 2002.
- 2) I. Finoulst, M. Pinkse, W. Van Dongen, P. Verhaert. Sample preparation techniques for the untargeted LC-MS-based discovery of peptides in complex biological matrices. J. Biomed. Biotechnol. 2011: 245291, 2011.
- 3) J. Villanueva, D. R. Shaffer, J. Philip, C. A. Chaparro, H. Erdjument-Bromage, A. B. Olshen, M. Fleisher, H. Lilja, E. Brogi, J. Boyd, M. Sanchez-Carbayo, E. C. Holland, C. Cordon-Cardo, H. I. Scher, P. Tempst. Differential exoprotease activities confer tumor-specific serum peptidome patterns. J. Clin. Invest. 116: 271–284, 2006.
- 4) K. Sogawa, M. Satoh, Y. Kodera, T. Tomonaga, M. Iyo, F. Nomura. A search for novel markers of alcohol abuse using magnetic beads and MALDI-TOF/TOF mass spectrometry. Proteomics Clin. Appl. 3: 821–828, 2009.
- 5) A. Bouamrani, Y. Hu, E. Tasciotti, L. Li, C. Chiappini, X. Liu, M. Ferrari. Mesoporous silica chips for selective enrichment and stabilization of low molecular weight proteome. Proteomics 10: 496–505, 2010.
- 6) S. Taneja, I. Ahmad, S. Sen, S. Kumar, R. Arora, V. K. Gupta, R. Aggarwal, K. Narayanasamy, V. S. Reddy, S. Jameel. Plasma peptidome profiling of acute hepatitis E patients by MALDI-TOF/TOF. Proteome Sci. 9: 5–17, 2011.
- 7) F. Nomura, T. Tomonaga, K. Sogawa, T. Ohashi, M. Nezu, M. Sunaga, N. Kondo, M. Iyo, H. Shimada, T. Ochiai. Identification of novel and downregulated biomarkers for alcoholism by surface enhanced laser desorption/ionization-mass spectrometry. Proteomics 4: 1187–1194, 2004.
- 8) K. Sogawa, S. Itoga, T. Tomonaga, F. Nomura. Diagnostic values of surface-enhanced laser desorption/ionization technology for screening of habitual drinkers. Alcohol. Clin. Exp. Res. 31(Suppl.): S22–S26, 2007.
- 9) K. Honda, Y. Hayashida, T. Umaki, T. Okusaka, T. Kosuge, S. Kikuchi, M. Endo, A. Tsuchida, T. Aoki, T. Itoi, F. Moriyasu, S. Hirohashi, T. Yamada. Possible detection of pancreatic cancer by plasma protein profiling. Cancer Res. 65: 10613–10622, 2005.
- 10) Y. Kawashima, T. Fukutomi, T. Tomonaga, H. Takahashi, F. Nomura, T. Maeda, Y. Kodera. High-yield peptide-extraction method for the discovery of subnanomolar biomarkers from small serum samples. J. Proteome Res. 9: 1694–1705, 2010.
- 11) T. Saito, Y. Kawashima, S. Minamida, K. Matsumoto, K. Araki, T. Matsui, M. Satoh, F. Nomura, M. Iwamura, T. Maeda, S. Baba, Y. Kodera. Establishment and application of a high-quality comparative analysis strategy for the discovery and small-scale validation of low-abundance biomarker peptides in serum based on an optimized novel peptide extraction method. J. Electrophoresis 57: 1–9, 2013.
- 12) S. Wiese, K. A. Reidegeld, H. E. Meyer, B. Warscheid. Protein labeling by iTRAQ: A new tool for quantitative mass spectrometry in proteome research. Proteomics 7: 340–350, 2007.
- 13) A. Thompson, J. Schafer, K. Kuhn, S. Kienle, J. Schwarz, G. Schmidt, T. Neumann, R. Johnstone, A. K. Mohammed, C. Hamon. Tandem mass tags: A novel quantification strategy for comparative analysis of complex protein mixtures by MS/MS. Anal. Chem. 75: 1895–1904, 2003.
- 14) J. L. Hsu, S. Y. Huang, N. H. Chow, S. H. Chen. Stable-isotope dimethyl labeling for quantitative proteomics. Anal. Chem. 75: 6843–6852, 2003.
- 15) F. L. Greene, D. L. Page, I. D. Fleming, A. Fritz, C. M. Balch, D. G. Haller, M. Morrow. AJCC Cancer Staging Manual, 6th Ed., Springer, New York, 2002, pp. 323–328.
- 16) M. Minami, H. Togashi, M. Sano, T. Endoh, H. Saito, F. Hashimoto, K. Fujita, H. Yasuda, Y. Kuriyamoto, T. Nishino. Plasma bradykinin concentration in patients with cardiovascular diseases. Nippon Yakurigaku Zasshi 82: 159–169, 1983.
- 17) M. Cugno, P. Agostoni, H. R. Brunner, M. Gardinali, A. Agostoni, J. Nussberger. Plasma bradykinin levels in human chronic congestive heart failure. Clin. Sci. (Lond.) 99: 461–466, 2000.
- 18) C. Jr. Blais, A. Adam, D. Massicotte, F. Péronnet. Increase in blood bradykinin concentration after eccentric weight-training exercise in men. J. Appl. Physiol. 87: 1197–1201, 1999.
- 19) H. G. Simões, R. Y. Asano, M. M. Sales, R. A. Browne, G. Arsa, D. Motta-Santos, G. M. Puga, L. C. Lima, C. S. Campbell, O. L. Franco. Type 2 diabetes elicits lower nitric oxide, bradykinin concentration and kallikrein activity together with higher DesArg(9)-BK and reduced post-exercise hypotension compared to non-diabetic condition. PLoS ONE 8: e80348, 2013.