Abstract
The techniques and measurement methods developed in the Environmental Survey and Monitoring of Chemicals by Japan’s Ministry of the Environment, as well as a large amount of knowledge archived in the survey, have led to the advancement of environmental analysis. Recently, technologies such as non-target liquid chromatography/high resolution mass spectrometry and liquid chromatography with micro bore column have further developed the field. Here, the general strategy of a method developed for the liquid chromatography/mass spectrometry (LC/MS) analysis of environmental chemicals with a brief description is presented. Also, a non-target analysis for the identification of environmental pollutants using a provisional fragment database and “MsMsFilter,” an elemental composition elucidation tool, is presented. This analytical method is shown to be highly effective in the identification of a model chemical, the pesticide Bendiocarb. Our improved micro-liquid chromatography injection system showed substantially enhanced sensitivity to perfluoroalkyl substances, with peak areas 32–71 times larger than those observed in conventional LC/MS.
INTRODUCTION
Environmental chemicals are usually present in low concentrations, for example, below the ng/L level in water. These chemicals have variable physicochemical properties and they exist in a variety of matrices, such as water, sediment, soil, biological material, and waste.
In Japan, more than a thousand chemicals have been surveyed by Japan’s Ministry of the Environment, with many testing institutions and researchers cooperating in this effort. The results of the survey and the measurement methods developed have been published every year.1–3) More than a thousand measurement methods have been documented, and a large amount of knowledge and techniques are archived. The practical application of liquid chromatography/mass spectrometry (LC/MS) has been reported since the beginning of the 2000s.4,5)
The author presents the general strategy of a method developed for the LC/MS analysis of environmental chemicals with a brief description, followed by a short discussion of recently developed technologies, such as non-target liquid chromatography/high resolution mass spectrometry (LC/HRMS) and micro-liquid chromatography at 1–5 μL/min of flow rate (micro-LC). In the section on methodology, topics such as searching measurement methods, extraction techniques, interference from matrices on internal standards, and oxidation in air sampling are discussed within the context of a common method development strategy. This is followed by the presentation of a non-target LC/HRMS analysis method using a provisional fragment database with “MsMsFilter,”7) a tool for elucidation of elemental composition. Finally, a micro-LC injection system8) suitable for hydrophobic analyses is discussed.
METHODOLOGY FOR DEVELOPING THE MEASUREMENT METHOD
Research for method developmentPrior to developing the method, current measurement methods were researched. “EnvMethod”3) is one of the most cited measurement method database for environmental chemicals. It includes methods developed within the Environmental Survey and Monitoring program (as well as other monitoring programs), by Japan’s Ministry of the Environment, Japan’s Ministry of Health, Labor and Welfare, and the U.S. Environmental Protection Agency. The database includes various physicochemical properties of its materials, such as the partition coefficient between octanol and water (log P), vapor pressure, acid dissociation constant (pka), and oxidation reduction potential (ORP); hence, even if no applicable method is found for a specific chemical, measurement methods for environmental chemicals with physicochemical properties similar to that of the specific chemical can be obtained.
The extraction efficiency for a substance using a hydrophobic solvent can be estimated by reference to its log P value. In most cases, when the log P of a substance is 2 or higher, it can be efficiently extracted by a hydrophobic solvent such as hexane or dichloromethane. Even if no log P values are available, they can be estimated by computational approaches such as those found in the EPI suite9) and Chem Bio Office (PerkinElmer, Inc., Waltham, MA). However, such computational approaches sometimes return an inaccurate value, so care should be taken with this approach. “WebKis-Plus”10) is a unique chemical substance database covering regulation of law, risk assessment information and concentration level in the environment.
Method developmentUsing the searched measurement methods and physicochemical properties of environmental chemicals, a general scheme for the method development was designed (Fig. 1). The first step in the scheme is to determine the instrument detection limit (IDL),11) which is defined as the minimum concentration or weight of a target chemical that can be detected at a known acceptable error level, e.g. 5%. From the values of the IDL, the sample volume or weight is calculated so that the concentration is above the required method detection limit (MDL),11) which is usually 3–10 times higher than the IDL. Next, a sampling and preservation method is chosen by considering the properties of the chemical, such as its ability to adsorb, biodegradation properties, and oxidation reactivity.
Sample preparation is one of the most crucial steps in a measurement method and consists of extraction, clean-up, and concentration steps. Although a large amount of information can be found in various resources, the author presents only a brief discussion here. For a more in-depth treatment of this topic written in Japanese, the author recommends the Handbook of Toxic Chemical Analysis by Suzuki et al.12)
Liquid–liquid extraction (LLE) and solid phase extraction (SPE) are widely used for non-gaseous environmental samples. The extraction efficiency depends on the level of interaction between the target chemical and the extraction solvent or sorbent. In the LLE process, the molecules of the target chemicals are in water, sediment, soil, waste, or biological samples and can interact with numerous extraction solvent molecules during the extraction. However, in the SPE process, the chemicals can interact only with the surface of the sorbent, and only then if it is not occupied by other molecules. Consequently, LLE is preferred for samples containing a large amount of matrices. Furthermore, LLE is not subject to irreversible loss.
A comparison of SPE and LLE extraction efficiencies for hexabromocyclododecane (HBCD) diastereoisomers from landfill leachate is shown in Table 1.13) HBCDs are brominated flame retardants and are dispersed into plastics, textiles, and other polymers. The gamma HBCD isomer has the highest log P of around 8, and the recovery of this isomer by SPE was the lowest, while its recovery by LLE was 92%. For chemicals with high log P (8 or higher) such as perfluorododecanoic acid and its higher homologues,14) LLE is preferred to SPE. This is most likely due to the irreversible loss characteristic of SPE.
Table 1. Comparison of extraction efficiencies of HBCDs from landfill leachate between solid phase extraction (SPE) and liquid–liquid extraction (LLE).
13) | Sample | Extraction | Spiked/ng/mL | Recovery/% | RSD/% | n |
|---|
| (1) SPE (landfill leachate) |
| α-HBCD | Total | — | 11 | 85 | 16 | 5 |
| Filtrate | SPE | | 73 | | |
| ss | Solvent extraction with acetone | | 13 | | |
| β-HBCD | Total | — | 12 | 67 | 11 | 5 |
| Filtrate | SPE | | 51 | | |
| ss | Solvent extraction with acetone | | 16 | | |
| γ-HBCD | Total | — | 60 | 54 | 8 | 5 |
| Filtrate | SPE | | 37 | | |
| ss | Solvent extraction with acetone | | 17 | | |
| (2) LLE (landfill leachate) |
| α-HBCD | Total | — | 30 | 77 | 9 | 7 |
| Whole | With CH2Cl2 | | 76 | | |
| Residue | With CH2Cl2 | | 2 | | |
| β-HBCD | Total | — | 30 | 88 | 10 | 7 |
| Whole | With CH2Cl2 | | 85 | | |
| Residue | With CH2Cl2 | | 3 | | |
| γ-HBCD | Total | — | 30 | 92 | 10 | 7 |
| Whole | With CH2Cl2 | | 88 | | |
| Residue | With CH2Cl2 | | 4 | | |
A variety of materials for SPE has been developed to collect or separate various kinds of chemicals based upon interactions such as Van der Waals forces, hydrogen bonding, and electrostatic interactions. For further reading about the SPE technique and its application, the author refers the reader to Żwir-Ferenc et al.’s article.15)
For airborne chemicals, sampling and preparation are usually a simultaneous process. Airborne chemicals collected in a vacuum vessel and canister16) are measured by gas chromatography/mass spectrometry (GC/MS). The sorbent and filter material are chosen from a range of potential candidates and are used in combination or singly, sometimes preconfigured on a commercially available SPE cartridge.17) For example, an SPE cartridge containing silica gel impregnated with 2,4-dinitrophenylhydrazine (2,4-DNPH) is used for collecting airborne aldehydes and ketones.18,19) Airborne non-volatile organic chemicals17) such as 5-ring polycyclic aromatic hydrocarbons are collected with quartz, glass, or polytetrafluoroethylene filters. For oxidizable chemicals, surface of sorbent and filter can be reactive sites. In that case, it is expected that impinger and bubbler achieve higher recovery than do sorbent and filter. For example, to sample 4-[(4-aminophenyl)methyl]aniline, which is easily oxidizable during air sampling, air is drawn into an impinger containing a 2% ascorbic acid/methanol solution kept below 10°C without exposure to air.20) Another example is 1,3-diisocyanato-2-methylbenzene,21) which is collected on a glass-fiber filter impregnated with 1-(2-pyridyl)piperazine (1,2-PP) and consequently converted to a stable compound.
Method validationRecovery, MDL, and stability analyses on the preserved sample are necessary to validate a reliable measurement method. A guideline is presented elsewhere11) for the Environmental Survey and Monitoring program. The author briefly discusses the use of an internal standard22) and acknowledges that in the soft ionization experiments, in particular the electrospray ionization (ESI) experiment, much more care is required in selection of this internal standard. Table 2 shows the calibration data using dimethyl amine and dimethyl amine-d6 as the internal standard.23) The peak area of dimethyl amine-d6 is largely suppressed at a native dimethyl amine concentration of 1000 ng/mL. When an isotope labeled chemical is used as the internal standard, ion suppression and ion enhancement by co-eluting chemicals must be taken into account.
Table 2. Internal standard calibration data of dimethyl amine and dimethyl amine-
d6.
23)| Concentration/ng/mL | Peak area | Peak area of STD |
|---|
| Dimethyl amine | Dimethyl amine-d6 | Peak area of I.S. |
|---|
| 0 | 0 | 1579115 | 0 |
| 20.0 | 35339 | 1704568 | 0.0207 |
| 30.0 | 71097 | 1761136 | 0.0404 |
| 50.0 | 110750 | 1739680 | 0.0637 |
| 100 | 181740 | 1710292 | 0.1063 |
| 200 | 370524 | 1632440 | 0.2270 |
| 500 | 671403 | 1525708 | 0.4401 |
| 1000 | 1314380 | 1186619 | 1.1077 |
RECENT DEVELOPMENTS IN LC/MS ANALYSES
Non-target analysis of environmental chemicals by LC/HRMSTo identify unknown chemicals by LC/HRMS, two kinds of approach are commonly used. One is to use an accurate mass spectrometry database such as MassBank,24) and the other is to use structure analysis using accurate mass measurement as presented below. Further detail can be found in the literature.6) For our non-target analysis the accurate tandem mass spectrometry (MS/MS) spectra of 112 chemicals of environmental interest were analyzed to create a provisional small fragment database, which consists of the structural and chemical formulae of 232 precursor ions, 400 product ions, and 172 neutral losses, as well as the relationships between them.
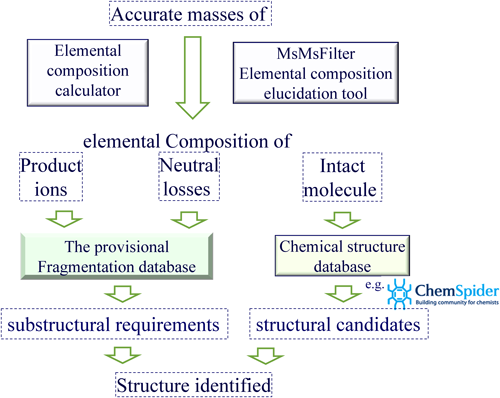
The scheme for the non-target analysis is shown in Fig. 2. First, the elemental compositions of the intact precursor molecule, product ions, and corresponding neutral losses are derived from their accurate masses with an elemental composition calculator and the composition elucidation tool MsMsfilter.25) Then, structural candidates for the intact precursor molecule corresponding to the elemental composition are extracted from a chemical structure database such as ChemSpider.26) Characteristic substructural requirements corresponding to the elemental compositions of the product ions and the corresponding neutral losses are then retrieved from the fragment database. Finally, the candidates that do not fit the substructural requirements are eliminated and the structure is identified.
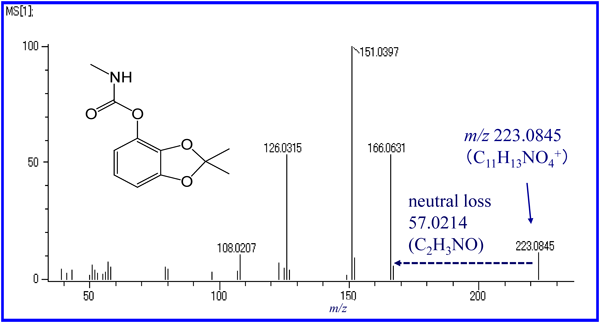
An accurate mass spectrum of Bendiocarb obtained by in-source collisionally induced dissociation (CID) with liquid chromatograph time of flight mass spectrometer (Fig. 3), was used to compare results between the structural analysis presented here and one using MetFrag,27) a well-used structure analysis tool constructed with the fragmentation data of metabolites. Two kinds of structures including Bendiocarb were retrieved by the structure analyses presented here, despite the fact that the neutral loss of C2H3NO was only recognized in our provisional fragment database. However, MetFrag showed Bendiocarb as being 27th place in similarity to 1754 structures taken from “ChemSpider.” Considering that many pharmaceutical products and metabolites are successfully retrieved in environmental surveys28) by MetFrag, it can be said that the success of structural identification by non-target analysis is strongly dependent on the source data of the fragmentation analyzing tool.
Micro-LC/MS for environmental analysisMicro-LC/MS is used for the high-sensitivity analysis of relatively hydrophilic chemicals in proteomics, metabolomics, and genomics. This technique can also contribute to green chemistry, as it requires very small amounts of the organic solvent and sample, thereby reducing waste. Because of the smaller sample capacity in micro-LC, the injection volume should be reduced as compared to that in conventional LC. One commonly used method of achieving an increase in the effective injection volume is the on-column concentration technique,29) in which relatively large volumes of sample, dissolved in a liquid of lower eluting power compared to the eluent, can be injected. However, for highly hydrophobic chemicals and highly hydrophilic chemicals, the on-column concentration technique cannot be applied. In the case of highly hydrophobic chemicals, for example, the chemicals should be dissolved in hydrophilic solvent for on-column concentration, but in such solvent a considerable amount would be lost by adsorption on the sample vessel and the injection lines.
A schematic illustration of a micro-LC injection system for analyses of hydrophobic chemicals is presented in Fig. 4.8,30) The system consists of an MP711 (GL Science, Tokyo) binary micro pump, a micro volume solvent mixer (1 μL), and a Rheodyne 8125 micro injection valve (Rheodyne, CA, USA). The Rheodyne 8125 was installed in the hydrophobic mobile phase line between the binary pump and the micro volume mixer so that the sampling loop contained the hydrophobic solvent exclusively. This made the analytes more miscible with the water-rich mobile phase by mixing the analyte solution at a very low flow rate.
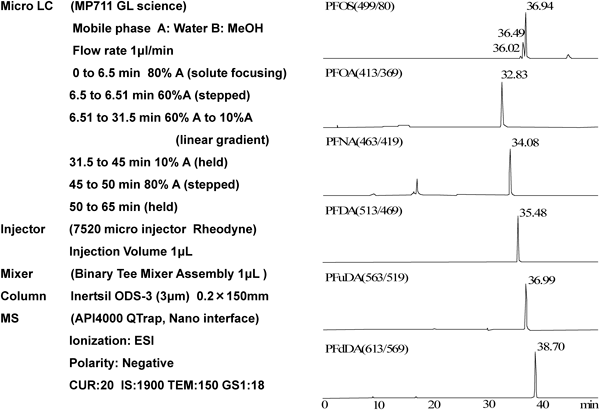
Hydrophobic chemicals such as perfluoroalkyl substances (PFASs) were measured by micro-LC coupled with tandem mass spectrometry (micro-LC-MS/MS) with this micro-LC injection system.30) The selected reaction monitoring (SRM) chromatograms and the measurement conditions are shown in Fig. 5. Symmetrical, narrow peaks are observed for all the PFASs examined. Calibration curves were prepared from 0.3 to 30 ppb standard solutions and analyzed by linear regression, showing good linearity (r2>0.995). By the mechanisms described above, the band of hydrophobic analytes, such as the PFASs, could be focused on the head of the micro-column. Sensitivity to the PFASs was compared between the micro-LC-MS/MS (Inertsil ODS-3 0.2×150 mm; flow rate 1 μL/min) and a conventional liquid chromatography/tandem mass spectrometry (LC-MS/MS) (Zorbax XDB-C18 2.1×150 mm; flow rate 200 μL/min) by using with the same MS/MS instrument.31) Peak areas obtained by the micro-LC-MS/MS were 32 to 71 times larger than those obtained by conventional LC-MS/MS.
Acknowledgements
This research was supported by Grants-in-Aid for Scientific Research (No. 17201020).
REFERENCES
- 1) Ministry of the Environment Government of Japan. “Chemicals in the Environment” Reports on Environmental Survey and Monitoring of Chemicals since 1996. URL: http://www.env.go.jp/chemi/kurohon/en/index.html
- 2) Ministry of the Environment Government of Japan. Measurement Methods for Environmental Survey and Monitoring of Chemicals (in Japanese).
- 3) National Institute for Environmental Studies. “EnvMethod” Database of measurement methods for Environmental Survey and Monitoring of Chemicals since 1975 (in Japanese). URL: http://db-out.nies.go.jp/emdb/
- 4) S. Suzuki et al. in The LC/MS Handbook (in Japanese), Ministry of the Environment Government of Japan. 2000.
- 5) S. Suzuki et al. in The LC/MS guidelines and applications for the Environmental Survey and Monitoring (in Japanese), Ministry of the Environment Government of Japan, 2006.
- 6) S. Suzuki. Non-target analysis of environmental contaminants by LC/Q-ToFMS/MS. Bunseki Kagaku 62: 379–392, 2013.
- 7) S. Suzuki, Y. Ohnishi. “MsMsfilter.exe”. freeware tool for elemental composition elucidation provided on the webs of National Institute for Environmental Studies (URL: http://www.nies.go.jp/msmsf/index.htm) and Environmental Research Institute Inc. Osaka (URL: http://www.eri.co.jp/MsMs/).
- 8) S. Suzuki, Y. Shibata, A. Hasegawa, M. Uebori, Y. Yoshida, M. Yoshikane. Green chemistry analysis of a nano and micro liquid chromatography/mass spectrometry for environmental and waste samples (in Japanese), Report of Grants-in-Aid for Scientific Research, No. 17201020, 2008.
- 9) R. Boethling, P. Howard. Estimation Program Interface (EPI) Suite. U.S. Environmental Protection Agency. URL: http://www.epa.gov/oppt/exposure/pubs/episuitedl.htm
- 10) National Institute for Environmental Studies. “WebKis-Plus” Database of chemicals with information on use, production, emission, monitoring and legal status (in Japanese). URL: http://w-chemdb.nies.go.jp/
- 11) Ministry of the Environment Government of Japan. Guide document of Environmental Survey and Monitoring of Chemicals (FY2008 Ed., in Japanese). Mar. 2009. URL: www.env.go.jp/chemi/anzen/chosa/tebiki-h20.pdf
- 12) S. Suzuki, A. Hasegawa, M. Uebori, Y. Yoshida, Y. Ishii Eds. in The Handbook of Toxic Chemical Analysis (in Japanese), ISBN978-4-254-140, Asakura Publ., Tokyo, 2014.
- 13) S. Suzuki, A. Hasegawa. Determination of hexabromocyclododecane diastereoisomers and tetrabromobisphenol A in water and sediment by liquid chromatography/mass spectrometry. Anal. Sci. 22: 469–474, 2006.
- 14) K. Sasaki, K. Yaegashi, A. Kikuchi. Perfluorododecanoic acid (PFDoA), Perfluorotetradecanoic acid (PFTeDA) and Perfluorohexadecanoic acid (PFHxDA) in water, Measurement Methods for Environmental Survey and Monitoring of Chemicals (FY2009, in Japanese), Ministry of the Environment Government of Japan. 756–775, 2010.
- 15) A. Żwir-Ferenc, M. Biziuk. Solid phase extraction technique—Trends, opportunities and applications. Pol. J. Environ. Stud. 15: 677–690, 2006.
- 16) U.S. Environmental Protection Agency. Determination of Volatile Organic Compounds (VOCs) in Ambient Air Using Specially Prepared Canisters with Subsequent Analysis by Gas Chromatography, Compendium of Methods for the Determination of Toxic Organic Compounds in Ambient Air (2nd Ed.). EPA/625/R-96/010b, 1999.
- 17) T. J. Kelly, R. Mukund, S. M. Gordon, M. A. Hays. in Ambient Measurement Methods and Properties of the 189 Title 3 Hazardous Air Pollutants, U.S. Environmental Protection Agency. Mar. 1994.
- 18) U.S. Environmental Protection Agency. Determination of Formaldehyde in Ambient Air Using Adsorbent Cartridge Followed by High Performance Liquid Chromatography (HPLC), Compendium of Methods for the Determination of Toxic Organic Compounds in Ambient Air (2nd Ed.). EPA/625/R-96/010b, 1999.
- 19) Ministry of the Environment Government of Japan. LC/MS measurement of carbonyl group chemicals, LC/MS methodology for developing measurement methods of environmental chemicals. 112–122, 2000.
- 20) K. Watanabe, K Hisatani. 4,4′-Diaminodiphenylmethane in ambient air, Measurement Methods for Environmental Survey and Monitoring of Chemicals (FY2009, in Japanese), Ministry of the Environment Government of Japan. 593–616, 2010.
- 21) A. Hasegawa. 2-Methyl-1,3-phenylene Diisocyanate (2,6-TDI) and 4-methyl-1,3-phenylene Diisocyanate (2,4-TDI) in ambient air, Measurement Methods for Environmental Survey and Monitoring of Chemicals (FY2010, in Japanese), Ministry of the Environment Government of Japan. 577–591, 2011.
- 22) C. Blank. Environmental measurement—Glossary of terms. U.S. Environmental Protection Agency. Jan. 11, 2010. URL: http://www.epa.gov/fem/pdfs/Env_Measurement_Glossary_Final_Jan_2010.pdf
- 23) I. Houwa, T. Konishi. Dimethyl amine and trimethyl amine in air, Measurement Methods for Environmental Survey and Monitoring of Chemicals (FY2010, in Japanese), Ministry of the Environment Government of Japan. 449, 2011.
- 24) H. Horai, M. Arita, S. Kanaya, Y. Nihei, T. Ikeda, K. Suwa, Y. Ojima, K. Tanaka, S. Tanaka, K. Aoshima, Y. Oda, Y. Kakazu, M. Kusano, T. Tohge, F. Matsuda, Y. Sawada, M. Y. Hirai, H. Nakanishi, K. Ikeda, N. Akimoto, T. Maoka, H. Takahashi, T. Ara, N. Sakurai, H. Suzuki, D. Shibata, S. Neumann, T. Iida, K. Tanaka, K. Funatsu, F. Matsuura, T. Soga, R. Taguchi, K. Saito, T. Nishioka. A public repository for sharing mass spectral data for life sciences. J. Mass Spectrom. 45: 703–714, 2010. http://www.massbank.jp/
- 25) S. Suzuki, T. Ishii, A. Yasuhara, S. Sakai. Method for the elucidation of the elemental composition of low molecular mass chemicals using exact masses of product ions and neutral losses: Application to environmental chemicals measured by liquid chromatography with hybrid quadrupole/time-of-flight mass spectrometry. Rapid Commun. Mass 19 (Spec.): 3500–3516, 2005.
- 26) Royal Society of Chemistry. “ChemSpider.” URL: http://www.chemspider.com/
- 27) S. Wolf, S. Schmidt, M. Müller-Hannemann, S. Neumann. In silico fragmentation for computer assisted identification of metabolite mass spectra. BMC Bioinformatics 11: 148, 2010. http://c-ruttkies.github.io/MetFrag/
- 28) H. Singer, M. Ruff, M. Loos, P. Longrée, J. Hollender. Target and non-target screening of organic contaminants in environmental samples using the Orbitrap, Swiss Federal Institute of Aquatic Science and Technology, 7th Annual LC/MS/MS Workshop on Environmental Applications and Food Safety, Jun. 13–14, 2011, Buffalo, NY.
- 29) H. A. Claessens, M. A. J. Kuyken. A comparative study of large volume injection techniques for microbore columns in HPLC. Chromatographia 23: 331–336, 1987.
- 30) S. Suzuki, A. Hasegawa, M. Uebori, Y. Yoshida, Y. Shibata, M. Yoshikane. Solute Focusing Technique and Ionization Method by Excited Argon for Analyzing Highly Hydrophobic Compounds of Environmental Interest by Micro Liquid Chromatography/Mass Spectrometry, 10th International Symposium on Hyphenated Techniques in Chromatography and Separation Technology, Bruges, Belgium, Jan. 2008.
- 31) M. Yoshikane, Y. Shibata. in The Report of Grants-in-Aid for Scientific Research, No. 17201020, 69–74, 2008.