INTRODUCTION
Mass spectrometry (MS) imaging is widely used for the analysis of biological tissues in the fields of life sciences and pharmaceuticals. The important requirements for MS imaging include achieving desorption/ionization of target samples on a surface as locally as possible. Matrix-assisted laser desorption/ionization (MALDI) has been applied as a powerful ionization technique for MS imaging in the analysis of histological sections of biological tissues.1) However, since MALDI is operated under vacuum conditions, the sample preparation is less convenient for MS imaging. Recently, a number of ambient ionization methods have been developed to allow MS imaging for the direct examination of unmodified samples in the open environment. These methods have been reviewed for many different applications.2) In 2004, the Cooks group developed desorption electrospray ionization (DESI) as an ambient ionization method.3) DESI utilizes both a charged solvent applied with high voltage and a high-pressure nebulizing gas for sampling/ionization. Charged droplets of solvent, sprayed toward the sample surface, cause local desorption and ionization of the sample under atmospheric pressure. The ions generated by DESI are introduced via a mass spectrometer inlet and are then analyzed. As the sampling (desorption) and ionization occur within a short period of time, DESI is classified as a “single-step” ionization method. The capabilities of DESI-MS imaging have been demonstrated by several studies.4–8) Generally, the spatial resolution of DESI-MS imaging is relatively low due to the use of nebulizing high-pressure nitrogen gas (ca. a few 100 μm on average, and 35 μm at best).9) After the DESI method was reported, Nano-DESI,10,11) liquid micro junction-surface sampling probe (LMJ/SSP),12) and liquid extract surface analysis (LESA) were also introduced as new ambient ionization methods.13) In 2007, another two-step method called probe electrospray ionization (PESI) was reported by the Hiraoka group.14) Their method uses a sharp solid needle to pick up and ionize the sample. After the needle makes contact with the sample surface, it is positioned adjacent to the MS inlet orifice, and a high potential is applied to the needle for electrospray ionization (ESI). PESI for MS imaging is performed at a lateral resolution of about 60 μm with a moving needle and sample stage.15,16)
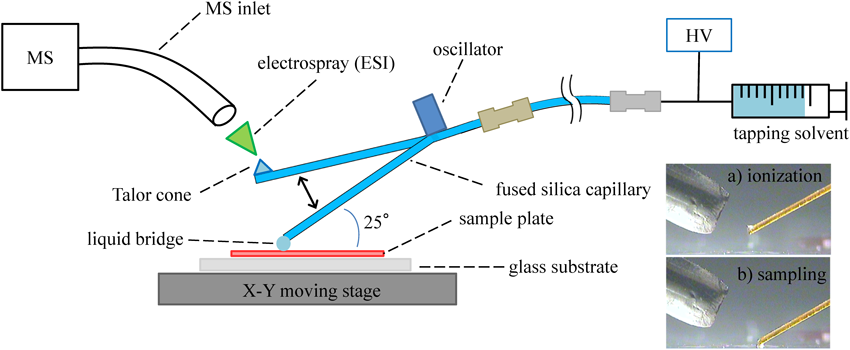
In 2012, Otsuka et al. developed tapping-mode scanning probe electrospray ionization (t-SPESI).17,18) This novel ambient sampling/ionization method is based on ESI. The t-SPESI method involves sampling/ionization using an oscillating capillary probe that is controlled with a piezo actuator. The probe in which the high-voltage applied solvent flows is set to oscillate between the sample surface and the mass spectrometer inlet. When the probe tip makes contact with the sample surface, the sample is extracted into the solvent and is then electrosprayed from the probe tip as it approaches the inlet. Since the one oscillating capillary probe works for both sampling and ESI, t-SPESI has potential for local and sensitive ionization. Moreover, another advantage of this method is that a nebulizer gas is not needed. Thus, t-SPESI can ionize an analyte in the micro region and thereby improve spatial resolution for MS imaging. In 2014, the Van Berkel group further advanced the t-SPESI system by employing tapered-tip fused silica capillaries with a 20 μm internal diameter, in order to minimize the probe-to-surface liquid junction size and thereby improve spatial resolution. Imaging of the lipids in mouse brain tissue under optimized conditions provided a spatial resolution of approximately 35 μm based on the ability to distinguish between features observed both in the optical and the mass spectral chemical images.19)
In the present study, we demonstrate the use of the t-SPESI system for MS imaging of industrial materials. The optimization of operating parameters, particularly solvent composition, solvent flow rate, and step-size is carried out for t-SPESI-MS imaging. Pigment separation employing TLC and model samples of adhesive tapes and polymer sheets with UV degradation are used for MS imaging, to attain approximately 100 μm spatial resolution.
EXPERIMENTAL
ReagentsThe solvents used in this experiment were HPLC grade (Wako Pure Chemical Industries, Ltd., Osaka, Japan). Pure water was obtained from an automatic water distillation apparatus RFD250NB (Advantec, Tokyo, Japan). Saccharides including glucose, maltose, maltotriose, lactose, sucrose and cyclodextrin, and Rhodamine 123, Rhodamine B, and Crystal Violet dyes were purchased from Wako Pure Chemical Industries, Ltd. Perfluorooctanesulfonic acid (PFOS) was obtained from Fluka Chemie AG (Basel, Switzerland). Synthetic polyethylene glycol (PEG, end groups of -OCH3 and -H) with an average molecular weight of 2000 was used. Polystyrene (PS) and Nylon66 (PA66) were purchased from Sigma-Aldrich (St. Louis, MO, USA), and polymethyl methacrylate (PMMA) was obtained from Wako Pure Chemical Industries, Ltd. Irganox1098 was from BASF (Ludwigshafen, Germany). Glass slides (110201) were from Muto Pure Chemicals (Tokyo, Japan). TLC plates were hydrophobic RP-8 5065-32070 (Merck, Darmstadt, Germany) and hydrophilic Silica gel 70 F254 193-08401 (Wako Pure Chemical Industries, Ltd.). Adhesive tape for MS imaging was obtained from Sekisui Chemical (Tokyo, Japan).
t-SPESI-MSThe operation of t-SPESI is schematically illustrated in Fig. 1. A fused-silica capillary tube (50 μm i.d. and 150 μm o.d.) served as an oscillating probe. The capillary tube was positioned to tap the sample surface employing an oscillator device set at a distance of 3 cm from the capillary tip. The angle between the surface and the probe was set to 25°. The other end of the capillary was connected to a syringe pump. High-voltage applied solvent (called tapping solvent) was continuously supplied through the capillary probe. The flow rate of the tapping solvent was controlled by the syringe pump, and high voltage was applied to the syringe needle. MS was performed with a triple quadrupole mass spectrometer TSQ (ThermoFisher Scientific, Waltham, MA, USA). The 10 cm in length ion-extraction tube (stainless steel tube, 1.6 mm o.d. and 1.0 mm i.d.) was connected to the heated capillary of the TSQ inlet with a home-made metal connector. The capillary temperature was 300°C. Data accumulation was carried out in positive and negative ion modes under high voltage conditions of the tapping solvent, +4.5 and −4.5 kV. The formation of a liquid bridge and Taylor cone at the probe tip was observed with a microscope camera GR-i68c (Syodensya, Osaka, Japan), as shown in Fig. 1. The chromatogram representing the time variation in ion abundance was analyzed employing Xcalibur software (Thermo Fisher Scientific). The tapping probe was vibrated at 100 Hz using a bimorph type oscillator FBL28452HS (Fuji Ceramics, Shizuoka, Japan). The moving stage system of the sample plate was built with two actuators, XA-E35L-50 (SUS Corp., Shizuoka, Japan), to move in the XY-axis direction with a step size of 0.10 mm. The imaging distribution was obtained using MassListWriter (ThermoFisher Scientific) and Excel (Microsoft, Redmond, WA, USA).
RESULTS AND DISCUSSION
1) Optimization of the tapping solventAddition of formic acidThe tapping capillary probe plays roles in both the formation of the liquid bridge on the surface (sampling process) and ionization near the MS inlet (ESI process). Therefore, ion abundances are highly dependent on the solvent continuously flowing through the tapping probe. The solvent effect of formic acid on ion abundances was studied using TLC plates. An aliquot of 1 μL methanol solution of Rhodamine 123 (the structure is shown in Fig. 5a) was dried on the silica-gel TLC plate and measured by t-SPESI-MS. It took about 3 sec after the starting of probe oscillation to detect the ion of Rhodamine 123, [M−Cl]+ (m/z=345), which corresponds to a tapping number of 210. Since Rhodamine 123 is strongly adsorbed to the silica-gel plate and the methanol solvent completely penetrates the TLC plate, long sampling time is needed for extracting the dye through the liquid bridge.
The formic acid concentrations of the methanol solution were varied with 0, 0.01, 0.1, and 1% v/v in order to monitor after the capillary probe began to tap on the TLC plate. As the formic acid concentration increased, the ion appearance time of Rhodamine 123, [M−Cl]+ decreased with ca. 2.8, 1.7, 1.0, and 0.2 sec (number of taps; 196, 119, 70, and 14) and the ion abundance itself increased. Since formic acid affects the affinity of the tapping solvent and the TLC plate, it was considered that the higher the concentration, the more efficiently Rhodamine 123 was extracted from the TLC plate. However, the ion abundances of [M−Cl]+ as represented by the S/N ratio were almost constant at 12, 12, 14, and 13 for the concentrations of formic acid, respectively. It indicated that the ion abundances of both [M−Cl]+ and background ions increased with the formic acid concentration. The background ions are probably originated from the TLC plate. As a result, the concentration of 1% formic acid for methanol solution was the shortest ion appearance time, determining the optimal tapping solvent of the dyes for the TLC plate.
Flow rateThe tapping spot area corresponding to spatial resolution for t-SPESI is changed by the flow rate of the tapping solvent. The higher the flow rate, the greater is the amount of solvent flowing from the probe tip, extending the area of the liquid bridge. To obtain a clear MS image, the spatial resolution should be as high as possible. The model plate of Rhodamine 123 was prepared as shown in Fig. 2; 1 μL of the methanol solution of Rhodamine 123 was allowed to drop onto the RP-8 TLC plate and then dried in air. The Rhodamine 123 sample was 5–6 mm in diameter. The tapping spot area from which Rhodamine 123 was extracted by t-SPESI was observed with a microscope to examine the relationship between the flow rate and the diameter of the tapping spot. The results showed that the spot diameters were 50–75, 100–125, 150–175, and 200–225 μm for the flow rates of 0.1, 0.2, 0.3, and 0.4 μL/min, respectively (Fig. 2). As stable ion abundance was not obtained at the low flow rate of 0.1 μL/min due to unstable ESI, the flow rate of 0.2 μL/min was employed for MS imaging. The step size of the two-dimensional automatic stage was set to 0.10 mm, since the spot diameter for this flow rate is 100–125 μm. The ion detection limit of Rhodamine 123 on the model plate was 100 fmol/1 μL using the S/N ratio ≥3. The diameters of the sample area and tapping spot were 5.0 mm and 0.17 μm, respectively, based on optical microscope observation. Therefore, the limit of detection (LOD) for t-SPESI was 0.04–0.25 fmol per tapping spot.
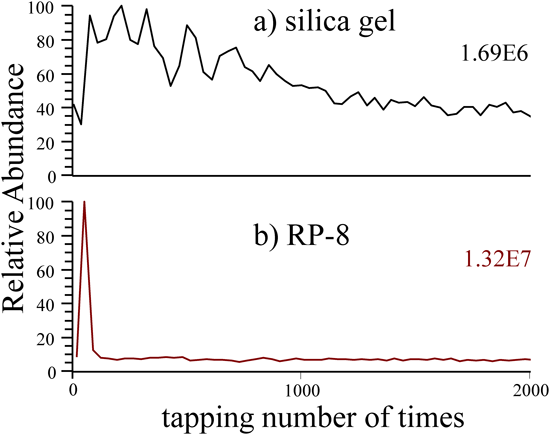
Change in ion abundance with tapping timesThe change in the ion abundance of Rhodamine B, [M−Cl]+ (m/z=443), with tapping times is shown in Fig. 3, when the tapping position was fixed and methanol containing 1% formic acid was used as the tapping solvent. Although the ions on the silica-gel plate (a) were detected over a long period of tapping, those on the RP-8 plate of the reverse phase (b) were detected within a short period of tapping. The polarity of the silica-gel plate is higher than that of the RP-8 plate. Since Rhodamine B is more strongly adsorbed to the silica-gel plate than to the RP-8 plate, it is considered to take time for Rhodamine B to dissolve in the tapping solvent. In contrast, the RP-8 plate with its low polarity allows Rhodamine B to rapidly dissolve in the solvent.
Solvent selectionTo detect additives in polymer films, THF solutions for PS and PMMA and HFIP solution for PA66 containing the antioxidant Irganox1098 (2.0 wt%) were prepared. An aliquot of 1 μL sample solution was dropped onto a stainless steel plate and allowed to dry. Methanol, acetonitrile, acetonitrile/THF (50/50, v/v) and acetonitrile/HFIP (50/50, v/v) solutions containing 100 μM NaI were used as the tapping solvents.
The ion abundances of Irganox1098 contained in the polymer films were detected with each tapping solvent as shown in Fig. 4. Their ion abundances varied greatly depending on the combination of tapping solvent and polymer film. Overall, the additive ion was detected at low abundance using methanol as the tapping solvent. The AN/THF solvent for PS and PMMA and the AN/HFIP solvent for PA66 yielded the highest ion abundances. The affinity between tapping solvent and the polymer film is an important factor for t-SPESI-MS analysis of additives in polymers. Thus, the same mass chromatograms as in Fig. 3, indicating the relationship between the ion abundance of Irganox1098 and the number of taps at the fixed spot position, were analyzed. The number of taps (length of time) needed to detect the ions after starting was minimal for methanol solvent, while the more number of taps were required for the AN/THF and AN/HFIP solvents. Methanol can dissolve Irganox1098, but not PS, PMMA or PA66 film. Thus, methanol is considered to extract only the additives limited to the surface of the polymer film. Since PS and PMMA are highly soluble in AN/THF, the additives existing not only on the surface but also under the film are assumed to be extracted by t-SPESI. As a remarkable example of the utility of the AN/HFIP solvent, it showed the highest ion abundance of the additive among the four solvents, because PA66 is only soluble in AN/HFIP.
2) t-SPESI mass spectraSlide-glass plateAqueous solutions of the six saccharides (1 mM) and three dyes (0.01 mM), as well as methanol solutions of PEG (5 mg/mL) and PFOS (0.01 mM), were dropped with 1 μL of each of the solutions on a glass slide. These were then dried under reduced pressure and analyzed by t-SPESI-MS. Methanol (100 μM NaI) or methanol/formic acid (1% v/v) solution was used as the tapping solvent and the flow rate was 0.3 μL/min.
The results are summarized in Table 1. Singly and doubly-charged ions were detected in the PEG mass spectra. With the t-SPESI method, the sample is dissolved into the solvent in the probe tip, followed by ESI. Therefore, the ionization process is basically similar to ESI. The multiply charged ions of [M+nH]n+ (n=3–5) were also observed in the mass spectrum of insulin (50 nM)17) as well as that of PEG.
Table 1. Analysis of various samples by t-SPESI-MS.
| Sample | Amount of samplea) (nmol) | Detected ion species (m/z) | Ion abundance |
|---|
| Glucose | 1 | [M+Na]+: 203 | 1.1E5 |
| Maltose | 1 | [M+Na]+: 365 | 9.3E5 |
| Maltotriose | 1 | [M+Na]+: 527 | 4.0E5 |
| Lactose | 1 | [M+Na]+: 365 | 7.1E5 |
| Sucrose | 1 | [M+Na]+: 365 | 4.6E5 |
| Cyclodextrin | 1 | [M+Na]+: 1157 | 5.7E4 |
| Rhodamine 123 | 0.01 | [Cation]+: 345 | 8.1E5 |
| Rhodamine B | 0.01 | [Cation]+: 372 | 9.9E5 |
| Crystal Violet | 0.01 | [Cation]+: 443 | 6.2E5 |
| PFOS | 0.01 | [M−H]−: 499 | 2.9E4 |
| PEG | 2.5 | [M+Na]+ | 9.6E4 |
a) A 1 μL of each of the solutions was dropped onto a glass slide and then dried under reduced pressure; the concentration is 1 mM for the saccharides, 5 mg/mL for PEG and 0.01 mM for the dyes and PFOS.
A 1 μL equimolar solution of three dyes, each of 0.33 mM, was separated with silica-gel and RP-8 TLC. The chloroform/methanol solution (5/1, v/v) was used for the silica-gel plates, and the methanol/water/chloroform/acetic acid solution (5/1.5/1/0.5) for the RP-8 plates. The t-SPESI mass spectra of each dye spot in the developed TLCs were analyzed. The three dyes were well separated with both of the TLC plates. In the silica-gel plate (Fig. 5a), retention factor (RF) values of the dyes increased in the order of Rhodamine 123 (A)<Rhodamine B (B)<Crystal Violet (C). However, the RF values for the RP-8 plate were in the reverse order.
The t-SPESI and DESI mass spectra of each dye spot developed with the silica-gel TLC are shown Figs. 5b and 5c. In the t-SPESI mass spectra, each ion of the three dyes could be detected with high sensitivity for both the silica gel and the RP-8 plates. However, in the DESI mass spectra the Crystal Violet ion was not detected by the silica-gel TLC which has high polarity. We attempted to extract the spot with methanol and to detect the Crystal Violet ion by ESI-MS, but failed to detect it. It is probably because Crystal Violet decomposed during the development or was strongly adsorbed to the silica-gel TLC plate. However, the decomposition products on the spot were not identified. Therefore, Crystal Violet was enough strongly adsorbed to the TLC plate to be undetected by DESI, but to be detected by t-SPESI. With the DESI method, a nebulizer gas (N2 gas) is used to spray the solvent into a sample and the sample then dissolves into the charged micro-droplet of the solvent under atmospheric pressure. Therefore, the flow rate of the solvent in DESI is more than 10 times that in t-SPESI. A characteristic of t-SPESI, as compared to DESI, is that a lower flow rate can achieve more efficient ionization in a narrow area. Thus, t-SPESI is potentially applicable to MS imaging of TLC plates.
3) MS imagingTLCThe t-SPESI-MS imaging of RP-8 TLC for the equimolar dye solution is shown in Fig. 6. The imaging area was 40 mm×0.7 mm with a step size of 0.1 mm. Since the measured time at each position was set at 5 sec, it took ca. 250 min to obtain the image of this area. As shown in an optical image of the separated TLC (Fig. 6b) and in the first scan of the imaging graph obtained from the m/z 372 ion of Crystal Violet (Fig. 6c), the tailing of the ion abundance results from the TLC distribution of Crystal Violet. In addition, the t-SPESI images of each dye are shown in Fig. 6d. We determined the location of each dye visually after TLC separation. However, even if not confirmed visually or in color, t-SPESI-MS imaging can determine the separate positions on TLC and their mass simultaneously.
Adhesive tapeA model sample plate in which commercially available adhesive tapes (2 mm wide) were spaced at a 2 mm interval was prepared on a slide glass for MS imaging. The formic acid (1%) solutions of methanol and acetonitrile/THF (1/1, v/v) were used as tapping solvents. MS imaging of the model plate is shown in Fig. 7a. Unidentified ions of m/z 642 were very abundant with the acetonitrile/THF solvent, but were undetectable with methanol. When the MS image of the m/z 642 ion is superimposed onto the optical image, the m/z 642 ion is detected only from the adhesive tape surface. In addition, there was no carry-over and the signal distribution of m/z 642 was homogeneous over the entire surface of the tape. In this way, we found that if the solvent is properly selected, additive components can be extracted from the material surface to allow MS imaging of industrial materials.
Polymer filmA PMMA film containing Irganox1098 was allowed to degrade so as to form stripes with UV irradiation to prepare the model film for MS imaging (Fig. 7b). The PMMA film was obtained employing a spin-coating process. PMMA containing 1.0 wt% of Irganox1098 was dissolved in PGME solvent. Then, 400 μL of the PMMA solution were dropped onto a slide glass to be applied for 30 sec at 600 rpm to a spin coater (MS-A150, MIKASA Co., Ltd., Hiroshima, Japan), and finally dried. This model film was UV-irradiated in stripes for 30 min with a mercury lamp (PL16-110, Sen Lights Co., Osaka, Japan) using a stainless steel mask with evenly spaced slits. The resulting PMMA model film had, due to the UV irradiation, stripes with a width of 1.0 mm at the interval of 1.0 mm. The t-SPESI was analyzed with 3 sec of tapping at each spot, 10 mm×150 mm in area, and with a 0.2 μL/min flow rate. The 1 mM NaI solution of acetonitrile/THF (50/50, v/v) was used as the tapping solvent. The data accumulation was performed in a positive ion mode.
The resulting MS imaging results are consistent with the stripe pattern of discoloration due to UV irradiation. In the UV-irradiated portions of the model film, the Irganox1098 ion of [M+Na]+, m/z=659, was undetectable due to photo-degradation, but was detected in the non-irradiated portions. The optical discoloration pattern due to UV irradiation was actually consistent with the MS imaging pattern without the m/z=659 ion. This observation shows that MS imaging of the additive was achieved by t-SPESI-MS.