Review
Exposure Marker Discovery of Phthalates Using Mass Spectrometry
2017 Volume 6 Issue 2 Pages S0062
Details
2017 Volume 6 Issue 2 Pages S0062
Phthalates are chemicals widely used in industry and the consequences on human health caused by exposure to these agents are of significant interest currently. The urinary metabolites of phthalates can be measured and used as exposure markers for the assessment of the actual internal contamination of phthalates coming from different sources and absorbed by various ways. The purpose of this paper is to review the markers for exposure and risk assessment of phthalates such as di-methyl phthalate (DMP), di-ethyl phthalate (DEP), di-butyl phthalate (DBP), benzylbutyl phthalate (BBP), di-(2-ethylhexyl)phthalate (DEHP), di-(2-propylheptyl)phthalate (DPHP), di-iso-nonyl phthalate (DINP), di-n-octyl phthalate (DnOP) and di-iso-decyl phthalate (DIDP), and introduction of the analytical approach of three metabolomics data processing approaches that can be used for chemical exposure marker discovery in urine with high-resolution mass spectrometry (HRMS) data.
Phthalates are chemicals widely used in industry and the consequences on human health caused by exposure to these agents are of significant interest currently. The urinary metabolites of phthalates can be measured and used as exposure markers for the assessment of the actual internal contamination of phthalates coming from different sources and absorbed by different ways. The purpose of this paper is to review the markers for exposure and risk assessment of phthalates and the mass spectrometry methods for exposure marker discovery.
Phthalates are a group of synthetic industrial chemicals that are widely used in plastics, building materials, personal care products, children’s toys, food packaging, cosmetics/beauty products, and medical products.1–4) Because of their widespread use and biological effects in animals, phthalates were included in the list of regulated (priority) pollutants by the US Environmental Protection Agency and the European Union.5) Phthalates are easily released from plastic products because phthalates are not chemically bond to plastic products.6,7) Due to the high consumption of phthalates, humans are exposed to phthalates from a wide range of consumer products.8,9) Phthalates are considered ubiquitous compounds to which humans are frequently exposed. Ingestion, inhalation, intravenous injection, and skin absorption are potential routes of exposure to phthalates.10,11) Phthalate ingestion may occur via food, including taking pharmaceuticals, nutritional supplements, and other mouthing objects. Indoor air and dust containing phthalates released from plasticized components may be inhaled.12,13) Leaching of phthalates from medical device varies with lipid content, temperature, storage time and agitation which can cause phthalates exposure in intravenous injection.14) Skin may come into direct contact with phthalate-containing products.15) Phthalates such as di-n-butyl phthalate (DBP) and di-(2-ethylhexyl)phthalate (DEHP) are endocrine disruptors and may affect reproductive outcomes, the development of the male reproductive tract,16–18) and sexual differentiation in male rats.16,19,20) Epidemiological studies have also revealed that exposure to several commonly used phthalates such as DBP and DHEP can alter sex steroid hormone levels in human subjects.21–23)
Phthalates exposure can be through air, food or personal-care products, while entering our system primarily via inhalation, ingestion or dermal absorption.24) The general chemicals exposure assessment can be divided into three techniques, 1. questionnaire, 2. ambient monitoring, 3. biomonitoring.25) Questionnaire is used to investigate personal lifestyle for estimating the exposure of chemicals. Ambient monitoring aims at human exposure assessment by measuring the levels of chemicals in environment, such as air, food and water. Biomonitoring is the assessment of human exposure to chemicals by measuring the chemicals or their metabolites in human urine, blood, serum, saliva, and other body fluids. The advantage of biomonitoring is the assessment of the actual internal contamination of chemicals which can come from different sources and be absorbed in different ways.
The measurement of human metabolites of phthalates is important for the assessment of exposure to phthalates. Metabolites are important indicators of biological processes. The discovery of new metabolites and the determination of their concentration levels may provide insight into disease mechanisms, metabolic pathway interactions, and the metabolism and absorption process of exogenous chemicals. However, the identification of metabolites is often difficult and laborious. The metabolism of chemicals within an organism is extremely complex; it involves multiple pathways, resulting to a range of compounds with varying concentrations.
Mass spectrometry plays a key role in metabolomics research, especially in metabolite detection and identification in a complex matrix. Metabolites within in vivo samples are typically present at very low levels and with a large excess of matrix background. Gas chromatography-mass spectrometry (GC-MS), flow-injection analysis-tandem mass spectrometry (FIA-MS/MS), and high-performance liquid chromatography-tandem mass spectrometry (HPLC-MS/MS)26–33) are ideal for elucidating the structure of detected metabolites. Recently, a variety of high-resolution mass spectrometers (HRMS), such as the quadrupole-time of flight (Q-TOF), the ion trap-time-of-flight (IT-TOF), the linear trap quadrupole-Fourier transform ion cyclotron resonance-mass spectrometer (LTQ-FTICR-MS), and the LTQ-Orbitrap have greatly increased the accuracy and selectivity of mass spectrometry.34–39) Because of their advantages, such as fast scan rate, high mass accuracy, excellent resolution, superior sensitivity, and multiple-stage mass spectrometry scanning (MSn), these mass spectrometers can provide HRMS data for nearly all of the compounds in complex matrix samples with a simple data acquisition method.39,40) HRMS provides ion measurements with high resolution (>10000 at full-width at half-maximum) and accurate mass (<5 ppm deviation) capabilities. This enables the determination of the elemental composition of metabolite ions and their fragments. Despite the complexity of metabolites, the development of HRMS with improved accuracy and stability has improved the quality and productivity of metabolite identification processes.41) However, handling the complex MS dataset is still a challenge in metabolite identification. It is necessary to develop a more rapid and efficient strategy for finding metabolites.
Various methods have been developed to perform objective searching/filtering of accurate-mass-based LC-HRMS data to facilitate metabolite detection, such as isotope pattern filters (IPF),42) mass defect filtering (MDF),35,43) XCMS Online,44) background subtraction,45,46) and knowledge-based metabolic predictions.47) A combination of different analytical technologies and data mining tools is needed to efficiently and thoroughly identify metabolites for discovering the biomarkers of exposure, toxic effects, or diseases. To achieve that, IPF is a stable isotope-based metabolomics approach using compound labeled with 2H, 13C, 15N, or 18O that can be used to facilitate identification of the metabolites.42,48,49) The stable isotope ratio (1 : 1) from spiked native and isotope-labeled compounds were used for metabolite signal detection. The equal response signatures of signal doublets were traced in the MS dataset.50) However, the isotopic ratios of metabolite signals from equal amounts of spiked native and isotope-labeled compounds are not always closed to 1 because of the influences from analytical variations of sample preparation, instrumental analysis, and matrix interference. This is especially true when signal doublet responses are low.51) Setting acceptable tolerance for wanted ratios is still empirical, which results in the challenges while tracing one specific ratio.52)
An additional statistical procedure to assist the conventional isotope-labeling method was reported by Lin et al. in 2010.53) The method coupling a stable isotope ratio with the statistical procedure could enhance the efficiency and confidence of mining metabolite signals in complex LC-MS data. The method used varying native compound mixture with different isotope-labeled concentration ratios incubated with human liver enzymes to generate metabolites and mass measurements to trace the signals of metabolites. Varying isotope concentration ratios of native to stable isotope-labeled compounds in respective samples have been proposed to correlate to their signal responses ratio, which provided higher confidence of mining metabolites signals than the conventional isotope-labeling method. A software package, comprising a signal mining algorithm with isotope tracing (SMAIT), was developed to perform the statistical procedure.53) The SMAIT strategy is shown in Fig. 1. The SMAIT software includes three steps: isotopic pair (IP) finding, IP response ratio (IPRR), and IPRR correlation analysis. IP finding is used for signal processing of the LC-MS signal peaks extracted by peak extraction computational tools to mine out signals with mass shift between the native and isotope-labeled compounds. The IP of native and isotope-labeled peak doublets in a stratified peak list has a mass shift (ΔMZ) within a user defined RT difference (ΔRT). If the mass difference between two peaks equals a given ΔMZ, and the difference of the RTs between the two peaks is less than a given ΔRT, then these two peaks are determined as an IP. IPRR step locates the IPs in five samples with different ratios (native/isotope-labeled) that gave response ratios that correlate with the expected concentration ratios. One challenge is the variation of a RT shift between different analytical runs in chromatographic analyses. The RT shift may cause a missing IP for a particular concentration ratio and increase the metabolite signal mining difficulty using the SMAIT strategy. Thus, we utilized a user-defined sliding retention time window (RTW) instead of a peak alignment process. The peaks of the respective samples in the RTW were grouped to calculate their Pearson’s correlation coefficients. The RTW scanning is based on peaks in five UPLC-HRMS datasets and finds the IP combinations and their correlation coefficients. IPRR correlation analysis step is to locate the IPs that give response ratios that correlate with expected concentration ratios. It is assumed that the IPs with high correlation coefficients have a higher probability of containing probable metabolite signals.

The concept of using MDF technique for identifying drug metabolite ions was first introduced in 2003.48) Each parent compound has a mass defect, which will be associated with its metabolites because a large portion of the parent compound structure usually remains unchanged during biotransformation. In other words, the mass defect change of metabolites related to their parent compounds will lie within a relatively narrow range (usually within ±0.050 Da). Based on the molecular weight of the parent compound, estimation can also be made regarding the range of molecular weight (MW) in which these metabolites will occur. MDF can then be applied to filter out all ions that fall outside of the expected MW range, as well as those ions that are within the expected MW change but exceed the expected mass defect change. This data reduction technique allows users to focus on the analysis of species that are potential chemicals metabolite candidates. The MDF workflow is shown in Fig. 2. The metabolite mixture was obtained from liver enzyme incubation of targeted compound. After high resolution LC-MS analysis, using MDF software and defined the mass defect change from the compound’s mass. MDF retained the signals with mass defect change within the boundaries while excluded the signals with mass defect change that are out of range, schematic diagram shown in Fig. 3. MDF will automatically produce MDF-processed chromatogram after processing. We can obtain the peaks of targeted compound probable metabolites with signal-to-noise ratio greater than three in MDF-processed chromatogram.


XCMS Online is a web-based software package to process untargeted metabolomics data. In XCMS processing, features are identified with relative intensity varying between sample groups. Hence, it can clearly filter out the variation in metabolite signals between sample groups.44) Furthermore, XCMS Online has been used on a wide variety of applications, including researches of cancer,54–58) pregnancy syndromes,59) and variability analysis of body fluids.60) The workflow of XCMS Online was shown in Fig. 4. The unaligned data is aligned and the output from XCMS Online can be visualized as aligned and superimposed extracted ion chromatograms and/or as a data matrix with observations as the features (by m/z and retention time) aligned across the observations as rows. The resulting table can be readily exported to Microsoft Excel, Matlab or other multivariate/statistical software. After normalization, significant features were filtered according to p-value (cutoff p<0.05) calculated by performing a t-test between two samples then XCMS Online would generate a list of significant features. These significant features are probable metabolites of targeted compound.

Hsu et al. (2016) described the exposure marker of di-isononyl phthalate (DINP) discovered used ultra-high pressure liquid chromatography coupled with Orbitrap high resolution mass spectrometry and SMAIT, MDF and XCMS Online untargeted metabolomics approaches.61) Sixteen, 83, and 139 probable DINP metabolite signals were obtained using the SMAIT, MDF, and XCMS procedures, respectively. Fourteen probable metabolite signals mined simultaneously by the three metabolomics approaches were confirmed as DINP metabolites by structural information provided by LC-MS/MS. Thirteen probable metabolite signals were validated as exposure-related markers in a rat model. This research shows that all of these three untargeted metabolomics data processing approaches can serve as useful tools for the investigation of metabolic process through the identification of exposure markers for environmental toxicants.
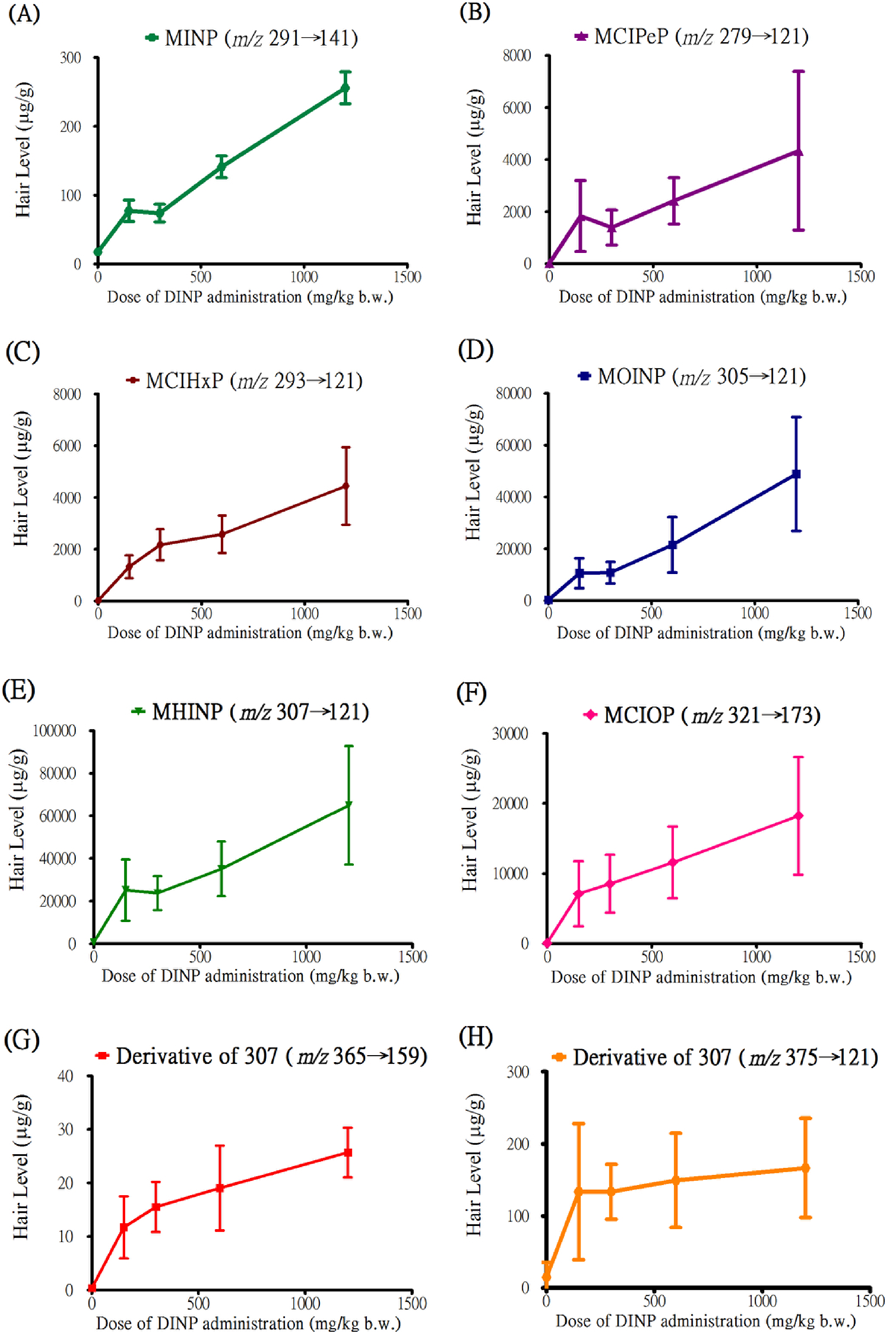
Hsu et al. (2015) described the levels of eight DINP metabolites discovered with SMAIT in hair and urine samples collected from rats that were orally administered by gavage 0, 150, 300, 600, or 1200 mg/kg with commercial DINP.33) The result shows these DINP metabolites had a positive correlation with increasing administered dose rat urine and hair (Figs. 5 and 6).

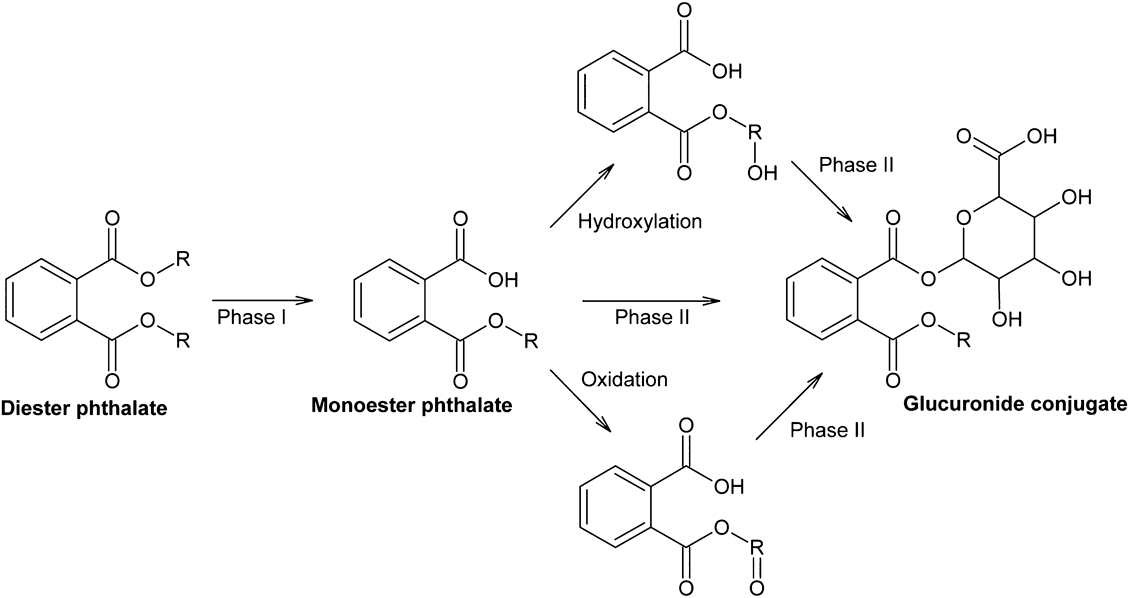
The mechanism of metabolism and elimination of phthalates are complex in human. In the first biotransformation step, the phthalate diester is cleaved into the respective hydrolytic monoester.62–64) In the second biotransformation step, the alkyl chain of the resulting hydrolytic monoester can be modified by various oxidation reactions. In the third biotransformation step, both the hydrolytic monoester and the oxidized secondary metabolites can be conjugated with glucuronic acid. The biotransformation pathways of phthalates are shown in Fig. 7.65) Oxidative metabolites are more water soluble than the corresponding hydrolytic monoesters, which, in turn, have decreased water solubility when the length of the alkyl chain increases. Therefore, low-molecular weight phthalates mostly metabolize to their hydrolytic monoesters.66,67) By contrast, high-molecular weight phthalates with eight or more carbons in the alkyl chain metabolize to their hydrolytic monoesters, which are extensively transformed to oxidative products.68–77) Therefore, using the hydrolytic monoester metabolites as sole biomarkers to assess the exposure of phthalates can be misleading, especially when comparing the hydrolytic monoester concentrations of high- versus low-molecular weight phthalates. While approximately 70% of an oral dose of DBP (four carbons in the alkyl chain) is excreted in urine as the hydrolytic monoester,78) less than 10% of DEHP (eight carbons in the alkyl chain), less than 2% of DINP (nine carbons in the alkyl chain) and less than 1% of di-(2-propylheptyl) phthalate (DPHP, with 10 carbons in the alkyl chain) are excreted as the hydrolytic monoesters.64,71,75,79) Regarding diisodecyl phthalate (DIDP, with 10 carbons in the alkyl chain), no relevant concentrations of the hydrolytic monoester are excreted in urine.74,80)
Several phthalates such as DINP and DIDP are complex mixtures of isomers, their composition varies depending on the nature of the mixture of alcohols used for their synthesis, may vary depending upon the manufacturers or the manufacturing process.81) In recent years, researches have focused on identifying and characterizing major isomers of DINP and DIDP isomeric phthalates to derive suitable oxidative metabolites for biomonitoring.74,75,82) Using custom synthesized reference standards of specific oxidized metabolites of DINP, DIDP and, we are now able to assess human exposure to these phthalates.61,74,75,82–85) Table 1 summarizes selected phthalates and their respective metabolites (as biomarkers of exposure) that are currently being investigated in biomonitoring studies.
| Parent substance | Abbreviation | Metabolite | Metabolites abbreviation | Molecular formula |
|---|---|---|---|---|
| Di-methyl phthalate | DMP | Mono-methyl phthalate | MMP | C9H8O4 |
| Di-ethyl phthalate | DEP | Mono-ethyl phthalate | MEP | C10H10O4 |
| Di-butyl phthalate | DBP | Mono-n-butyl phthalate | MBP | C12H14O4 |
| Mono-isobutyl phthalate | MiBP | C12H14O4 | ||
| Mono-3-carboxy-propyl phthalate | MCPP | C12H12O6 | ||
| Benzylbutyl phthalate | BBP | Mono-benzyl phthalate | MBzP | C15H12O4 |
| Di-(2-ethylhexyl)phthalate | DEHP | Mono-(2-ethylhexyl)phthalate | MEHP | C16H22O4 |
| Mono-(2-ethyl-5-hydroxyhexyl)phthalate | 5OH-MEHP | C16H22O5 | ||
| MEHHP | ||||
| Mono-(2-ethyl-5-oxohexyl)phthalate | 5oxo-MEHP | C16H20O5 | ||
| MEOHP | ||||
| Mono-(2-carboxymethyl-hexyl)phthalate | 2cx-MMHP | C16H20O6 | ||
| Mono-(2-ethyl-5-carboxypentyl)phthalate | 5cx-MEPP | C16H20O6 | ||
| MECPP | ||||
| Di-(2-propylheptyl)phthalate | DPHP | Mono-2-propylheptyl phthalate | MPHP | C18H26O4 |
| Mono-2-(propyl-6-hydroxy-heptyl)phthalate | OH-MPHP | C18H26O5 | ||
| Mono-2-(propyl-6-oxoheptyl)phthalate | oxo-MPHP | C18H24O5 | ||
| Mono-2-(propyl-6-carboxy-hexyl)phthalate | cx-MPHxP | C18H24O6 | ||
| Di-iso-nonylphthalate | DINP | Mono-iso-nonyl phthalate | MINP | C17H24O4 |
| Mono-hydroxyl isooctyl phthalate | MHIOP | C16H22O5 | ||
| Mono-carboxy isohexyl phthalate | MCIHxP | C15H18O6 | ||
| Mono-hydroxyl isoheptyl phthalate | MHIHP | C15H20O5 | ||
| Mono-carboxy isopentyl phthalate | MCIPeP | C14H16O6 | ||
| Mono(2,6-methyl-6-carboxyhexyl)phthalate | MCIOP | C17H22O6 | ||
| Mono-carboxy isooctyl phthalate | MCOP | |||
| Mono-hydroxyl isodecyl phthalate | MHIDP | C18H26O5 | ||
| Mono-hydroxy isononyl phthalate | MHINP | C17H24O5 | ||
| Mono-oxoisononyl phthalate | MOINP | C17H22O5 | ||
| m/z 319.1551 | — | — | ||
| m/z 361.1270 | — | — | ||
| m/z 365.1138 | — | — | ||
| m/z 373.1269 | — | — | ||
| m/z 375.1422 | — | — | ||
| m/z 389.1575 | — | — | ||
| m/z 437.1124 | — | — | ||
| m/z 443.1303 | — | — | ||
| m/z 511.1191 | — | — | ||
| Di-n-octyl phthalate | DnOP | Mono-3-carboxy-propyl phthalate | MCPP | C12H12O6 |
| Mono-n-octyl phthalate | MnOPMOP | C16H22O4 | ||
| Di-isodecyl phthalate | DIDP | Mono(carboxy-ethyl)phthalate | MCEP | C11O6H10 |
| Mono-3-carboxy-propyl phthalate | MCPP | C12O6H12 | ||
| Mono(carboxy-isobutyl)phthalate | MCiBP | C13O6H14 | ||
| Mono(carboxy-isopentyl)phthalate | MCiPeP | C14O6H16 | ||
| Mono(carboxy-isohexyl)phthalate | MCiHxP | C15O6H18 | ||
| Mono(carboxy-isoheptyl)phthalate | MCiHpP | C16O6H20 | ||
| Mono(carboxy-isooctyl)phthalate | MCiOP | C17O6H22 | ||
| Mono(7-carboxy-2-methyloctyl)phthalate | MCiNP | C18O6H24 | ||
| Mono(carboxy-isodecyl)phthalate | MCiDP | C19O5H26 | ||
| Mono(oxo-isononyl)phthalate | MOiNP | C16O6H16 | ||
| Mono(oxo-isodecyl)phthalate | MOiDP | C17O6H18 | ||
| Mono(oxo-isoundecyl)phthalate | MOiUdP | C18O6H20 |
Unlike most data acquisition techniques, such as neutral loss (NL), precursor ion (PI), and multiple reaction monitoring (MRM) scans by triple-quadrupole instruments or list-dependent MS/MS scans by ion trap instruments, the untargeted metabolomics data processing approaches and high-resolution MS are simple, generic methods regardless of the structures of parent compounds. Therefore, it allows high-throughput data acquisition of a large number of samples without the pre-determination of MS/MS spectra of the parent compounds or the prediction of m/z values of potential metabolites. These three untargeted metabolomics methods (SMAIT, MDF and XCMS Online) can serve as useful tools for the investigation of metabolic process through the identification of exposure markers for environmental toxicants.