Abstract
Reverse transformation behavior and the microstructures of ε-martensite induced by two different methods of cooling and deformation in Fe-28Mn-6Si-5Cr shape memory alloy was investigated. In situ heating X-ray diffraction (up to 673 K) was applied to the cooled and deformed specimens to observe the reverse transformation behavior. The microstructures in the cooled and deformed specimens were analyzed by electron backscattering diffraction. From X-ray diffraction patterns, the reverse transformation start temperature (As) in the deformed specimens was found to be lower than that in the cooled specimen, while the reverse transformation finish temperature (Af) in the deformed specimens was higher than that in the cooled specimen. The electron back-scattering diffraction (EBSD) analysis revealed a higher fraction of low-angle misorientation boundaries in γ-austenite and ε-martensite in the deformed specimens than in the cooled specimens. Intersections of different ε-martensite variants with ε-twin were observed in the deformed specimens, while such intersections were not observed in the cooled specimens. A heterogeneous mixture of plastically deformed ε-martensite and γ-austenite were found in deformed specimens. It is considered that the heterogeneity of the microstructures led to the difference in reverse transformation temperatures of As and Af in the thermally-induced and deformation induced maretnsites.
1. Introduction
Fe-Mn-Si alloys, which undergo martensitic transformation from γ-austenite (fcc) to ε-martensite (hcp), are well known as a representative iron-based shape memory alloy. The shape memory effect is associated with deformation-induced martensitic transformation and its reverse transformation from ε-martensite to γ-austenite on subsequent heating1). The Fe-Mn-Si alloys are applied to connecting devices, such as pipe joints and crane-rail fish plates2), utilizing its shape recovery force. An alternative application of Fe-Mn-Si alloys3) as seismic damper for buildings has attracted much attention lately due to the superior low-cycle fatigue properties associated with the reversible γ↔ε transformation under push-pull loading4).
The control of phase stability of γ-austenite and ε-martensite is important for the applications, because the shape memory and fatigue properties are highly associated with the deformation-induced γ→ε martensitic transformation and the reverse ε→γ transformation. The martensitic transformation temperatures and the reverse transformation temperatures are critical parameters determining the phase stability of ε-martensite and γ-austenite.
It is well known that the transformation temperatures are sensitive to the microstructure. For example, a decrease in martensitic transformation start temperature, Ms, by hot-rolling5,6) has been reported. An increase in reverse transformation finish temperature, Af, occurs with an increase in the pre-strain to induce martensitic transformation7–11). Moreover, a change in the transformation temperatures occurs by thermal cycling12,13). The microstructure dependence of the martensitic transformation temperatures is attributed to interactions between microstructures produced by plastic deformation and Shockley partial dislocations, which are the transformation dislocation in the γ to ε martensitic transformation.
In addition, a difference in As and Af between thermally-induced ε-martensite (Asth and Afth) and deformation-induced ε-martensite (Asdef and Afdef) has been reported8,14). Guo et al.14) reported that Asth is higher than Asdef, and considered that it is due to different configurations of ε-martensite variants. Putaux et al.15) investigated microstructures of the thermally-induced ε-martensite, and indicated that a spontaneous γ→ε transformation activates all three Shockley partial dislocations on each {111} plane with equal possibility so as to achieve zero net strain, resulting in a self-accommodation of different habit-plane variants. Yang et al.16) investigated microstructures of deformation-induced ε-martensite, and reported that ε-variants preferably oriented to the deformation axis are selectively activated to intersect with each other, resulting in another type of self-accommodation structure characterized by the intersection of the variants. Wang et al.8) pointed out that the higher Afdef than Afth is due to a high density of dislocations that act as obstacles for reverse motion of transformation dislocations. Thus the difference between As and Af is associated with the microstructural factors, such as the density and distribution of dislocations and the configuration of ε-martensite variants.
However, the effect of the microstructural factors on As and Af has not been systematically clarified yet. Most of the previous microstructural analyses in the literature have been carried out with transmission electron microscopy (TEM), which is useful to investigate internal microstructures but the available microstructural information is limited to local areas. In this study, spatial distribution of the ε-martensite microstructures were analyzed by electron-backscattering diffraction (EBSD) for those induced by cooling and by tensile deformation up to the strain level of 5% and 10%. The corresponding reverse transformation behaviors were observed by in situ heating X-ray diffraction (XRD). The microstructural factors affecting the reverse martensitic transformation temperatures are discussed in terms of the configuration of the ε-variants and permanent plastic deformation of the γ- and ε-crystals.
2. Experimental
An ingot of Fe-28Mn-6Si-5Cr (mass%) alloy was prepared by high frequency induction melting. The ingot was subjected to hot-forging and rolling at 1273 K into rod-shape with a cross section of 17.5 mm square. Solution annealing was carried out for 1 hour at 1273 K followed by water quenching.
In order to thermally induce ε-martensite, specimens were dipped into liquid nitrogen (LN). Figure 1 shows DSC curve of a specimen heated from 313 K to 673 K, followed by cooling to 123 K. An exothermic peak for γ→ε transformation was clearly detected, the Mf being around 220 K. The temperature of 77 K in LN would be much lower than the Mf in the DSC curve.

For the production of deformation-induced ε-martensite, tensile tests were carried out at strain rate of 2.5 × 10⁻⁴ s−1 with tensile specimens, as shown Fig. 2 (a). Tensile strains of 5% and 10% were introduced. The stress-strain curves are shown in Fig. 3. The residual strain of the deformed specimens was 4.95% and 9.72% after un-loading. Mechanical grinding was carried out with SiC-emery papers and finished with a P2500 paper, subsequently buffing with colloidal silica. The surfaces were chemically polished in a 1:10 solution of hydrofluoric acid and hydrogen peroxide to remove the damaged surface during mechanical polishing. The thickness of the chemically removed surface was over 100 μm.
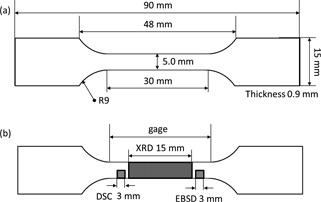
The reverse transformation behaviors were observed by in situ X-ray diffraction (XRD) heating from 298 K to 623 K (heating rate was 10 Kmin−1) and by DSC heating from 313 K to 623 K. Specimens for XRD and DSC were sectioned from tensile specimens as shown in Fig. 2(b). In situ heating XRD measurements were carried out on a Rigaku Smart Lab with a monochromatized Co-Kα1 radiation at 40 kV and 35 mA with a scan step of 0.05°.
DSC measurements were carried out using a TA-Instruments DSC from 313 K to 623 K at a heating rate of 5 Kmin−1. Figure 4 shows heating curve from 315 K to 515 K. In the DSC measurements, the cooled specimen shows a clear endothermic peak associated with ε→γ reverse transformation while the deformed specimens show a much broader peak. The endothermic peak temperatures seem to shift to a higher temperature when comparing the cooled specimen with the 5% deformed specimen. However, there is a difficulty in determining the austenitic transformation temperatures due to such peak broadening, especially in the specimen deformed to the strain of 10%. The endothermic peak cannot be found.

The microstructures after cooling and deformation were analyzed with a ZEISS SIGMA scanning electron microscope (SEM) equipped with an electron back-scattering diffraction (EBSD) analyzer and TSL-OIM software. The specimens for the EBSD measurements were electro-chemical polished at 30 V using an electrolyte of ethanol: water: butyl-cellosolve: hydrochloric acid = 35: 6: 5: 4.
3. Results
3.1 In situ heating XRD measurement
Figure 5 shows the results of in situ heating XRD experiments from 298 K to 673 K obtained for LN-cooled, 5%-deformed and 10%-deformed specimens. Figure 6(a) and (b) show the integrated intensity of an ε(10-11) peak and γ (111) peak, respectively, which represents total intensity of X-rays scattered from the crystal planes in the measurement. The ε(10-10) and ε(10-11) peaks are observed until a higher temperature in the deformed specimens, than in the cooled specimen. The ε(10-11) peak in the 10% deformed specimen decreased more gradually with temperature than in 5% deformed one, and was observed even at 623 K.

The reverse transformation temperatures were determined by the intensity of ε(10-11) peaks as shown in Fig. 6. Asth and Afth are at 343 K, and 398 K, respectively. Asdef and Afdef are at 298 K and 523 K in the 5% -deformed specimen. It should be noted that the Asdef decreases with increasing strain, while Afdef shows an increase. Thus the Asdef and Afdef in 10%-deformed specimen are considered to be below 298 K and above 623 K, respectively.
Comparison of reverse transformation temperatures in thermally-induced and deformation-induced martensite revealed that Asdef is lower than Asth, and Afdef is higher than Afth. The relationships are consistent with those reported by Guo et al.14) for Asth and Asdef, and also with those by Robinson et al.7–11) for Afth and Afdef.
3.2 Microstructure observation and analysis
3.2.1 Overviews of microstructure
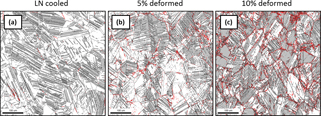
Figure 7 shows phase maps after cooling by LN, after 5% tensile deformation and after 10% tensile deformation. In the phase maps, γ-austenite and ε-martensite are colored in white and gray, respectively. Black and red lines indicate high-angle grain boundaries (HABs) (15° ≤ θ) and low-angle grain boundaries (LABs) (2° < θ < 15°), respectively. Table 1 indicates the area fraction of ε-martensite corresponding to the phase maps.
Table 1
Area fractions of ε-martensite in cooled, 5% deformed and 10% deformed specimens.
| ε-martensite |
LN cooled |
5% deformed |
10% deformed |
| Area Fraction (%) |
25.3 |
27.6 |
50.2 |
From Table 1 and Fig. 7, the fraction of deformation-induced ε-martensite increases with the strain from 5% to 10%, while the fraction of thermally-induced ε-martensite was limited even after cooling by LN (77 K). The fraction of LABs increases with strain, while the fraction of LABs in the cooled specimen is much less than those in the deformed specimens. The LABs represent the distortion of the crystals due to dislocation glide. It should be noted that the LABs are formed not only in the ε-martensite but also in the remaining γ-austenite.
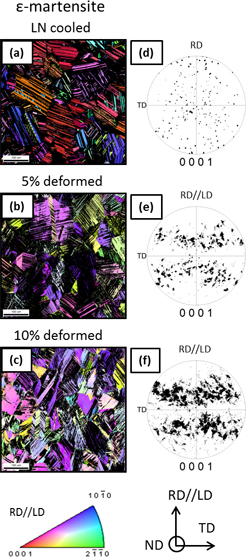
Figure 8 and 9 show inverse pole figure maps for ε-martensite and γ-austenite with respect to loading direction (LD) and pole figures maps with respect to ε{0001}, γ{111} and γ{001}. The texture for ε-martensite in cooled specimen is not so strong as shown in Fig. 8 (a) and (d), while deformed specimens exhibit stronger texture with respects to LD as shown in Fig. 8 (b), (e), (c) and (f). This is because in deformed specimens the ε-martensite is formed by the {111}<121> shear systems with high Schmid factors; the planes and directions of the shears are inclined with respect to LD. The γ-austenite in the cooled specimen is randomly oriented, while those in the deformed specimens exhibit a texture, as shown in Fig. 9 (d) to (i). The γ grains with γ<111> orientation parallel to LD are considered to be a result of crystal rotation of γ-austenite associated with the shear deformation during γ→ε transformation, which indicates orientation dependence according to the Schmid's law of Shockley partial dislocation movement17). The grains with γ<001> orientation parallel to LD are known to have a poor activity of the γ→ε martensitic transformation, and thus remain after the tensile deformation.
The distribution of misorientation angle at the boundaries in γ-austenite and ε-martensite were shown in Fig. 10. The misorientation in γ-austenite around 60° and 40° corresponds to twinning on {111} and {110} induced by annealing. The dominant deformation mode in the present alloy is deformation-induced martensitic transformation, while deformation twinning does not occur. The annealing γ-twin remains in the cooled specimen while the fraction of γ-twin decreases with strain in deformed specimens.

In Fig. 10(b), the misorientation angles around 90° in ε-martensite corresponds to ε-twin of {10-12} (94.8° and 85.2°). The fraction of the twins increases with the strain in deformed specimens, while the ε-twin almost does not exist in cooled specimen. The peak at 70.5° may be an interface angle between different variants of ε-martensite plates in the same grain, produced by partial dislocation motion on different {111} planes. The maximum fraction was obtained in the cooled specimens, while the fraction decreases with strain, which would be accounted by an intersection of different variants of ε-plates. The fraction of low-angle misorientation (θ < 10°) in both γ-austenite and ε-martensite increases with the strain in the deformed specimens, while the fraction is much smaller in the cooled specimen.
The increase in boundaries with lower misorietantion angles is considered to result from dislocation introduction. The low-angle misorientations in the grains of each phase were characterized by calculations of grain average misorientation (GAM) and grain orientation spread (GOS). GAM is calculated by averaging the misorientation between all neighboring pairs of points in a grain18). GOS is calculated by, first, averaging the orientation for each grain followed by averaging the deviation between the orientation of each point in the grain and the average orientation for the grain19).
Figure 11 (a) and (b) show distribution of GAM and GOS values. The open symbols indicate the values in γ-austenite, and closed symbols indicate the values in ε-martensite. The profile of GAM and GOS distribution is the sharpest in a LN-cooled specimen. The profiles are broader in deformed specimens. The broadening is more significant in 10%-deformed specimen than in 5% one. Similar tendency can be seen in both γ- and ε-phase.
The results suggest that the microstructures in the deformed specimens are much more heterogeneous compared to that in the cooled specimen.
3.2.3 Intersections of different variants of ε-martensite plates
Figure 12 shows the interfaces and intersections of different variants of ε-martensite plates. Image quality (IQ) maps with ε-martensite in green, IPF maps for ε-martensite respect to LD and misorientation maps for ε-martensite which ranges from 0° to 5°. An intersection of ε-martensite was not observed in the cooled specimen (Fig. 12 (a)), while the intersections of different variants of ε-plates were often observed in the deformed specimens (Fig. 12 (b) and (c)). In the deformed specimens, ε-twin was formed at the intersections as well as in the area (Fig. 12 (e) and (f)) which is well known self-accommodation morphology. Most of all these ε-twins are determined to be ε{10-12}.
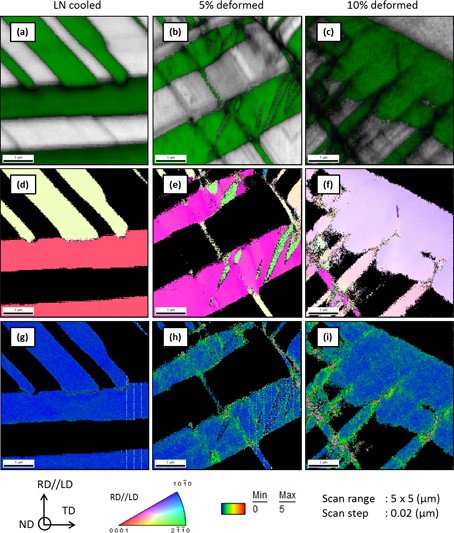
The maximum misorientation in ε-martensite plate is less than 1° in the cooled specimen even near the interface of ε-plates. However, for the deformed specimens, misorientation in ε-plates is much larger than cooled one, especially around the intersections. The low IQ value around intersections also indicates high dislocation density in the ε-martensite plates.
4. Discussion
4.1 Difference in microstructures in cooled specimen and deformed specimen
The microstructures of the specimens after cooling and after deformation are characterized by the area fraction of ε-martensite, the rule of variant selection, self-accommodation morphology of ε-martensite and the dislocation density in γ-austenite and ε-martensite.
The fraction of ε-martensite after deformation is higher than after cooling, and the fraction increases with the applied strain. In the present alloy, even after the cooling to 77 K with liquid nitrogen, 150 K lower than the Mf of around 227 K, the fraction of ε-martensite in the cooled specimen was 25%, while the fraction was 50% in the 10%-deformed specimen. The limited formation of thermally-induced ε-martensite is consistent with the previous reports15,20).
The deformation-induced ε-martensite led to fiber texture, while there was no strong texture in thermally-induced ε-martensite. During deformation-induced martensitic transformation, the formation of ε-martensite is dependent on the orientations and the deformation axis due to the variant selection by the Schmid's law and the motion of Shcokley partial dislocations1), which leads to the fiber texture. The weak texture in the cooled specimen would be accounted for by self-accommodation. Thermal martensitic transformation results in zero net strain by activation of all three Shockley partial dislocations equally on each {111} planes in γ-austenite15), leading to the weak texture. On the other hand, by the deformation-induced ε-martensitic transformation, ε-variant are formed by Schockley partials on γ{111} planes with higher Schmid factor.
The dislocation density of γ-austenite and ε-martensite in the deformed specimen is much higher than in the cooled specimen. The high dislocation density indicates a relaxation of strain that was plastically carried out with a crystal rotation of γ-austenite and ε-martensite. Even deformation-induced martensitic transformation and self-accommodation in the intersections contribute to the relaxation. On the other hand, in the cooled specimen, the most strain relaxation is considered to be elastically advanced or contributed by the spontaneous transformation with self-accommodation to zero strain. It should be noted that the dislocation density in γ-austenite is higher than that in ε-martensite in deformed specimens. It is considered to be due to differences in deformation mechanisms in γ-austenite and ε-martensite. The deformation-induced ε-martensite cancels the local strain by forming ε-twin in the single variant and by self-accommodation in the intersection of different variants16). While γ-austenite is not allowed relaxation by γ-twin configuration due to low stacking fault energy, and only allowed to relax by a crystal rotation and martensitic transformation, whose difficulty depends on the relationship between crystal orientation of γ-austenite and the loading direction. The different density of γ-austenite and ε-martensite in cooled specimen and in deformed specimens is believed to affect the difference of transformation temperatures.
4.2 Factors controlling reverse transformation behavior
It is observed from in situ heating XRD that Asdef is lower than Asth, while Afdef is higher than Afth. The change in reverse transformation temperatures would be associated with the effect of stabilization of both ε-martensite and γ-austenite by the introduction of dislocations. These stabilization do not conflict with each other, and can be explained by the interaction of introduced dislocations and transformation dislocations.
The increase in Af is generally recognized as ε-martensite stabilization, and is often reported in pre-strained specimens9–13). For the ε-stabilization, it is considered that the high density of dislocations in the ε-plates, formed by the intersections and the ε-twinning, would act as a barrier for the motion of transformation dislocations7).
The decrease in As is recognized as γ-austenite stabilization, and the effect of γ-stabilization by the introduction of dislocations is attributed to prior deformation5,6) or to cyclic transformation12,13). From the higher dislocation density in γ-austenite in deformed specimens, it is considered that the residual γ-austenite remaining from martensitic transformation was highly stabilized by the plastic deformation. Associated with a decrease in As, there may be a contribution of an elastic energy on a tip of ε-martensite15,21,22). When the growing ε-martensite encounters an obstacle such as a grain boundary or precipitate, the tip of martensite receives the elastic stress opposite to the growing direction22). The elastic energy stored on the tip of deformation-induced ε-martensite acts as back stress which serves as a part of driving force of Shockley partial dislocations associated with the reverse martensitic transformation and can reduce the As temperature14,21,22). The energy is relaxed in thermally-induced ε-martensite by the self-accommodation configuration15).
In the present alloy, several deformation modes are activated during plastic deformation, such as deformation-induced martensitic transformation, plastic deformation of γ-austenite with a slip deformation and ε-martensite with a slip and twinning. From the results of microstructural observations, the deformed microstructures consist of various structures of deformation-induced ε-martensite, plastically deformed γ-austenite, and ε-martensite and ε-twin. Hence the microstructure is much more heterogeneous than in the cooled microstructure. Thus in the deformed specimen, some of the ε-martensite transform to γ-austenite below Asth due to γ-stabilization, and some of ε-martensite transform above Afth due to ε-stabilization.
5. Conclusion
The reverse transformation of thermally-induced and deformation-induced ε-martensite in Fe-28Mn-6Si-5Cr alloy was investigated. The difference between As and Af was smallest in the thermally induced (cooled) martensite and was largest in the 10%-deformed specimens. The microstructural observations and EBSD analysis indicate that the heterogeneous microstructures caused by slip deformation of γ-austenite, the impingement and intersections of ε-martensite plates and resulting introduction of dislocations both in ε-martensite and in γ-austenite may be responsible for the larger difference in the reverse transformation temperatures.
Acknowledgments
We would like to acknowledge the Materials Manufacturing and Engineering Station, NIMS, for the materials processing.
REFERENCES
- 1) A. Sato, E. Chishima, K. Soma and T. Mori: Acta Metall. 30 (1982) 1177–1183. 10.1016/0001-6160(82)90011-6
- 2) T. Maruyama, T. Kurita, S. Kozaki, K. Andou, S. Farjami and H. Kubo: Mater. Sci. Technol. 24 (2008) 908–912. 10.1179/174328408X302585
- 3) T. Sawaguchi, I. Nikulin, K. Ogawa, K. Sekido, S. Takamori, T. Maruyama, Y. Shiba, A. Kushibe, Y. Inoue and K. Tsuzaki: Scr. Mater. 99 (2015) 49–52. 10.1016/j.scriptamat.2014.11.024
- 4) T. Sawaguchi, L.-G. Bujoreanu, T. Kikuchi, K. Ogawa, M. Koyama and M. Murakami: Scr. Mater. 59 (2008) 826–829. 10.1016/j.scriptamat.2008.06.030
- 5) Y. Tomota, M. Strum, and J.W. morris, Jr.: Metall. Trans. 19 (1988) 1563–1568. 10.1007/BF02674030
- 6) K. Tsuzaki, S. Fukasaku, Y. Tomota and T. Maki: Mater. Trans., JIM 32 (1991) 222–228. 10.2320/matertrans1989.32.222
- 7) J.S. Robinson and P.G. McCormick: Scr. Metall. 23 (1989) 1975–1978. 10.1016/0036-9748(89)90493-6
- 8) X.X. Wang and L.C. Zhao: Scr. Metall. 26 (1992) 303–307. 10.1016/0956-716X(92)90191-G
- 9) K. Tsuzaki, Y. Natsume, Y. Tomota and T. Maki: Scr. Metall. 33 (1995) 1087–1092. 10.1016/0956-716X(95)00337-U
- 10) H. Li, D. Dunne and N. Kennon: Mater. Sci. Eng. 273–275 (1999) 517–523. 10.1016/S0921-5093(99)00391-3
- 11) K.K. Jee, J.H. Han and W.Y. Jang: Mater. Sci. Eng. 378 (2004) 319–322. 10.1016/j.msea.2003.10.371
- 12) K. Tsuzaki, M. Ikegami, Y. Tomota and T. Maki: ISIJ Int. 30 (1990) 666–673. 10.2355/isijinternational.30.666
- 13) K. Tsuzaki, M. Ikegami, Y. Tomoda, Y. Kurokawa, W. Nakagawara and T. Maki: Mater. Trans., JIM 33 (1992) 263–270. 10.2320/matertrans1989.33.263
- 14) Z. Guo, Y. Rong, S. Chen, T.Y. Hsu, J. Hong and X. Zhao: Mater. Trans., JIM 40 (1999) 193–198. 10.2320/matertrans1989.40.193
- 15) J.-L. Putaux and J.-P. Chevalier: Acta Mater. 44 (1996) 1701–1716. 10.1016/1359-6454(95)00268-5
- 16) J.H. Yang and C.M. Wayman: Mater. Charact. 28 (1992) 23–35. 10.1016/1044-5803(92)90026-E
- 17) P. Yang, Q. Xie, L. Meng, H. Ding and Z. Tang: Scr. Mater. 55 (2006) 629–631. 10.1016/j.scriptamat.2006.06.004
- 18) H. Mirzadeh, J.M. Cabrera. A. Najafizadeh and P.R. Calvillo: Mater. Sci. Eng. 538 (2012) 236–245. 10.1016/j.msea.2012.01.037
- 19) S. Mitsche, P. Poelt and C. Sommitsch: J. Microscopy 227 (2007) 267–274. 10.1111/j.1365-2818.2007.01810.x
- 20) L. Federzoni and G. Guénin: Scr. Matell. Mater. 31 (1994) 25–30. 10.1016/0956-716X(94)90089-2
- 21) F. Nishimura, N. Watanabe and K. Tanaka: Mater. Sci. Eng. 247 (1998) 275–284. 10.1016/S0921-5093(97)00841-1
- 22) N. Bergeon, G. Guenin and C. Esnouf: Mater. Sci. Eng. 242 (1998) 87–95. 10.1016/S0921-5093(97)00512-1