Influence of Particle Shape on Microstructure and Magnetic Properties of Iron Powder Cores
2016 Volume 57 Issue 11 Pages 1859-1867

Details
2016 Volume 57 Issue 11 Pages 1859-1867
The coercive force of an iron powder core decreases with an increase in the circularity of the base iron powder. Microstructural observation reveals that the crystal grain size of the iron powder core is reduced by recrystallization during stress relief annealing after powder compaction. An analysis of the work hardening behavior during the compaction process shows that a rounder particle shape leads to smaller particle deformation, resulting in a reduced grain refinement effect during recrystallization. A grain boundary pinning model convincingly describes the reduction of coercive force with the increase in the eventual grain size.
This Paper was Originally Published in Japanese in J. Japan Inst. Met. Mater. 79 (2015) 315–323.
Iron powder cores are made from insulation-coated iron powders through a powder compaction process, and featurehigher saturation magnetic flux densities than those of conventional ferrite cores and lower eddy current losses lower than those of conventional metal magnetic materials such as electrical steel sheets1). With these features, iron powder cores have been applied to devices such as reactors for hybrid vehicles2).
Soft magnetic metal powders such as pure iron, Fe-Si or Fe-Si-Al are applied as raw materials for iron powder cores3–5). Among these materials, pure iron has the highest magnetic flux density. To expand the fields of application of pure iron powder cores, reduction of hysteresis loss is required.
One way to reduce hysteresis loss is to reduce the domain wall pinning force. Crystal grain boundaries, dislocations, and impurity atoms act as pinning sites6). Annealing is an effective process for relieving the strain induced during the compaction process, and it leads to a reduction of coercive force and an eventual reduction of hysteresis loss.
Several studies have reported the coercive force of pure iron powder cores. Hojo et al.7) have reported that the coercive force of an iron powder core decreases with an increase in the annealing temperature up to 973 K, but increases if the annealing temperature exceeds 973 K. This phenomenon is attributed to crystal grain size refinement due to recrystallization. Maeda et al.8) have reported that both hysteresis loss and eddy current loss decreases with spheroidizing of the iron powder particles.
Recrystallization is a process by which new dislocation free crystal grains are formed inside a deformed structure9). It indicates that the particle deformation induced during the compaction process affects the microstructure after annealing.
The particle shape of the base iron powder influences the number and distribution of the contact points between particles, and also influences the particle deformation induced during the compaction process. The amount of particle deformation affects the recrystallization behavior during the annealing process after compaction, leading to an influence on the microstructure of the powder core. However, few studies have been reported on the relationship between the powder particle shape and the amount of compaction strain, or its influence on the effect of annealing on the microstructure and coercive force of powder cores.
In this study, we investigated the influence of the powder particle shape on the microstructure and coercive force quantitatively, and found that the crystal grain size in an iron powder core increases with an increase in the circularity of the powder particle. The mechanism and effect on the coercive force will be discussed in detail.
The preparation process of the base iron powders is shown in Fig. 1. Molten steel was water atomized to form an iron powder. The atomizing conditions such as the water pressure, flow rate, etc. were controlled to modify the circularity of the powder particle. The iron powders were annealed at 1223 K for 3.6 ks in a hydrogen atmosphere. The particle size distribution of the annealed powders was controlled by the sieving and remixing process so as to be mutually equivalent.
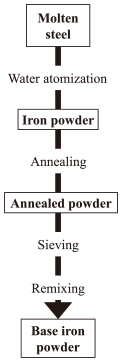
Preparation process of base iron powders.
The chemical compositions of the three base iron powders are shown Table 1. The major impurities are O, Si and Mn. The difference of the total impurity amount among these three powders is 0.017 mass% at the largest. This is within the range of scattering over repetition with the same atomizing conditions. As discussed later, the influence of such an impurity difference on the coercive force is smaller than that of the difference in the particle circularity.
| (mass%) | ||||||||||||
|---|---|---|---|---|---|---|---|---|---|---|---|---|
| Base iron powder | C | O | N | Si | Mn | P | S | Cr | Ni | Al | Fe | Total impurity |
| A | 0.0020 | 0.0690 | 0.0005 | 0.0200 | 0.0430 | 0.0090 | 0.0004 | 0.0080 | 0.0090 | 0.0030 | Bal. | 0.164 |
| B | 0.0043 | 0.0673 | 0.0005 | 0.0170 | 0.0400 | 0.0090 | 0.0004 | 0.0080 | 0.0200 | 0.0030 | Bal. | 0.170 |
| C | 0.0033 | 0.0539 | 0.0010 | <0.0080 | 0.0520 | 0.0020 | 0.0002 | 0.0180 | 0.0200 | 0.0030 | Bal. | 0.153 |
The apparent density (DA) and particle size distribution were measured according to JIS Z 2504 and JIS Z 2510, respectively. The mass average particle size D50 was determined at the point of 50% on the accumulative particle size distribution. The powder properties of the three base iron powders are shown in Table 2. The average particle size D50 and the particle size distribution are essentially equivalent. The apparent density of these powders varies from 3.19 Mg m−3 (powder C) to 4.07 Mg m−3 (powder A). Apparent density is generally affected by the particle size distribution and particle shape, and a rounder particle shape gives a higher apparent density10). In this research, the three base iron powders have the same particle size distribution. Hence, the apparent density should be mainly affected by the particle shape.
| Base iron powder |
Particle size distribution (mass%) | Mean diameter, D50/µm |
Apparent density, DA/Mg m−3 |
Powder circularity, C |
|||||
|---|---|---|---|---|---|---|---|---|---|
| 180~150 µm |
150~106 µm |
106~75 µm |
75~63 µm |
75~45 µm |
45~ µm |
||||
| A | 0.6 | 25.0 | 31.8 | 9.8 | 17.4 | 15.4 | 82.2 | 4.07 | 0.83 |
| B | 0.1 | 23.5 | 32.8 | 8.4 | 17.2 | 18.0 | 81.0 | 3.57 | 0.77 |
| C | 1.3 | 23.1 | 33.6 | 8.6 | 16.8 | 16.6 | 82.4 | 3.19 | 0.73 |
The particle shape of the base iron powders was observed by optical micrography. For this purpose, the powders were molded in a thermoplastic resin, polished and etched with natal. As shown in Fig. 2, powder A is almost circular, while powders B and C show significant irregularity.
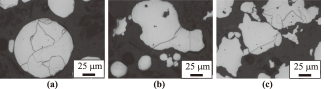
Optical micrographs of cross section of base powder particles, (a) Powder A, (b) Powder B, (c) Powder C.
The particle circularity of the base iron powders was quantified through an image analysis of the optical micrographs. The circularity of each particle is defined as Lc/La, where La is the periphery of the particle cross section and Lc is the periphery of a perfect circle with the same area. This is unity if the particle cross section is a perfect circle, and decreases with an increase in shape irregularity. The software program Image J (Public domain, National Institutes of Health) was used to calculate the circularity of each particle, and the average of the particles with diameters of 10 µm or more was defined as “powder circularity” C. Because higher C values indicate higher apparent density (Table 2), circularity C will be used as a parameter of the iron powder particle shape in the discussion below.
2.2 Preparation of iron powder coresIron powder cores were prepared through a process shown in Fig. 3. First, the base iron powders were coated with a silicone resin (Dow Corning Toray, SR2400) for insulation. The base powders were mixed with the resin, which had been dissolved with a xylene-based organic solvent, and then dried at room temperature. The amount of the resin was adjusted to 0.25 mass% of the total mass of the coated iron powder. These powders were then heated to 473 K for 7.2 ks to harden the resin.
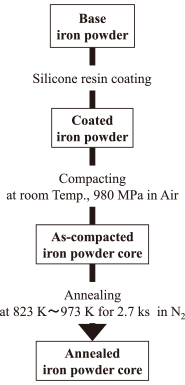
Preparation process of iron powder cores.
The coated powders were compacted into ring-shaped cores (outer diameter: 38 mm, inner diameter: 25 mm, height: 6 mm) with a compaction pressure of 980 MPa. To remove the strain induced during the compaction process, these as-compacted cores were annealed at 823 K or 973 K for 2.7 ks in a nitrogen atmosphere. Similar annealing conditions have also been applied previously for the same purpose9).
2.3 EvaluationThe properties of the base iron powders and iron powder cores evaluated in this study are summarized in Table 3.
| Microstructural observation | Crystal grain size | Micro-vikcers hardness | Crystal orientation | DC magnetic properties | |
|---|---|---|---|---|---|
| Base iron powders | ○ | ○ | ○ | — | — |
| Iron powder cores (as-compacted) |
○ | — | ○ | ○ | — |
| Iron powder cores (annealed at 823 K) |
○ | ○ | ○ | ○ | ○ |
| Iron powder cores (annealed at 973 K) |
○ | ○ | ○ | ○ | ○ |
○: Evaluated —: Un-evaluated
For microstructural observation by optical micrography, each of the specimens was molded in a thermoplastic resin, polished and etched with nital for the evaluation. The cores were cut before molding to observe the cross section perpendicular to the circumference.
The crystal grain size was measured from the optical micrographs of the specimens by the intercept method11). The average crystal grain size over 40 particles or more was defined as the crystal grain size for each of the base powders and annealed cores.
The Micro Vickers hardness of the polished specimens was measured at 5 points with a load of 0.245 N. The average of the three points excluding the maximum and minimum values was used as the core hardness.
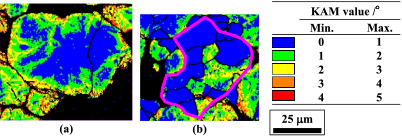
The crystal orientation distributions in the iron powder cores were evaluated as kernel average misorientation (KAM) maps12) by the SEM/EBSD (Scanning electron microscopy/Electron back scattered diffraction) method. KAM is the average misorientation angle between kernels defined on the observation area, and the KAM map shows the dislocation density distribution12). It should be noted that misorientation angles exceeding 5° were excluded from the KAM calculation. The SEM/EBSD analysis was performed using a JEOL JSM-7001FA SEM and TSL OIM (orientation imaging microscopy) system. The observed area was 500 µm × 500 µm, and the electron beam irradiation step (i.e., the distance between the kernel centers) was 1 µm.
The direct current (DC) hysteresis loops of the annealed-cores were measured with a DC magnetic properties measuring instrument (Metron, Inc. Type: SK-110). The densities and magnetic path lengths of the cores were calculated from their dimensions and weights. The primary and secondary coils comprised 100 and 40 turns, respectively, and were wound with ϕ0.6 mm insulated copper wire. The maximum magnetic induction was adjusted to 1.0 T for all the measurements, and the coercive forces were evaluated from the measured hysteresis loops.
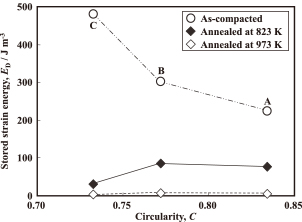
The relationship between the circularity of the base iron powders and the green density of the as-compacted cores is shown in Fig. 4. The core density is within a range of 7.41 ± 0.03 Mg m−3 and is regarded as independent of the powder circularity. The densities of the annealed cores are equivalent to those before annealing. The relationship between the powder circularity and coercive force Hc of the annealed cores is shown in Fig. 5. The cores annealed at 973 K shows lower Hc than those annealed at 873 K. Hc of the 973 K annealed cores decreases with an increase in the powder circularity, while that of the 823 K annealed cores shows a maximum at the circularity of 0.77.
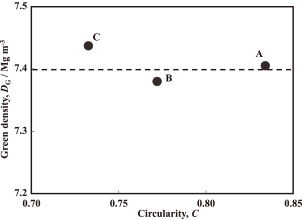
Relationship between particle circularity and green density of as-compacted iron powder cores.
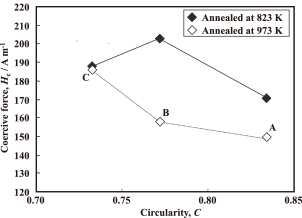
Relationship between particle circularity and coercive force of annealed iron powder cores.
Optical micrographs of the annealed cores are shown in Fig. 6. The crystal grain size varies with the circularity of the base iron powder and the annealing temperature. The relationship between the circularity of the base iron powder and the crystal grain size is shown in Fig. 7. The crystal grain sizes of the annealed cores decrease with an increase in the circularity of the base iron powder. The crystal grain sizes of the base powders are around 40 µm, and are larger than that of the annealed cores. The crystal grain size of the as-compacted cores was not evaluated because of their complex etched pattern due to the dislocations induced by particle deformation during the compaction process.
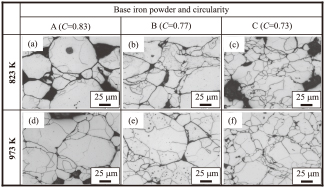
Optical micrographs of iron powder cores annealed at 823 K and 973 K.
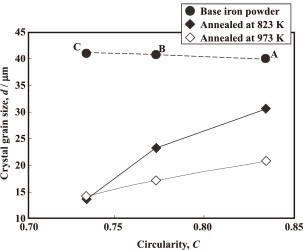
Relationship between particle circularity and crystal grain size of annealed iron powder cores.
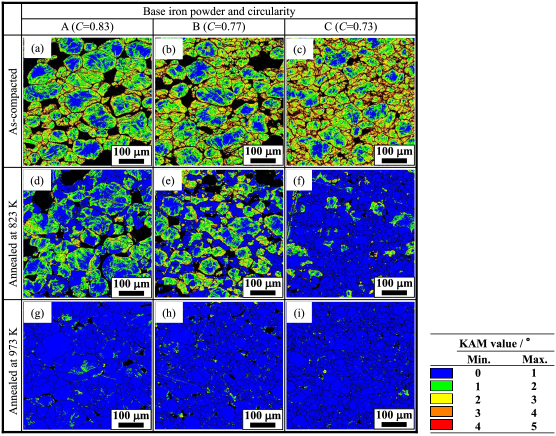
The KAM maps of the as-compacted and annealed cores are shown in Fig. 8. In the as-compacted cores (Fig. 8 (a)–(c)), the KAM values in the vicinity of the particle surfaces are higher than those in the inner area of the particle. The area with KAM values of 1° or less increases with an increase in the annealing temperature, and becomes dominant after annealing at 973 K (Fig. 8(g)–(i)).
KAM maps of iron powder cores.
The 823 K annealed cores made from base iron powders A and B still show areas with KAM values over 1° (Fig. 8(d), (e)). In the 823 K annealed core of powder C, however, the area with KAM of 1° or less is dominant.
The hardnesses of the base iron powder, as-compacted cores and annealed cores are shown in Fig. 9. The as-compacted cores show the highest hardness, while the annealed cores shows hardness between these of the as-compacted cores and, the base iron powders, and the 823 K annealed cores display higher hardness than the 973 K annealed cores.
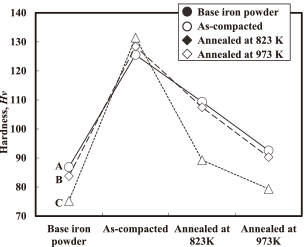
Hardness of base iron powders, as-compacted cores and annealed cores.
Magnified KAM maps of the cores made from base iron powder A are shown in Fig. 10. The as-compacted core shows areas with high (1° or more) KAM values in the vicinity of the particle surfaces. On the other hand, in the 827 K annealed core, areas with low (1° or less) KAM values are dominant and the crystal grain size in such areas is 5–20 µm, which is smaller than that of the base iron powder (about 40 µm). This indicates that crystal grain size refinement by recrystallization occurs during the compaction and annealing process.
Magnified KAM maps of iron powder cores with base iron powder A, (a) As-compacted, (b) Core annealed at 823 K.
In addition, the crystal grain size of the annealed cores increases with an increase in the powder circularity (Fig. 7). This indicates that an increase in the powder circularity reduces the amount of dislocations stored during compaction, because the recrystallized grain size increases with a decrease in dislocation density13).
In the following discussion, influence of the coated silicone resin on recrystallization behavior is regarded as negligible because the silicone resin is decomposed into stable Si oxide2) and carbon during the annealing process, whereas iron is not carburized even at the maximum annealing temperature of 973 K14–16).
According to Ozaki et al.17), the behavior of an iron powder bed during compaction is divided into two processes, “particle rearrangement” and “particle plastic deformation,” and the porosity V(p) of a powder bed at a pressure of p is expressed as
| \[[V(0) - V(p)]/V(0) = a_1 \cdot \exp (-b_1/p) + a_2 \cdot \exp (-b_2/p),\] | (1) |
Equation (1) can be rewritten with the apparent density DA, green density DG and true density of the powder DT as
| \[D_{\rm G} - D_{\rm A} = (D_{\rm T} - D_{\rm A}) \cdot [a_1 \cdot \exp (-b_1/p) + a_2 \cdot \exp (-b_2/p)],\] | (2) |
The right side of eq. (2) is divided into two terms:
| \[\mathit{\Delta} D_{\rm r} = (D_{\rm T} - D_{\rm A}) \cdot a_1 \cdot \exp (-b_1/p),\] | (3) |
| \[\mathit{\Delta} D_{\rm p} = (D_{\rm T} - D_{\rm A}) \cdot a_2 \cdot \exp (-b_2/p),\] | (4) |
The consolidation parameters, a1, b1, a2 and b2 were determined as follows: First, a linear formula of each of the parameters as a function of DA was derived through a regression analysis for the data given in Ref. 17). Second, the consolidation parameters of the three base iron powders were calculated by applying their apparent densities DA to the regression formulas. The calculated parameters are shown in Table 4. If the true density DT of pure iron is given as 7.87 Mg m−3 18), ΔDp is calculated from eq. (4) with the parameters in Table 4.
| Base iron powder |
Apparent Density, DA/Mg m−3 |
Parameters | Remark | |||
|---|---|---|---|---|---|---|
| a1 | b1 | a2 | b2 | |||
| — | 3.07 | 0.333 | 17.8 | 0.766 | 226 | Ref. 21) |
| — | 3.95 | 0.343 | 19.6 | 0.794 | 247 | |
| A | 4.07 | 0.344 | 19.9 | 0.798 | 250 | Calculated from regression |
| B | 3.57 | 0.339 | 18.8 | 0.782 | 238 | |
| C | 3.19 | 0.334 | 18.0 | 0.769 | 228 | |
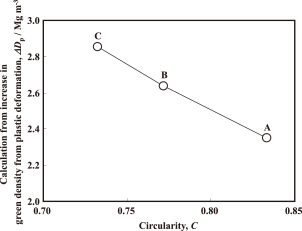
The relationship between the circularity of the base iron powder and ΔDp is shown in Fig. 11. The value of ΔDp decreases with an increase in the circularity of the base iron powder. This indicates that the plastic deformation of the iron powder during compaction decreases as the circularity of the base iron powder increases.
Relationship between particle circularity and results of calculation of increase in green density from plastic deformation of iron powder particles.
The insulation layer would also affect the plastic deformation of the powder particles. However, the thickness of the particle insulation layer is estimated as approximately 0.2 µm under the assumption that the particle is spherical. Since this is two orders of magnitude smaller than the average particle size of the base iron powders, the effect of the insulation layer is neglected in this discussion.
Next, the relationship between the crystal grain size and stored strain energy is discussed. As shown in the appendix, the strain under a uniaxial compaction process εp is given as
| \[\varepsilon_{\rm p} = \mathit{\Delta} D_{\rm p}/D_{\rm G},\] | (5) |
| Base iron powder | Strain induced by plastic deformation of iron powder, εp |
|---|---|
| A | 0.31 |
| B | 0.35 |
| C | 0.38 |
Syarif et al.19) have reported the dislocation density of cold-rolled pure iron sheets as a function of rolling reduction. Then, the dislocation density in the uniaxially compacted iron powder cores can be estimated from Ref. 19) by replacing rolling reduction with uniaxial strain εp20). The smallest and largest values of the dislocation density estimated from the strain εp are 1.4 × 10¹⁴ m−1 for powder A and 1.9 × 10¹⁴ m−1 for powder C, respectively.
Dislocation density is also estimated from the work hardening of the iron powder. Bailey and Hirsch21) have given the increase in yield stress Δσ resulting from the work hardening process as
| \[\mathit{\Delta} \sigma = \alpha Gb\sqrt{\rho},\] | (6) |
To estimate Δσ of the base iron powders, the following relationship between the Vickers hardness and yield stress25) is applied.
| \[\sigma = 3H_{\rm v}.\] | (7) |
| \[\mathit{\Delta} \sigma = 3\mathit{\Delta} H_{\rm v}.\] | (8) |
| \[\rho = (3\mathit{\Delta} H_v/\alpha Gb)^2.\] | (9) |
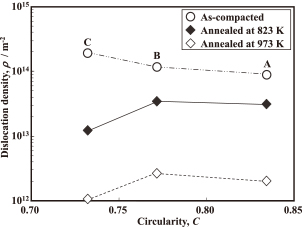
The relationship between the circularity of the base iron powders and the dislocation density of the iron powder cores is shown in Fig. 12. The dislocation density of the as-compacted cores increases with a decrease in circularity, and the smallest and largest values of the dislocation density calculated from the hardness are 9.3 × 10¹³ m−1 and 2.0 × 10¹⁴ m−1, respectively. This range is in good agreement with that estimated from the particle plastic deformation model.
Relationship between particle circularity and dislocation density within the iron powder cores.
The dislocation density of the base iron powders are assumed to be the same because the powders were prepared through the same thermomechanical process, indicating that the plastic deformation of iron powders during compaction decreases with an increase in circularity.
The dislocation density of the annealed cores is also shown in Fig. 12 as a function of temperature. The dislocation density of the annealed cores is lower than that of the as-compacted cores. This indicates that strain energy was decreased by recrystallization.
The strain energy ED is given as a function of dislocation density ρ as
| \[E_{\rm D} = \rho Gb^2/2\] | (10) |
Relationship between particle circularity and strain energy stored in iron powder cores.
The amount of the decrease in the strain energy by annealing, ΔED, is regarded as the difference of the strain energy between the as-compacted and annealed cores. The relationship between the crystal grain size and ΔED of the iron powder cores is shown in Fig. 14. Here, the crystal grain sizes of the as-compacted cores are assumed to be the same as those of the base iron powders. The crystal grain size decreases with an increase in ΔED, and shows a universal behavior regardless of the base iron powder circularity and annealing temperature.
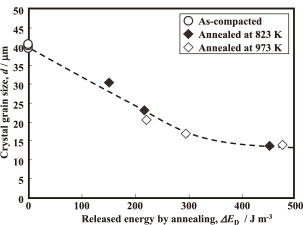
Relationship between energy released by annealing and crystal grain size in iron powder cores (The dashed line is a visual guide line).
The ΔED value would include the contribution of recrystallization and recovery. The crystal grain size after annealing decreases with an increase in the number of recrystallization nuclei, and the number of nuclei increases with an increase in ΔED. In Fig. 14, ΔED is related only to the crystal grain size, which is determined by the number of recrystallization nuclei. Thus, in this research, the amount of the decrease in strain energy by recovery is considered to be very small or the same in every annealed core.
From the above discussion, it is concluded that “particle plastic deformation” during the compaction process decreases with an increase in the circularity of the base iron powder, and that decrease causes a decrease in ΔED in the as-compacted cores, resulting in an increase in the recrystallized crystal grain size after annealing.
4.2 Effect of circularity of iron powder on coercive force of annealed coreThe coercive force Hc is affected by crystal grain boundaries, inclusions and dislocations. These are considered to be the pinning sites of domain wall movement. Pfeifer et al.27) have proposed a coercive force model as
| \[H_{\rm c} = H_{\rm ck} + H_{\rm c\_ex},\] | (11) |
| \[H_{\rm ck} = (3 \cdot \gamma)/(J_{\rm s} \cdot d),\] | (12) |
A theoretical expression of the domain wall energy is given as
| \[\gamma = a \sqrt{A \cdot K},\] | (13) |
In the case of iron, A and K have been estimated as 1.49 × 10⁻¹¹ J m−1 32) and 4.72 × 10⁴ J m−3 33), respectively. In the case of iron, there are basically two kinds of domain walls with the angle between the spins on the two sides of 90° and 180°. The constant a for the 90° and 180° domain walls are 1 and 231), respectively. From this, the γ values are calculated by eq. (13) as 8.4 × 10⁻³ J m−2 for 90° and 1.7 × 10⁻² J m−2 for 180°. Because these kinds of domain walls co-exist in actual system34), the magnetic domain wall energy of an iron powder core will be in the range of 8.4 × 10⁻³ to 1.7 × 10⁻² J m−2.
From eqs. (11) and (12), the relationship between Hc and d is given as
| \[H_{\rm c} = S/d + H_{\rm c\_ex},\] | (14) |
| \[S = (3 \cdot \gamma)/J_s.\] | (15) |
| \[\gamma = (S \cdot J_{\rm s})/3.\] | (16) |
In this study, Hc_ex of the 973 K annealed cores is assumed to be constant because the 973 K annealed cores have the same ED as seen in Fig. 13, and this indicates that the 973 K annealed cores also have the same dislocation density. In addition, according to Ref. 7), the difference of Hc caused by differences in the impurity levels in the three base powders (0.017 mass% at the highest; see Table 1) is only 3%, and this difference is negligibly small compared with the difference of the coercive force of the annealed cores in this research.
The relationship between the inverse of the crystal grain size, d−1, and coercive force is shown in Fig. 15. The coercive force linearly increases with an increase in d−1, as predicted by eq. (14). The linear regression formula gives the slope S as 1.59 × 10³ and the intercept Hc_ex as 70.9 A m−1. The domain wall energy γ is calculated as 1.2 × 10⁻² J m−2 from eq. (16) with Js = 2.16 T for iron35) and the S value given above. This γ value is in the range between those for the 90° and 180° domain walls. Therefore, the relationship between Hc and 1/d of the 973 K annealed cores in Fig. 15 is convincingly explained by the model of eq. (14).
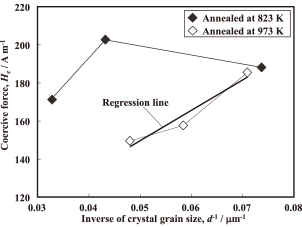
Relationship between inverse of crystal grain size and coercive force.
In the case of the 823 K annealed cores, there are no linear relationships between Hc and d−1 (Fig. 15). This indicates that Hc_ex is not constant because dislocations still remain in these cores, as seen in Fig. 12.
Thus, the coercive force behavior is fully explained by the change of the crystal grain size when Hc_ex is constant. In this case, the coercive force decreases with an increase in the circularity of base iron powder because of the crystal grain size growth associated with higher powder circularity.
Base iron powders with various circularities have been compacted and annealed into iron powder cores, and the influence of the powder circularity on the microstructure and magnetic properties of the cores have been investigated. The conclusions of this research are summarized as follows: