Electrochemical Dissolution of Platinum and Ruthenium from Membrane Electrode Assemblies of Polymer Electrolyte Fuel Cells
2016 Volume 57 Issue 11 Pages 1972-1976

Details
2016 Volume 57 Issue 11 Pages 1972-1976
To establish a recovery method for noble metals from membrane electrode assemblies (MEAs) of spent polymer electrolyte fuel cells (PEFCs) without the use of strong acids, electrochemical dissolution tests for Pt and Ru from MEAs were conducted. By using square potential waves, 93.2% of the Pt and 98.4% of the Ru dissolved from a MEA in 1 mol L−1 HCl at room temperature when oxidation and reduction potentials were at 1.5 and 0.1 V vs. SHE and the holding times for both were 15 s per cycle. The dissolution of Pt and Ru became remarkable when the oxidation potential was 1.4 V vs. SHE and gradually decreased at more positive potentials. These results indicate that competitive reactions exist in the dissolution process. In addition, the effects of H+ and Cl− concentrations on the dissolution ratios were investigated. The dissolution ratios of Pt and Ru were small in solutions with low Cl− and high H+ concentrations ([Cl−] = 0.01 mol L−1, [H+] = 1 mol L−1); however, 50.6% of the Pt and 27.9% of the Ru dissolved in solutions with high Cl− and low H+ concentrations ([Cl−] = 1 mol L−1, [H+] = 0.01 mol L−1). Thus, we verified that the electrochemical dissolution method was adaptable to the recovery of noble metals from MEAs and that strong acids were not needed.
Platinum has a high catalytic activity for the oxygen reduction reaction and the hydrogen oxidation reaction. Therefore, it is commonly used as an electrocatalyst for polymer electrolyte fuel cells (PEFCs), although Pt is a precious metal. PEFCs are candidates for use as power sources in a sustainable society because they do not emit greenhouse gases. To promote the spread of PEFCs throughout society, it is necessary to reduce the manufacturing costs. One solution for reducing the cost is to recycle Pt from waste PEFCs. Pt is contained in membrane electrode assemblies (MEAs), which are composed of a Pt-based catalyst, a gas diffusion layer and a proton exchange membrane. Therefore, Pt recycling technology for use with MEAs is needed. In general, recycling Pt from products, such as automotive catalysts, is conducted by using a leaching method with chloride-based solutions, such as oxyacids.1–3) The method is technically reliable and applicable to most products, including PEFCs.4) However, there are some problems with the leaching method, for example, generation of large quantities of acidic waste and corrosion of the materials by strong acid media. Therefore, we focused on an electrochemical dissolution method for Pt recycling from MEAs as an alternative without the strong acidic media used in leaching methods.
It is thought that Pt metal forms a protective oxide layer on its surface, meaning that the dissolution ratio of Pt metal into acidic media by using potentiostatic electrolysis is low. Xiaoping et al. have reported that the dissolution rates of 10 mass% Pt/C and Pt wire at 0.9 V vs. SHE in 0.57 mol L−1 HClO4 are 1.7 × 10⁻¹⁴ and 1.4 × 10⁻¹⁴ g cm−2 s−1, respectively.5) However, it has been reported by many researchers that potentiodynamic electrolysis accelerates the dissolution rate in comparison to potentiostatic electrolysis.6–11) Mitsushima et al. have reported that the Pt dissolution rate depends on the profiles of the potential, and they have obtained a rate of 9.0 × 10⁻⁹ g cm−2 s−1 in 0.5 mol L−1 H2SO4 when a slow cathodic triangular wave is applied.6) Topalov et al. have shown that Pt dissolution occurs in both oxidation and reduction potential sweeps by using an online Pt detection system combined with an electrochemical flow cell and inductively coupled plasma mass spectrometry (ICP-MS).9) Yadav et al. have reported that the existence of chloride anions in 0.5 mol L−1 H2SO4 solutions accelerates the Pt dissolution rate during potential cycling due to the formation of soluble chloro complexes, such as PtCl6− and PtCl4−.12)
Previous research has focused on improving catalyst performance or determining the mechanism for the decrease in the catalyst performance. Shiroishi et al. have adapted an electrochemical dissolution method to recover Pt and Ru from PEFCs.13) They apply potentiodynamic electrolysis to dissolve noble metals from Pt-loaded electrodes using several potential wave profiles and have shown that a saw-tooth wave is 15 times faster than constant potentials are. In order to adapt the electrochemical dissolution method to actual fuel cells, it is necessary to confirm the dissolution of Pt metal from MEAs. Furthermore, it is worthwhile to achieve Pt dissolution using simpler potential wave profiles, such as a square wave, for electrolysis control and comprehension of the reactions. In this study, we conducted noble metal dissolution tests from Pt/Ru-loaded MEAs by applying square potential waves. Moreover, the tests were conducted in several solutions, and the effects of the concentrations of H+ and Cl− were evaluated.
Potentiostatic and potentiodynamic electrolyses and cyclic voltammetry (CV) were carried out using a conventional three-electrode method. An MEA, which had a thickness of 0.5 mm and was cut into 10 mm squares, was used as the working electrode. The amounts of Pt and Ru loaded in the MEA were 0.91 mg cm−2 and 0.41 mg cm−2, respectively. The counter electrode was a Pt plate, and the reference electrode was an Ag/AgCl/saturated KCl electrode (RE-1C, ALS). The tip of the reference electrode was enclosed in a ceramic filter to avoid the diffusion of KCl. In this paper, all potentials were converted from V vs. Ag/AgCl to V vs. SHE. Hydrochloric acid (ASS grade, Kanto Chemical) and sulfuric acid (IC grade, Kanto Chemical) were used as electrolytes after diluting them to the proper concentrations. The electrodes and the electrolytes were set up in an H-shaped cell, which had two chambers separated by proton exchange membranes. To confirm the electrochemical behavior of the prepared MEA, a CV test was performed in 1 mol L−1 HCl in advance. A potentiostat (1280Z, Solartron) was used to control the potential of the working electrode and generate square potential waves, as shown in Fig. 1. Here the signs of the oxidation and reduction potentials were defined in relation to the immersion potential of the MEA. During the electrolysis tests, the electrolytes were stirred with a magnetic stirrer. After the electrochemical dissolution tests, the concentrations of Pt and Ru in the electrolyte solutions were measured by using inductively coupled plasma atomic emission spectrometry (ICP-AES, SPS-3520DD, SII). All electrochemical dissolution tests were performed at room temperature.

Diagram of the square potential wave and definitions of potentials and times.
Figure 2 shows a cyclic voltammogram of the prepared MEA working electrode in 1 mol L−1 HCl at a scan rate of 10 mV s−1. The vertical axis is the current density calculated from the geometric area of the MEA. An increase in the anodic current corresponding to Cl2 gas evolution was observed around 1.3 V. From the intersection point of the voltammogram in the anodic region and the horizontal line corresponding to 0 mA cm−2, the potential for Cl2 gas evolution using the MEA working electrode was estimated to be 1.35 V. The result agrees with the reported value for the reaction below.14)
| \[{\rm Cl}_2 ({\rm g}) + 2{\rm e}^- = 2{\rm Cl}^- \qquad E^\circ = 1.3583{\rm V}\ {\rm vs}.\ {\rm SHE}\] | (1) |

Cyclic voltammogram using an MEA working electrode in 1 mol L−1 HCl at R. T. Scan rate: 10 mV s−1.
In order to confirm the effectiveness of potentiodynamic electrolysis for noble metal dissolution, potentiodynamic and potentiostatic electrolyses were conducted in 1 mol L−1 HCl. A square potential wave was used as the potential wave profile in the potentiodynamic electrolysis because of its simple profile. In the potentiodynamic electrolysis, the MEA potential was kept at 0.1 V for 30 s (reduction electrolysis), then the potential was changed to 1.5 V, and this potential was maintained for 30 s (oxidation electrolysis). This series of operations were repeated 60 times. In other words, the total oxidation electrolysis time was 30 min. In the case of potentiostatic electrolysis, a test was conducted at 1.5 V for 30 min. Figure 3 shows the time dependence of the Pt and Ru dissolution ratios in both electrolysis tests. The dissolution ratio of metal is defined as:
| \[{\rm Dissolution}\ {\rm ratio} = W_{\rm t}/W_0\] | (2) |
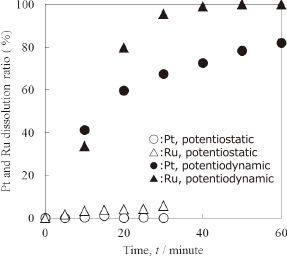
Time dependence of the Pt and Ru dissolution ratios during potentiostatic and potentiodynamic electrolysis in 1 mol L−1 HCl at R. T.
Platinum metal scarcely dissolved into the electrolyte when constant oxidation electrolysis was conducted, although Pt metal can dissolve by forming complexes with chloro ions in solution.3
| \[[{\rm PtCl}_6]^{2-} + 4{\rm e}^- = {\rm Pt} + 6{\rm Cl}^- \qquad E^\circ = 0.744{\rm V}\ {\rm vs}.\ {\rm SHE}\] | (3) |
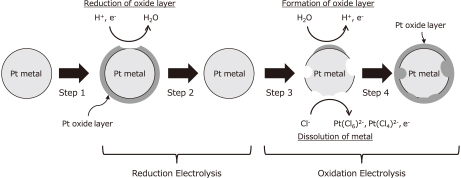
Schematic model of Pt dissolution using potentiodynaimic electrolysis.
(Step 1) Platinum metal is oxidized by the environment, such as water and air, and a thin Pt oxide layer, which has resistance against electrochemical dissolution, is formed.
(Step 2) The platinum oxide layer is reduced to Pt metal via reduction electrolysis, and the Pt metal surface is exposed.
(Step 3) The exposed Pt metal dissolves into HCl, via the formation of chloro complexes via oxidation electrolysis.
(Step 4) The platinum oxide layer forms again during the above oxidation electrolysis, and Pt dissolution stops (go back to step 2).
In Step 2, deposition of Pt metal should occur when Pt ions exist in the solution, and a suitable potential for Pt deposition is applied. That is to say, the reduction of the Pt oxide layer and the deposition of Pt metal are competing reactions. The deposition of Pt metal is not favorable for Pt recovery from MEAs because it decreases the current efficiency. In addition, in Steps 3 and 4, the dissolution of Pt metal and the formation of Pt oxide layer are competing processes. This mechanism can also be used to explain the Ru dissolution behavior. Therefore, it is necessary to investigate the effects of the potentials and holding times on Pt and Ru dissolution ratios in noble metal recovery from MEAs. However, the results show that, for achievement of noble metal dissolution, complicated potential waves, such as triangle or saw-tooth waves, are not necessarily needed. In other words, the cycling between anodic and cathodic potentials, not the potential wave profiles, is the key to achievement of noble metal recovery from MEAs.
3.3 Effects of potentials and holding times on Pt and Ru dissolution ratiosTo investigate the effects of reduction and oxidation potentials and the holding times on Pt and Ru dissolution ratios, electrolysis tests with different potentials and holding times were conducted. Figure 5 shows the dependence of the dissolution ratio on the oxidation potential in 1 mol L−1 HCl when the reduction potential was 0.1 V, at which hydrogen gas evolution does not occur. The holding times per cycle for both oxidation and reduction electrolyses were 15 s. At 1.3 V, at which Cl2 gas does not evolve on the basis of the CV results, the Pt and Ru dissolution ratios were 4.8% and 12.8%, whereas when the oxidation potential was 1.4 V, they increased to 79.7% and 80.6%. The maximum dissolution ratios reached 93.2% and 98.4% at 1.5 V, respectively. However, both dissolution ratios decreased when the positive potential was greater than 1.7 V. In the potential region from 1.7 to 1.9 V, the formation of the oxide layer was accelerated, and the metal dissolution reactions were blocked. Moreover, in the case of Ru, Ru oxide, such as RuO2, can be oxidized to RuO4, which has a boiling point of 313 K.15)
| \[{\rm RuO}_4 + 4{\rm H}^+ + 4{\rm e}^- = {\rm RuO}_2 + 2{\rm H}_2{\rm O}\qquad E^\circ = 1.387{\rm V}\] | (4) |

Dependence of the Pt and Ru dissolution ratios on the oxidation potential in 1 mol L−1 HCl at R. T. Reduction potential: 0.1 V vs. SHE. Oxidation and reduction times were 15 s cycle−1, and the cycling was repeated 120 times.

Dependence of the Pt and Ru dissolution ratios on the reduction potential in 1 mol L−1 HCl at R. T. Oxidation potential: 1.5 V vs. SHE. Oxidation and reduction times were 15 s cycle−1, and the cycling was repeated 120 times.
Figure 7 shows the dependence of the dissolution ratio on the holding time during oxidation electrolysis in 1 mol L−1 HCl when the reduction time per cycle was 15 s, and the reduction and oxidation potentials were 0.1 and 1.5 V, respectively. The total oxidation times were 30 min. Dissolution ratio curves for both Pt and Ru are concave down. The local maximum values of the Pt and Ru dissolution ratios were determined to be 93.2% and 98.4% when the reduction time was 15 s. For oxidation times over 15 s, the dissolution ratios decreased, indicating that competitive reactions occurred during oxidation electrolysis. The noble metal dissolution reaction was dominant for 15 s. After 15 s, the metal oxide layer formation reaction became dominant, and the metal dissolution reaction was suppressed by the oxide layer. Therefore, long oxidation times have a negative effect on the metal dissolution reaction, and dissolution ratios decrease. Figure 8 shows the dependence of the dissolution ratio on the holding time during reduction electrolysis with a oxidation time per cycle of 30 s. The other test conditions were the same. The dissolution ratio curve for Pt is concave down with a local maximum value of 90.0% when the reduction time per cycle was 15 s. This result suggests that the reduction of the Pt oxide layer is slow. In other words, it takes 15 s to obtain a Pt metal surface that can undergo electrochemical dissolution. The Pt dissolution ratio decreases when the reduction time is 30 s due to the competitive Pt deposition reaction. In the case of Ru, the dissolution ratio curve is not concave down, and the rate monotonically increases for reduction times less than 30 s.

Dependence of the Pt and Ru dissolution ratios on oxidation time in 1 mol L−1 HCl at R. T. Reduction time was 15 s cycle−1. Oxidation and reduction potentials were 1.5 and 0.1 V vs. SHE, respectively.

Dependence of the Pt and Ru dissolution ratios on the reduction time in 1 mol L−1 HCl at R. T. Oxidation time was 30 s cycle−1. Oxidation and reduction potentials were 1.5 and 0.1 V vs. SHE, respectively.
We showed that it was effective to conduct the potentiodynamic electrolysis for Pt and Ru dissolution in 1 mol L−1 HCl. To verify the effects of the solutions for electrochemical dissolution, electrolysis tests with different proton and chloride concentrations were conducted. The oxidation and reduction potentials were 1.5 and 0.1 V, respectively. The holding times were 15 s per cycle, and the cycle was repeated 120 times. Figure 9(a) shows the dependence of the Pt and Ru dissolution ratios on Cl− concentration. The H+ concentration was 1 mol L−1, and the Cl− concentration was varied by mixing HCl and H2SO4. The Pt and Ru dissolution ratios were 1.1% and 11.4%, respectively, when the Cl− concentration was 0.01 mol L−1. However, the dissolution ratios linearly increased versus the logarithm of the Cl− concentration. As mentioned in Section 3.2, the noble metals form soluble chloro complexes under the electrolysis conditions. Therefore, the observed rate behavior is reasonable. Figure 9(b) shows the dependence of Pt and Ru dissolution ratios on the H+ concentration with a Cl− concentration of 1 mol L−1. To maintain a Cl− concentration of 1 mol L−1, NaCl was added to the electrolyte solution. When the H+ concentration was 0.01 mol L−1 (0.01 mol L−1 HCl + 0.99 mol L−1 NaCl solution), 50.6% of the Pt and 27.9% of the Ru dissolved during potentiodynamic electrolysis. In a solution of 0.5 mol L−1 HCl and 0.5 mol L−1 NaCl, the Pt and Ru dissolution ratios were 93.8% and 90.8%, respectively. The high Pt and Ru dissolution ratios suggest that the existence of Na+ cations did not inhibit the dissolution reactions. Platinum metal can thermodynamically dissolve into an acidic solution by forming chloro complexes when the solution contains Cl−.2) The tests experimentally show that noble metals dissolve in the solutions with a low H+ concentration (0.01 mol L−1). Our results show that electrochemical dissolution methods do not require the use of strong acids, such as aqua regia.

Dependence of the Pt and Ru dissolution ratios on the (a) Cl− and (b) H+ concentrations. Oxidation and reduction potentials were 1.5 and 0.1 V vs. SHE, respectively. Oxidation and reduction times were 15 s cycle−1, and cycling was repeated 120 times.
To recover noble metals from MEAs of spent PEFCs, an electrochemical dissolution method involving potentiodynamic electrolysis was developed. By using a square potential wave, 93.2% of the Pt and 98.4% of the Ru dissolved from a MEA in 1 mol L−1 HCl at room temperature. The dissolution ratios were affected by the oxidation and reduction potentials and holding times at those potentials. In addition, the effects of the H+ and Cl− concentrations on the Pt and Ru dissolution ratios were investigated. The Pt and Ru dissolution ratios were 50.6% and 27.9%, respectively, in a solution with an H+ concentration of 0.01 mol L−1 and a Cl− concentration of 1 mol L−1; however, 1.1% of the Pt and 11.4% of the Ru dissolved in a solution with an H+ concentration of 1 mol L−1 and a Cl− concentration of 0.01 mol L−1. The results indicate that Cl− anions are required to dissolve Pt and Ru metals as chloro complexes and H+ cations promote the dissolution ratio of Pt and Ru metals.