Abstract
A new testing technique named advanced expansion due to compression (A-EDC) has been developed with an attempt to study the hoop mechanical behavior of Zircaloy-4 cladding under the pellet-cladding mechanical interaction (PCMI) and the presumed reactivity-initiated accident (RIA). The Zircaloy-4 used in this work showed elongated grains in the tube longitudinal direction, large amounts of residual strain, and crystallographic texture. The finite element method (FEM) analysis illustrates that the A-EDC test shows a uniaxial tension in the hoop direction, which has also been confirmed by experiments. In addition, the hoop stress-strain curve has been derived at room temperature by the A-EDC tests. Moreover, the fractured surface has been observed in this research.
1. Introduction
Zirconium based alloys have widely used in nuclear power plants as key structural materials on account of their outstanding merits, such as low thermal neutron capture cross section, excellent corrosion behavior and acceptable mechanical properties.1,2) If immerged into the aggressive coolant environment for a long time, cladding tubes are gradually degraded because of the corrosion reaction: Zr + 2H2O → ZrO2 + 2H2, which results in the formation of oxide layer on the tube surface and hydrides in the tube interior. In some presumed accident scenarios, such as the early heat-up stage of RIA, PCMI will occur and may impose a level of stress on cladding materials.3) Once the stress exceeded the mechanical property criteria, cladding tubes will fracture and leak radioactive materials.
Generally, the fuel cladding tubes have large enough size for mechanical tests in the longitudinal direction, for instance, the uniaxial tension tests. On the contrary, the size in the tube hoop direction is quite limited (merely 8–25 mm for outer diameter). It is necessary to design appropriate testing methods for investigating the stress-strain condition in the case of PCMI-induced failure. Until now, various of mechanical tests have been developed, including burst test4,5) and ring compression6,7). Whereas these testing methods either have some shortages in appropriately simulating the PCMI in reactor, or some of them seem to be unable to achieve a definite stress-strain state. Among these mechanical test techniques, a conventional expansion due to compression (EDC) test was initially proposed with an object to measure the tangential expandability of beryllium tube.8) Afterwards, the application of EDC test has been gradually adjusted and extended to the research field of nuclear fuel tubes, where axial compression of a polymer pellet inserted into tested cladding was conducted between a pair of pistons and the hoop expansion of inner pellet would lead to the failure of cladding. However, the conventional EDC is not well fit to accurately deduce the stress-strain relation up to severe deformation. There are difficulties in achieving reliable yield strength (YS) and ultimate tensile strength (UTS) due to the friction problems on the piston-pellet interface and piston-cladding interface.9) On one hand, compression the pistons will make the Teflon inner pellet dense, so the friction between piston and pellet is variable, resulting in uncertain friction problem. On the other hand, in the condition of severe deformation, the clearance gap between pistons and specimen will cause leakage of inner pellet materials (Teflon), which also leads to the uncertainty of friction. Also, the size of the EDC test samples is too large for irradiation experiments, such as in materials testing reactors (MTRs). Moreover, at high temperature, since the softening and melting points of Teflon are 393 K and 600 K, respectively, the EDC test is not applicable.
In order to obtain mechanical property in hoop direction and further study the PCMI experimentally, the new method named A-EDC test has been developed based on some modifications of the conventional EDC test.10) In the modifications, the inner fillers were replaced by metallic pellets, and the cladding tube size was reduced to optimize the stress-strain state for PCMI. The reduction of specimen volume also offered the benefit that the future neutron and ions irradiation experiments became more feasible. Based on the above background, this paper is organized as follows. Firstly, the microstructure of Zircaloy-4 will be examined. Then, the stress-strain state will be analyzed by both the FEM and experiments. Through A-EDC tests, the mechanical property of Zircaloy-4, especially the hoop stress-strain relation, will be studied. Lastly, the fractured surface will be observed by scanning electron miscopy (SEM).
2. Experimental Procedure
Figure 1(a) shows the coordinate system of cladding tube composed of radial (r), hoop (θ), and axial (z) directions. Figure 1(b) provides a schematic drawing of A-EDC test reported in the previous research10). In this configuration, commercially available pure Cu was set as an inner pellet (called IP), sandwiched between a pair of rigid bodies made of yttria-stabilized zirconia (YSZ). The initial diameter of Cu was 10 mm, and then reduced to 8 mm by fine machining with a final height of 8 mm. The Zircaloy-4 (Zr-1.3Sn-0.2Fe-0.1Cr) cladding was in a cold-worked and stress-relieved (CWSR) state. It had an inner diameter (ID) of 8.3 mm and an outer diameter (OD) of 9.5 mm. The tube was cut into the ring-shaped specimen and grinded to 1 mm in width finally. A solid boron nitride lubricant was smeared on the surface of Cu to minimize the friction between Cu and specimen.

In the compression test at room temperature (RT), Shimadzu AG-100KNX plus was utilized, and both the height displacement and the diameter expansion of specimen were monitored and recorded by a laser measurer, Keyence TM-3000. On one side, this device applied a set of parallel laser light to illuminates the Cu inner pellet, specimen and rigid bodies. On the other side, there was a CMOS image sensor to receive the laser light and form the projected image. On the image, one could set the regions of interest (or the measured region). The maximum length/outer diameter (OD) would be recorded every 50 ms. Thus, the hoop strain has been defined by
| \[\varepsilon_{\theta {\rm i}} = \frac{\Delta {\rm OD}_{\rm i}}{{\rm OD}_{\rm o}}\] | (1) |
where
$\varepsilon_{\theta {\rm i}}$ is the hoop strain at time t
i; ΔOD
i means the increment of outer diameter at time t
i;
$\Delta {\rm OD}_{\rm o}$ represents the initial outer diameter (9.5 mm in this work).
The compression strain rate was 6.25 × 10⁻⁴ s−1, which was equivalent to 2.0~4.5 × 10⁻⁴ s−1 as the hoop strain rate of the specimen. The solo compression of Cu inner pellet was conducted. Meanwhile, another Cu inner pellet compression was carried out with specimen in the A-EDC test.
The microstructure of Zircaloy-4 was analyzed through electron backscatter diffraction (EBSD) technique. The sample for EBSD detection was electro-polished in a mixed solution of 10% perchloric acid, 20% butyl cellosolve, and 70% methanol (vol%) at −25℃ and 10 V. The scanning rate of electron beam was 0.2 μm/s during EBSD experiment. The fractured surface was observed by SEM.
3. Experimental Results and Discussion
3.1 Microstructure of Zircaloy-4
Figure 2 shows the inverse pole figure (IPF) and pole figure (PF) of (0001)α-Zr in Zircaloy-4, respectively. In Fig. 2(a), there are some color gradients inside an individual grain that indicate a large amount of residual strains as a result of stress relieved annealing. Besides, the grains are elongated in the tubular z axis during manufacturing process as demonstrated by the elongated grain boundary (the black solid curve).

Figure 2(b) presents the (0001)α-Zr pole figure. A strong texture has been observed with the basal poles dominantly aligned in the radial direction with a split of ±(15°–30°) in the radial direction. This textured microstructure of cladding can be controlled by the Q factor11–13), which equals to Rw/RD, where Rw represents the reduction of tube wall thickness and RD is the diameter reduction. In this research, Q > 1 should be applied in the production process in view of the distribution of (0001)α-Zr. poles. Kearns factor (f)14,15) has been developed with an attempt to quantitatively describe the effective fractions of resolving (0001)α-Zr poles distributed in each of the three tube principle directions: r, z, and θ directions. For the isotropic materials, their basal poles have equal distributions in three principle directions. However, the Kearns factors of Zircaloy-4 are ~0.7 in r direction, ~0.25 in θ direction and ~0.05 in z direction, respectively. Besides, this result was in a good accordance with the basal pole figure.
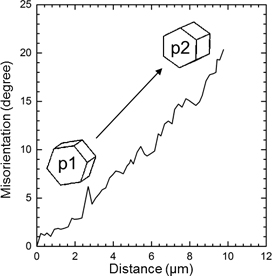
Figure 3 shows the misorientation evolution in an individual grain interior from p1 to p2 on the linear route as denoted by the dash line in Fig. 2(a). Since the Zircaloy-4 is in a CWSR state, even inside one grain, there is significantly large dislocation density. The dislocation contributes to the augment of divergences of crystal orientations, resulting in large misorientation degrees. In the investigation, the p1 was set to be the original point, and p2 was approximate 10 μm away from it. Owing to the plastic deformations and accumulative strains, an obvious increment of ~20 misorientation degrees was found between p1 and p2. The insets in Fig. 3 also vividly illustrate the crystal orientations difference between the unit cells in p1 and p2, respectively. During the cold rolling, even the plastic deformation may seem to be homogeneous macroscopically, the inhomogeneous stain gradient can still exist between two grains and even inside a grain.16,17)
3.2 Stress-strain relation
3.2.1 $\varepsilon_z/\varepsilon_\theta$ ratio and $\sigma_z/\sigma_\theta$ ratio in A-EDC test
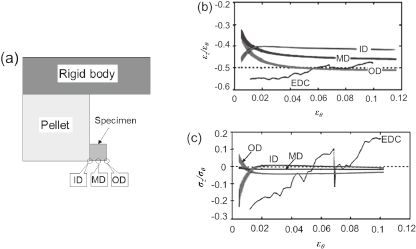
The FEM simulation of the A-EDC test has been conducted by H. Abe et al.10) In the FEM simulation work, ANSYS workbench ver. 14.5 has been utilized for the 2D axial symmetry model. The mesh size for the specimen is 0.025 mm, and for the Cu inner pellet, it is 0.05 mm. The validity of the stress state was verified by simulation of the normal operation condition of the fuel using the FEMAXI-7 code18). In the ANSYS workbench simulation, the remote dispalcement boudary condition has been used to guide the vertical displacement of rigid body from 0 mm to 1.5 mm, in order to compress the inner pellet. The contact type between rigid body and pellet was set to be rough. The contact type between pellet and specimen was frictional with the friction coefficient of 0.05. For the rigid body-pellet and pellet-specimen contacted surfaces, the augmented Lagrange method has been applied as the contact formulartion.
Figure 4(a) depicts the geometry system of A-EDC FEM simulation. For simplification, three typical positions named ID, MD, and OD, have been picked out for further analysis. In Fig. 4(b) and (c), if the pellet-cladding friction coefficient is assumed to be 0.05, the finite element method (FEM) analysis of the A-EDC test has revealed that the strain ratio of $\varepsilon_z/\varepsilon_\theta$ fluctuates slightly around −0.5, and the stress ratio of $\sigma_z/\sigma_\theta$ remains nearly zero, which is close to the uniaxial tension requirments.9,10) In the comparison, the FEM of conventional EDC test shows that its strain ratio is around −0.5, but the stress ratio ranges from −0.25 to 0.29,19), which is probably ascribed to the variable friction on the pellet-cladding contact surface.
3.2.2 Hoop stress-strain relation derived from A-EDC tests
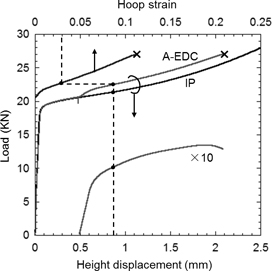
Figure 5 shows load-hoop strain and load-height displacement curves, where the hoop strain and height displacement belong to the cladding specimen and Cu inner pellet, respectively. In order to calculate the work consumed in specimen expansion, two separate tests should be performed. One is the solo Cu pellet compression, and the result has been indicated in the figure as IP. Another is carried out with a specimen around Cu inner pellet. The cross marks in the figure mean fracture of Zircaloy-4 specimen. There is a drop appeared at ~0.5 mm of height displacement in the load curve due to the removal of a jig manually when the plastic deformation of the inner pellet fairly fixed the position of the ring-shaped specimen. At the initial region (hoop strain < 3%), the profiles of Cu inner pellets with and without specimen are not strongly affected by the specimen. This has been confirmed by the reference10). The difference between load curves of IP and A-EDC, as shown in the bottom figure, is equivalent to the energy consumed by specimen expansion. In the severe deformation region, the main concerns in this work are the cladding tubes performance under PCMI such as the strain at fracture.
From the A-EDC experimental data, hoop stress-strain curves have been derived as shown in Fig. 6(a). Figure 6(b) shows the hoop strain vs time relation curve in tests 1. In the test, the hoop strain did not keep a constant. At the early stage, the hoop strain rate was ~2 × 10⁻⁴ s−1. At the final stage before fracture, the hoop strain was approximately 4 × 10⁻⁴ s−1.
Table 1 summaries the results of independent 4 tests of Zircaloy-4 by A-EDC tests. The Young's modulus is ~101 GPa; the 0.2% yield stress is ~836 MPa; the ultimate yield stress is ~1037 MPa; the maximum strain at fracture was ~0.12 on average. There are 3~5 portions of necking observed in the specimens. Apparently, with the increment of necking portions, the maximum hoop strain exhibits a growth tendency in general. The strain ratio $\varepsilon_z/\varepsilon_\theta$ is about −0.41, and the stress ratio $\sigma_z/\sigma_\theta$ is zero in A-EDC tests, which present good agreement with the FEM simulation in Fig. 4(b) and (c).
Table 1
Mechanical properties of Zircaloy-4 derived from A-EDC tests.
| Tests |
Young’s
Modulus
[GPa] |
0.2% Yield
Stress
[MPa] |
Ultimate
Strength
[MPa] |
Strain at
Fracture |
Number of
Necking |
$\varepsilon_z/\varepsilon_\theta$ |
$\sigma_z/\sigma_\theta$ |
| Test 1 |
108 |
878 |
1057 |
0.123 |
4 |
−0.42 |
0 |
| Test 2 |
104 |
843 |
1075 |
0.109 |
3 |
| Test 3 |
97 |
861 |
1000 |
0.124 |
5 |
| Test 4 |
95 |
760 |
1016 |
0.125 |
4 |
| Average |
101 |
836 |
1037 |
0.120 |
4 |
Figure 7 shows the observation of fractured surfaces in Zircaloy-4 after A-EDC tests. The overall view of fracture has been presented in Fig. 7(a). It exhibits a typical characteristic of about 45° for ductile materials in the tube z direction where shear stress reaches a maximum value. In Fig. 7(b), the fractured surface has been divided into three regions, named R1, R2 and R3. For R1 and R3, there are numerous fine dimples with a smeared feature which is supposed to be the reason of shear stress when necking occurs.20) In addition, large quantities of fine dimples are distributed in the plateau region R2. Figure 7(c) shows the magnified view of one portion in R2, from which some tearing ridges and fine dimples are indicated by arrows. In the RIA case, the strain biaxiality ratio ($\varepsilon_z/\varepsilon_\theta$) is close to 1 and the failure is triggered by through-thickness crack. M. Yamawaki's work21) conducted research on the irradiated cladding tubes under the simulated RIA case. The results demonstrates that for the cladding tube failure, many incipient cracks vertically penetrate the brittle outer surface at the initial stage, and then one of them will propagate along nearly 45° to the inner surface. Differently, the fracture of Zircaloy-4 in the A-EDC test exhibits that the crack plane propagates in the z direction, which is probably caused by mutual influence of different stress-strain conditions and material microstructures (as received one and corroded-irradiated one).

Table 2 summarized the mechanical properties of stress relieved Zircaloy-4 cladding tubes. All of these tests provide the mechanical properties in the tube hoop direction. It is evident that the A-EDC test has supplied more detailed mechanical properties than the others. Meanwhile, some slight disparities can still be observed.6,22–26) Experimentally, the A-EDC test can achieve a stable uniaxial tension condition in the hoop direction throughout the test. For the other tests, some of them are unable to derive stress-strain relation by experiments. The only approach is using simulation methods in which the appropriateness of input parameters for simulation should be cautious because of the insufficient mechanical properties parameters in anisotropic Zircaloy-4 cladding tubes (e.g. the conventional EDC). Furthermore, some tests can only maintain a uniform stress-strain state at the early stage but fail later for stress gradient (e.g. the ring tension).
Table 2
Comparisons of mechanical properties of Zircaloy-4 in the tube hoop direction.
| Methods |
Young’s Modulus
[GPa] |
0.2% Yield Stress
[MPa] |
Ultimate Strength
[MPa] |
Strain at Fracture |
$\varepsilon_z/\varepsilon_\theta$ |
$\sigma_z/\sigma_\theta$ |
Strain Rate
[s−1] |
Ref. |
| A-EDC |
101 |
836 |
1037 |
0.12 |
−0.41 |
0 |
10−4 |
This Work |
| EDC |
NA |
735 |
NA |
NA |
−0.5 |
−0.2~0.2 |
NA |
9,19,22) |
| R.T. (1) |
NA |
718 |
718 |
0.35 |
−0.5 |
0 |
10−2 |
26) |
| R.T. (2) |
NA |
830 |
950 |
0.50 |
−0.7 |
−0.5 |
10−2 |
24) |
| PST |
NA |
600 |
706 |
0.10 |
0 |
0.5 |
10−3 |
29) |
| R.C. |
99 |
855 |
905 |
0.26 |
0 |
0.5 |
NA |
6) |
| Burst |
NA |
NA |
951 |
0.09 |
NA |
0.5~1 |
NA |
26,32) |
*All the data were obtained at room temperature; *R.T.-Ring tension; *PST-plane strain tension; *R.C.-Ring compression; *NA means that the data is not available
The anisotropic behavior of cladding is very common for zirconium based cladding tubes due to the combined effect of hexagonal closed packing (HCP) crystal structure and cold rolling process. In the A-EDC test, the plastic anisotropy of cladding tube has been investigated. The parameter, R, is deduced in the hoop direction, which is defined as follows13,27–29):
| \[R = \frac{\varepsilon_z}{\varepsilon_r}\] | (2) |
where ε
z and ε
r are the width and thickness strains, respectively.
In this work, the value of R is about 1.6, which is larger than 1, implying that wall-through slip is more difficult than the slip across cladding width. This can be identified by the necking along tube z axis. In the previous studies, the parameter R values are found to be 1.3 tested in the axial direction30) and 2.3 tested in the hoop direction29) for unirradiated Zircaloy-4. On the contrary, it has been proved that the yield condition of irradiated nuclear fuel cladding is similar to those of isotropic materials, which illustrates that irradiation can reduce the anisotropic behavior of cladding tubes.31)
4. Conclusions
The mechanical property of Zircaloy-4 in the hoop direction has been studied by the newly developed A-EDC tests. Based on the experimental data and fracture observation, the main conclusions in this research can be summarized as follows:
-
(1)
The microstructure of Zircaloy-4 used in this work shows a strong anisotropic microstructure accompanied by a strong density of (0001)α-Zr pole in the tube radial direction.
-
(2)
The A-EDC test in this work can attain a uniaxial tension condition, where the $\varepsilon_z/\varepsilon_\theta$ ratio is close to −0.5 and the $\sigma_z/\sigma_\theta$ ratio is 0. This has been verified through both the FEM analysis and experiments. Moreover, the A-EDC test is able to provide more information of mechanical properties than the other tests;
-
(3)
The fracture behavior in A-EDC test is different from that in RIA case, which can be attributed to the combined effects of different stress strain states and material microstructures. The anisotropic mechanical behavior of stress relieved Zircaloy-4 has been confirmed in the A-EDC tests.
Acknowledgements
This work is supported by the project of “R&D of nuclear fuel cladding materials and their environmental degradations for the development of safety standards” entrusted to Tohoku University by Ministry of Education, Culture, Sport, Science and Technology of Japan (MEXT), and “Study on hydrogenation and radiation effects in advanced nuclear fuel cladding materials” conducted under the Strategic Promotion Program for Basic Nuclear Research by MEXT.
REFERENCES
- 1) C. Coleman: Zirconium in the Nuclear Industry, 5th International Smposium, ed. by (ASTM STP 754-EB, 1982) pp. 393–411.
- 2) K.B. Colas, A.T. Motta, J.D. Almer, M.R. Daymond, M. Kerr, A.D. Banchik, P. Vizcaino and J.R. Santisteban: Acta Mater. 58 (2010) 6575–6583. 10.1016/j.actamat.2010.07.018
- 3) L.O.M. Jernkvist, Ali R: Nuclear Fuel Behaviour under Reactivity-initiated Accident (RIA) Condition: State-of-the-art Repor, (Nuclear Energy Agency, Organisation for Economic Co-operation and Development (OECD), Place, 2010) pp. 51–53.
- 4) A. Hermann, S.K. Yagnik and D. Gavillet: J. ASTM Int. 4 (2007) 1–20. 10.1520/JAI101143
- 5) A.M. Garde, G.P. Smith and R.C. Pirek: 11th International Symposium on Zr in the Nuclear Industry, ed. by (ASTM STP 1295, 1996) pp. 407–430.
- 6) V. Busser, M.-C. Baietto-Dubourg, J. Desquines, C. Duriez and J.-P. Mardon: J. Nucl. Mater. 384 (2009) 87–95. 10.1016/j.jnucmat.2008.10.027
- 7) F. Nagase, T. Sugiyama and T. Fuketa: J. Nucl. Sci. Technol. 46 (2009) 545–552. 10.1080/18811248.2007.9711560
- 8) Y. Mishima: J. Nucl. Sci. Technol. 3 (1966) 294–297. 10.1080/18811248.1966.9732327
- 9) J. Desquines, D.A. Koss, A.T. Motta, B. Cazalis and M. Petit: J. Nucl. Mater. 412 (2011) 250–267. 10.1016/j.jnucmat.2011.03.015
- 10) H. Abe, T. Abe, S. Kishita, S. Kano, Y. Li, H. Yang, K. Tawara, Y. Matsukawa and Y. Satoh: J. Nucl. Sci. Technol. 52 (2015) 1232–1239. 10.1080/00223131.2015.1056560
- 11) E. Tenckhoff: Zirconium in the Nuclear Industry, 5th International Smposium, ed. by (ASTM International, 1982) pp. 5–21.
- 12) H. Abe, H. Tarui, T. Kobayashi, M. Honji and T. Konishi: Zirconium in the Nuclear Industry: Ninth International Symposium, ed. by C.M. Eucken, (ASTM International, 1991) pp. 35–47.
- 13) K. Linga Murty and I. Charit: Prog. Nucl. Energy 48 (2006) 325–359. 10.1016/j.pnucene.2005.09.011
- 14) J. Kearns: WAPD-TM-472, (Bettis Atomic Power Lab., Pittsburgh, PA (USA), 1965).
- 15) J. Kearns: J. Nucl. Mater. 299 (2001) 171–174. 10.1016/S0022-3115(01)00686-9
- 16) S. Sun, B.L. Adams and W.E. King: Philos. Mag. A 80 (2000) 9–25. 10.1080/01418610008212038
- 17) A.J. Schwartz, W.E. King, G.H. Campbell, J.S. Stölken, D.H. Lassila, S. Sun and B.L. Adams: J. Eng. Mater. Tech. 121 (1999) 178–181. 10.1115/1.2812364
- 18) M. Suzuki, H. Saitou and Y. Udagawa: JAEA-Data/Code 35 (2010) 2010.
- 19) O. Dufourneaud, A. Varias, V. Grigoriev, R. Jakobsson and D. Schrire: JAERI-Conference, (JAERI, Japan, 2002) pp. 142–162.
- 20) B.V. Cockeram and K.S. Chan: J. Nucl. Mater. 434 (2013) 97–123. 10.1016/j.jnucmat.2012.11.005
- 21) M. Yamawaki, K. Yamaguchi, T. Fuketa, H. Sasajima, Y. Mori and K. Ishijima: J. Nucl. Mater. 248 (1997) 249–256. 10.1016/S0022-3115(97)00173-6
- 22) T. Fukuda, T. Mihara, M. Amaya, T. Sugiyama and F. Nagase: International Atomic Energy Agency (IAEA) (2013) 77–83.
- 23) S.-K. Kim: Advances in Nuclear Fuel, ed. by (InTech, 2012) pp. 143–158.
- 24) R.S. Daum: Hydride-induced Embrittlement of Zircaloy-4 Cladding under Plane-strain Tension, Doctoral thesis, Penn State University, (2007) pp. 105–115.
- 25) A. Hellouin de Menibus, Q. Auzoux, P. Mongabure, V. Macdonald, T. Le Jolu, J. Besson and J. Crepin: Mater. Sci. Eng. A 604 (2014) 57–66. 10.1016/j.msea.2014.02.075
- 26) J.H. Kim, M.H. Lee, B.K. Choi and Y.H. Jeong: J. Alloy. Compd. 431 (2007) 155–161. 10.1016/j.jallcom.2006.05.074
- 27) S.R. Agnew and Ö. Duygulu: Int. J. Plast. 21 (2005) 1161–1193. 10.1016/j.ijplas.2004.05.018
- 28) R.W.L. Fong: J. Nucl. Mater. 440 (2013) 288–297. 10.1016/j.jnucmat.2013.04.089
- 29) T.M. Link, D.A. Koss and A.T. Motta: Nucl. Eng. Des. 186 (1998) 379–394. 10.1016/S0029-5493(98)00284-2
- 30) P. Delobelle, P. Robinet, P. Bouffioux, P. Geyer and I. Le Pichon: Zirconium in the Nuclear Industry: Eleventh International Symposium, ed. by (ASTM STP 1295, 1996) pp. 373–321.
- 31) M. Nakatsuka: J. Nucl. Sci. Technol. 28 (1991) 356–368. 10.1080/18811248.1991.9731368
- 32) H.M. Chung and T.F. Kassner: Nucl. Eng. Des. 186 (1998) 411–427. 10.1016/S0029-5493(98)00286-6