Estimating the Spatial Distribution of Ca Dopants in α-SiAlON by Statistical Analysis of HAADF-STEM Image
2017 Volume 58 Issue 10 Pages 1341-1345

Details
2017 Volume 58 Issue 10 Pages 1341-1345
We analyzed the spatial distribution of Ca dopants in α-SiAlON by using a statistical approach that analyzed a high-angle annular dark-field (HAADF) scanning transmission electron microscopy (STEM) image. By evaluating the image intensity of each atomic column, we found that the intensity deviation of columns with Ca atoms was twice that of other atomic columns. The results of HAADF-STEM image simulation suggested that there was a long-range repulsive interaction along the [0001] direction between pairs of Ca atoms in the same Ca column. Moreover, correlation of image intensities in neighboring Ca columns suggested the existence of a short-range repulsive force between first-nearest-neighbor Ca atoms. The origin of such anisotropic interactions between pairs of Ca atoms will be discussed.
Recent progress in spherical aberration-corrected scanning transmission electron microscopy (Cs-corrected STEM) enables us to see the sub-angstrom atomic structure of materials and to identify the atomic species present in specific site1–7). In high-angle annular dark-field (HAADF) STEM, the contrast of each atomic column is proportional to Z1.6–2.0, where Z is the atomic number, because thermal diffuse scattering (TDS) is the dominant scattering mechanism in electrons scattered at relatively high angles. HAADF-STEM is advantageous because it can observe individual heavy dopant atoms in a host material, and thus it is widely used for assessing the substitutional sites of minor dopants in materials such as As in Si8), Ce in AlN9) and BN10), Eu and Ce in SiAlON11–13).
α-SiAlON is a ceramic consisting of Si, Al, N, and O in an α-Si3N4 equivalent crystal structure. Because some of its Si–N bonds are replaced with Al–N and Al–O bonds, maintaining the charge neutrality of the crystal requires compensation by introducing interstitial cations. Ca-doped α-SiAlON has been used as a structural ceramic because of its high mechanical strength, wear resistance, corrosion resistance, and high-temperature oxidation resistance14–19). However, further information about the distribution of Ca atoms in the α-SiAlON structure is needed in order to improve its material properties and to find its optimal composition. Unfortunately, it is difficult to image Ca atoms in α-SiAlON, even with HAADF-STEM.
One reason for this difficulty is that the atomic concentration of Ca is not high enough to allow for Ca atoms to be distinguished from other elements such as Si and Al. Moreover, a relatively high concentration of Ca dopants causes an overlap of Ca atoms along a given atomic column observed by HAADF-STEM. Thus, we cannot determine the distribution of Ca atoms in α-SiAlON by using only HAADF-STEM. Recently, we predicted a plausible distribution of Ca atoms in α-SiAlON by using a statistical approach that analyzed the image intensities of individual Ca columns20). Our results revealed a certain repulsive force between pairs of Ca atoms in the crystal. However, it is still unknown about the anisotropy of the repulsive force in the α-SiAlON crystal.
In the present study, we investigated a plausible distribution of Ca atoms in α-SiAlON based on a HAADF-STEM image by using the same statistical approach as in our previous work. We also assessed the correlation of image intensity between adjacent Ca columns in order to understand the anisotropy of the repulsive force between neighboring Ca atoms in the crystal.
Commercial Ca-doped α-SiAlON powders (Combustion Synthesis Co., Ltd, Sapporo, Japan) were mixed with fine Cu powders and hot-pressed at 300℃ for 1 h to make a composite disk that contained α-SiAlON. The disk was sliced, mechanically polished down to a thickness of 20 µm, and ion-milled with 3-kV Ar+ ions (Gatan PIPS model 691). HAADF-STEM was then performed at 300 kV (FEI Titan3 G2 60–300). The inner correction semi-angle of the HAADF detector was set to 64 mrad, and the convergence semi-angle of the electron probe was 22 mrad. The HAADF-STEM images were simulated by using the Dr. Probe multi-slice (MS) image simulator21), which accounts for TDS by using the frozen phonon method. The effective source size was assumed to be 0.06 nm at the full width at half maximum. The present MS simulation used a supercell with dimensions of 6.2 × 6.8 × 20 nm, which included 840 Ca atoms in the cell.
Figure 1 shows a typical TEM image of an α-SiAlON particle surrounded by Cu particles as well as HAADF-STEM images obtained from regions “A” and “B”. The expected sample thickness of region “A” was thinner than that of region “B,” and the background intensity of the HAADF-STEM image of region “A” gradually decreased while moving closer to the sample edge. As mentioned in Ref. 20), the relative intensities of adjacent Si and N columns depend on sample thickness. The estimated sample thicknesses of regions “A” and “B” were 4–6 nm and 20 nm, respectively. Here we neglected the influence of the change in thickness, and we choose region “B” for the following analysis of the HAADF-STEM image.

TEM image of an α-SiAlON grain and HAADF-STEM images in thinner (A) and thicker (B) regions.
Figure 2(a) shows a HAADF-STEM image with dimensions of 8 × 8 nm acquired from region “B,” and Fig. 2(b) shows the atomic structure model of the area shown by the yellow frame. Based on the brightness of each atomic column, individual Ca columns showed different intensities. Figure 2(c) shows a histogram of the intensity distributions of the Ca, Si, and N columns indicated by arrows in Fig. 2(b). The intensity distribution spread more for the Ca columns than for the Si and N columns. Table 1 gives the averaged intensities and dispersions. The dispersion in the Ca columns was twice that in the Si and N columns. This Ca columns may have shown large dispersion because of the varying numbers of Ca atoms occupying individual Ca columns. Here we assumed that the sample thickness was 20 nm and that the total number of interstitial sites containing the Ca atom was 35. The average occupancy of Ca has been measured to be 0.15 by energy-dispersive X-ray spectroscopy, so the average number of Ca atoms was estimated to be about 5 per Ca column. The wide intensity distribution of the Ca columns indicates that the number of Ca atoms in each column should vary—that is, it should be less than 5 in some Ca columns and more than 5 in other columns.
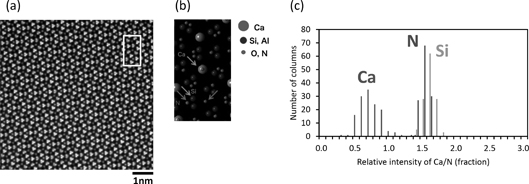
(a) [0001] HAADF-STEM image and (b) corresponding atomic model of α-SiAlON. Distributions of the image intensities of Si, N, and Ca columns are plotted in (c).
| Ca | Si | N | |
|---|---|---|---|
| averaged intensity | 0.76 | 1.60 | 1.50 |
| dispersion | 0.18 | 0.09 | 0.08 |
To clarify the influence of the distribution of Ca atoms, we performed MS simulations with several atomic models, as shown in Fig. 3. A supercell with dimensions of 6.2 nm × 6.8 nm × 20 nm was built, which included 160 Ca columns along the [0001] direction. The number of interstitial sites with Ca in the supercell was 5600, and we placed 840 Ca atoms in the columns because the measured occupancy of Ca was estimated to be 0.15. As shown in Fig. 4, we chose four atomic models with different configurations of Ca atoms. The “random” model has a fully random distribution of Ca atoms inside the supercell. In this model, the number of Ca atoms differs in each column, so contiguous Ca atoms appear in some places along a column. In the “1v” model, the Ca atoms are randomly scattered in the supercell, same as in the “random” model, but one vacancy is introduced between contiguous Ca atoms in order to prevent continuous arrays of Ca along a column. Similarly, the “2v” and “3v” models have two and three vacancies, respectively, between contiguous Ca atoms in the column. These models appear to show that a repulsive interaction exists between Ca atoms in a given Ca column.
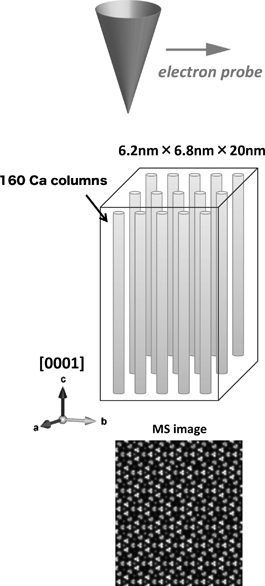
Schematic showing a supercell used in the HAADF-STEM image simulation.
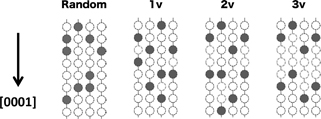
Atomic models with various configurations of Ca atoms along the [0001] direction.
Figure 5 shows the intensity distributions of the Ca columns calculated by using the above models, compared with the experimental data. This figure also shows information on the dispersion. The “random” model shows a dispersion twice that in the experimental data, which overestimated the intensity variation in the Ca columns. When vacancies are introduced between contiguous Ca atoms, the dispersion decreases. This trend becomes obvious as the number of vacancies increases. The “3v” model agrees well with the experimental data in regards to the intensity distribution of the Ca columns. Table 2 summarizes the maximum/minimum occupancies in the group of Ca columns and their dispersions for the each atomic model. In the random model, it was indicated that there was a column having twice Ca atoms as compared with the average value while no Ca atom existed in some other columns. The differences between maximum and minimum occupancies decrease as increases of the number of the vacancies between contiguous Ca atoms; therefore the dispersion of the occupancy was smallest in the “3v” model, suggesting a strong correlation between the dispersion of image intensity and the occupancies of individual Ca columns. Hence, we believe that a pair of Ca atoms experiences a long-range repulsive force along the [0001] direction in α-SiAlON.
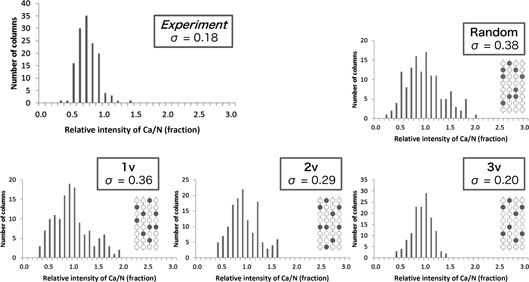
Intensity distributions of the Ca columns obtained from experimental data and the results of MS image simulation.
| Random | 1v | 2v | 3v | |
|---|---|---|---|---|
| Maximum occupancy | 0.31 | 0.29 | 0.26 | 0.20 |
| Minimum occupancy | 0.00 | 0.06 | 0.06 | 0.09 |
| Deviation | 0.06 | 0.05 | 0.04 | 0.03 |
The experimental data of image intensity variation in the Ca columns suggest that there is long-range repulsive interaction of Ca atoms along the [0001] direction in α-SiAlON. Nevertheless, there remains no information on interactions between neighboring Ca atoms across columns. To clarify the Ca atom distribution in adjacent Ca columns, we plotted the intensities of all of the Ca columns as follows: First, we selected a Ca column and measured the image intensity there (red circle on the left side of Fig. 6) as the value on the horizontal plot axis. Then, we selected three other Ca columns, each adjacent to a previous column, and measured their intensities as values on the vertical plot axis. Figure 6 shows a schematic of this procedure. We repeated this procedure for all Ca columns and plotted these data points.

Schematic showing the spatial relationship between Ca columns, and a scatter plot based on the image intensities of adjacent Ca columns.
Before considering the present method, we assessed another atomic model in the MS simulations: the “3v-no_1st” model. Figure 7 shows an overview of this model. The “3v” model neglects the interactions between pairs of Ca atoms in different Ca columns, where adjacent Ca atoms exist in neighboring Ca columns. This pair corresponds to the first-nearest-neighbor Ca atoms in α-SiAlON. In contrast, the “3v-no_1st” model excludes the first-nearest-neighbor Ca pair as same as the array of contiguous Ca atoms in the column. This new model implies that a strong short-range repulsive interaction exists between first-nearest-neighbor Ca atoms.

The “3v” and “3v-no_1st” atomic models used in the MS image simulation.
Figure 8 shows scatter plots of the two atomic models according to the procedure in Fig. 6, together with the experimental data. Reflecting the dispersion in the Ca columns, these data points have immense scatter, but they still show a weak negative correlation. This result indicates that the number of Ca atoms in the columns decreases near neighboring Ca columns with many Ca atoms. Now, we will discuss the similar plots obtained from MS images based on the “3v” and “3v-no_1st” models. Any small correlation between data points would never appear if we neglected the interactions of Ca atoms in different Ca columns (model “3v”). This contradicts the trend shown in the experimental plot. However, the prediction from the atomic model without the first-nearest-neighbor Ca pair (“3v-no_1st”) shows a negative correlation, same as the experimental data. Thus, we expect that the first-nearest-neighbor Ca atoms also experience strong repulsive interactions. Because the occupancy of Ca is 0.15, we could not make any atomic model that accounts for the long-rage repulsive interaction of Ca both inside and outside a column. In other words, if we placed Ca atoms separated by three or more vacancies along the [0001] direction, we could not remove all of the first-nearest- and second-nearest-neighbor Ca atoms. This fact implies that anisotropic repulsive forces act on the Ca atoms in the α-SiAlON crystal.
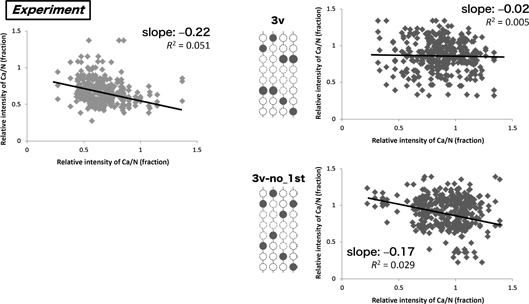
Scatter plots of the image intensities of adjacent Ca columns obtained from experimental and MS data.
By performing a statistical analysis of the intensity of the HAADF-STEM images of α-SiAlON, we found anisotropic interaction of Ca atoms. Now we will discuss the origin of such anisotropy. In general, a Ca atom is introduced into the α-SiAlON host as a divalent cation to maintain the charge neutrality of the crystal. This should introduce a repulsive Coulomb interaction between a neighboring pair of Ca ions. There are several atomic models of α-SiAlON in which there are only two Ca atoms and other elements (Si, N) between those Ca atoms, as shown in Fig. 9. If we consider the two adjacent Ca atoms along the [0001] direction, only one N atom is located between the Ca atoms (“1v” model). In the “3v” model, there are three N atoms between the Ca atoms. These N atoms would weaken the repulsive force between the Ca atoms by the screening effect, but this effect should not be significant. One N atom is also located between the first-nearest-neighbor Ca atoms, same as in the “1v” model. In contrast, a series of three N and two Si atoms exists between the third-nearest-neighbor Ca atoms which occupy different Ca columns. The charge redistribution of the valence electrons of these sandwiched atoms should hinder the repulsive interaction of the Ca atoms. A similar situation occurs even if other Ca atoms are located in adjacent columns. We conclude that the repulsive force between the Ca atoms in different columns is smaller than that in the [0001] direction.
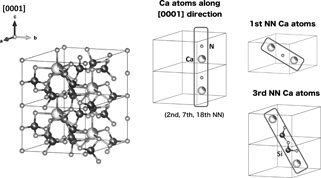
Atomic structure model of α-SiAlON and atomic models only with two Ca atoms and other elements (Si, N) between those Ca atoms.
We investigated the spatial distribution of Ca dopants in α-SiAlON by using a statistical approach that analyzed a HAADF-STEM image. By statistical evaluation of the image intensities of individual atomic columns, we found that the deviation of image intensity in atomic columns with Ca was twice that in columns with other elements. By comparing the HAADF-STEM image with simulation results, the experimental variation of image intensity in the Ca columns suggested the presence of long-range repulsive interaction between Ca atoms along the [0001] direction in α-SiAlON. Moreover, by correlating the image intensities in neighboring Ca columns, we believe that a short-range repulsive force exists between first-nearest-neighbor Ca atoms. The anisotropic interaction of Ca atoms appears to come from charge redistribution of the valence electrons of these sandwiched atoms, which hinders the repulsive interaction of the Ca atoms.
We gratefully acknowledge Mr. K. Ohkubo, Mr. R. Oota, Mr. T. Tanioka, Ms. Y. Yamanouchi, and Ms. E. Obari for their technical support in TEM operations. Part of this work was conducted at Hokkaido University, supported by the “Nanotechnology Platform” Program of the Ministry of Education, Culture, Sports, Science and Technology (MEXT), Japan. This work was also supported by JSPS KAKENHI (Grant Number 26249098).