2. Experimental Procedure
2.1 Material and apparatus
For the thermal spray material, a commercially available Fe-Cr-Mo-based metallic glass spray material (Topy Industries, GALOA–A, mean diameter of 23.7 μm, glass transition temperature of 621℃) was used. Table 1 and Fig. 1 show the chemical composition and a secondary electron image (SEI) of the metallic glass particle, respectively. The particle diameter of the metallic glass material used in this study was approximately 10–40 μm. Although atomized metal particle is usually affected by manufacturing processes such as solidification and particles often exhibit a nonspherical shape, the observed particles were solidified with a nearly spherical shape. A substrate of cold-rolled mild steel (SPCC) was prepared by blasting with fused alumina abrasive. The metallic glass particle was sprayed using a specially designed H2-HVOF apparatus (Sulzer Metco, DJ2600) and a conventional propylene (C3H6)-HVOF apparatus (Sulzer Metco, DJ2700) for comparison under the spray conditions shown in Table 2.
Table 1
Chemical composition of Fe-Cr-Mo metallic glass particle.
| Element |
Fe |
B |
C |
Si |
Cr |
Mo |
| (mass%) |
bal. |
2.0 |
3.4 |
0.35 |
16.0 |
30.0 |
| |
Al |
S |
Ti |
Mn |
Cu |
| |
0.05 |
0.015 |
0.05 |
0.25 |
0.05 |
| Element |
Fe |
B |
C |
Si |
Cr |
Mo |
| (at%) |
bal. |
9.4 |
14.4 |
0.63 |
15.7 |
15.9 |
| |
Al |
S |
Ti |
Mn |
Cu |
| |
0.09 |
0.02 |
0.05 |
0.23 |
0.04 |
Table 2
Conditions of thermal spraying for DJ2600 gun (a) and DJ2700 gun (b).
| (a) Hardware: DJ2600 (H2-HVOF) |
| Gas flow (Normal Liter Per Minute) |
| O2 |
H2 |
Air |
| 147 |
717 |
438 |
| (b) Hardware: DJ2700 (C3H6-HVOF) |
| Gas flow (Normal Liter Per Minute) |
| O2 |
C3H6 |
Air |
| 127~253 |
77 |
375~463 |
The as-sprayed coating was observed using an optical microscope and a Schottky field-emission scanning electron microscope (JEOL, JSM-7001F, hereinafter referred to as SEM) after polishing with wet abrasive paper and diamond paste, and the bulk glass structure was analyzed using an X-ray diffractometer (PANalytical, Empyrean, hereinafter referred to as XRD). To evaluate of the corrosion resistance for different spray conditions, a combined cyclic corrosion test instrument (Suga Test Instruments, CYP-90D) was used. In accordance with JIS H 8502, a specimen of 100 mm square was cyclically exposed to a salt spray phase for 2 h at 35℃, an air-drying phase for 4 h at 60℃, and a condensation humidity ‘wetting’ phase for 2 h at 50℃. The cyclic corrosion test was continued for 1578 h (about 197 cycles).
Investigation of the crystallinity of coatings at elevated temperatures is also needed, because coatings sprayed with H2 gas require heat resistance and wear resistance in applications. Therefore, some spray coatings were heat-treated by an electric furnace in air at 773 K (500℃) to 1073 K (800℃) for 1800 s (0.5 h) to 360 ks (100 h). Since the coated surfaces were oxidized after the heat treatment, the surface of each specimen was polished and the inside of the coatings was observed using an optical microscope and the SEM. The changes in the crystallinity were evaluated from 2θ = 30 to 60° using the XRD. Moreover, the as-sprayed coatings and the heat-treated coatings were observed with using a scanning transmission electron microscope with Cs correction (JEOL, JEM-ARM200F, hereinafter referred to as STEM). Vickers hardness was also measured at a 200 g load for 15 s using a micro hardness tester (Akashi, MVK-H100). The correlation between the apparent crystallinity and Vickers hardness was estimated.
3. Results and Discussion
3.1 Microstructure and corrosion resistance of as-sprayed specimen
Cross-sectional microstructure images of the as-sprayed specimens using H2 and propylene gases are shown in Figs. 2(a) and (b), respectively. The effect of the heat treatment on the microstructure of the specimens sprayed using H2 gas is also shown in Figs. 2(c)–(e). The as-sprayed specimen in Fig. 2(a) has 2.0 vol% of microscopic pores in the coating. Although some alumina abrasive particles remained on the substrate, the bonding was tight. The specimen sprayed using propylene gas has 2.6 vol% of microscopic pores and the bonding was also tight. Since it has been reported that the self-fluxing alloy coatings formed by flame spraying without a fusing process have 7 to 14.5 vol% of microscopic pores11–14), the coatings sprayed using H2 gas are expected to be superior to the self-fluxing alloy coatings in terms of corrosion resistance. The tensile strength of the as-sprayed specimens using H2 gas and propylene gas was measured in accordance with JIS H 8402 (Test methods of tensile adhesive strength for thermal-spray coatings), and both specimens were found to have a tensile strength of over 7.0 MPa because the adhesive part broke and coatings did not damage during the test.

The equations of the combustion reactions of H2 and propylene are generally described as follows.
| \[
{\rm H}_{2} + 1/2{\rm O}_{2} = {\rm H}_{2}{\rm O} + 286\,{\rm kJ}
\] | (1) |
| \[
{\rm C}_{3} {\rm H}_{6} + 9/2{\rm O}_{2} = 3{\rm CO}_{2} + 3{\rm H}_{2}{\rm O} + 2060\,{\rm kJ}
\] | (2) |
Thus, the amount of heat generation for H
2 was much lower than that for C
3H
6, which indicates that a much larger amount of H
2 is necessary to melt the metallic glass particle. However, by adjusting the gas flow rate and selecting a suitable spray gun, it should be possible to from coatings with satisfactory quality by the H
2 gas process. Furthermore, the CO
2 emission of the H
2 reaction was 0 g/min and that of the C
3H
6 reaction was 437 g/min. This means that using H
2 for a fuel decreases the CO
2 emission from the spray- coating process.
The result of combined cyclic corrosion is shown in Fig. 3. The surface of the specimen sprayed using H2 in Fig. 3(a) remained in good condition until 143 h; however, about 1 mm2 of corrosion rust was observed at 286 h, with increased to about 1 cm2 at 1578 h. The specimen sprayed using C3H6 in Fig. 3(c) remained in good condition until 286 h, and then specimen had about 1 mm2 of rust on the surface from 499 to 1578 h. Since the as-sprayed coatings generally contain through pores, sealing or fusing treatments are required to purge the through pores. In this H2-HVOF spray process, a fusing treatment is not conducted. Thus, salt water can penetrate the coating through tiny microscopic pores and form rust on the substrate. Hence, a sealing treatment with an alkoxysilane based sealer was conducted. As a result, a significant amount of rust was not generated on the coatings until 1578 h, as shown in Fig. 3(b), although slight discoloration was observed from 499 h. Thus, after the sealing treatment, the specimen sprayed using H2 exhibited similar or superior corrosion resistance to that sprayed using C3H6 gas.

The glass phase of the metallic glass is expected to change to a crystal phase when it is used at elevated temperature. Thus, the changings in the microstructure upon heat treatment were investigated. Cross-sectional optical images of specimens heat-treated at 600℃, 700℃, and 800℃ for 2 h are respectively shown in Figs. 2(c)–(e). The porosities of the heat-treated coatings at 700℃ and 800℃ were 7.6 vol% and 7.4 vol%, respectively, which were greater than that of as-sprayed coating (2.0 vol%). It has been reported that the volume of an amorphous material tends to decrease upon crystallization15). Therefore, the changes in the crystallization and microstructure of the coatings were investigated.
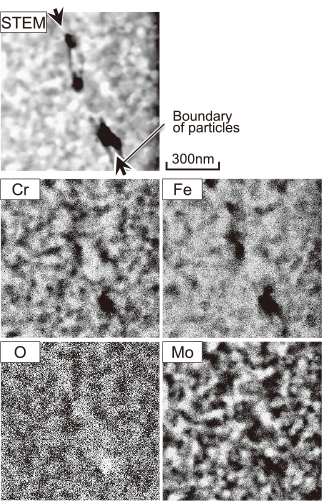
X-ray diffraction profiles of the as-sprayed coating after spraying using H2 gas and several heat-treated coatings are shown in Fig. 4. For the as-sprayed coating, a broad diffraction profile was detected around 35–50°, indicating that the coating almost entirely consists of an amorphous phase. Similarly, the diffraction profiles of the coatings heat-treated at 500℃ and 600℃ for 2 h also had a broad pattern and no sharp peaks. In contrast the coatings heat-treated at 700℃ and 800℃ for 2 h had sharp peaks in the diffraction profiles, suggesting that crystallization occurred in these coatings around these temperatures. In addition, since the full width at half maximum (FWHM) of each peek at 800℃ is narrower than that at 700℃, the crystallization proceeded at the higher temperature. Thus, the cross-sectional microstructures of the spray coatings were observed by SEM. As shown in Fig. 5(a), micropores and lamella microstructures were observed in the as-sprayed coatings, and the metallic glass particles were clearly compressed by the collision with each other and coalesced with the substrate and the previously coated layers during spraying. Okuwa has been reported that metallic glass particles did not always melt during HVOF spraying7–9); however, the flatness of the coating suggests the low viscosity of the spray particle corresponding to a liquid phase. In Fig. 5(b), there was little contrast in the bright metallic glass phase in the as-sprayed specimen, which indicates that the alloying elements are uniformly solid-soluted in the metallic glass coating. Figures 5(c) and (d) show compositional images of the microstructures after heat treatment at 800℃ for 2 h, where bright and dark spots with a diameters of 10 nm orders appeared in the coating. This contrast can be considered to be due to the phase separation resulting from a fluctuation of the composition. Considering the results of X-ray diffraction, the heat treatment at 800℃ for 2 h may crystallize the metallic glass. Moreover, a fluctuation pattern appears between the particles at the boundary of the coating. The microstructure of the coating subjected to the heat treatment at 800℃ for 2 h was observed by using STEM and EDS. Figure 6 reveals that the black areas in the STEM image have a high concentration of O, and are thus oxidized particles. Moreover, the fluctuation pattern appears in other areas in the STEM image. The pattern of Mo approximately corresponds to the bright area, and Cr and O were concentrated in the gray area in the STEM image. Since the bright area and gray area have lower O concentrations than the oxide area, oxygen may stay as the solid solution inside the particles. Therefore, Mo-rich and Cr-rich phases can crystallize at elevated temperatures.

The crystallization process and the change in hardness of the metallic glass during heat treatment were evaluated. For the analysis of peak profiles by XRD, several approximations have been reported such as the Lorentz function, the Gauss function, the pseudo-Voigt function combined with the Lorentz function and Gauss function, and the Pearson VII function16). Among them, the Gaussian distribution represented by the following formula is useful as a simple means of predicting the intensity of a profile;
| \[
I(2\theta) = I_{0}\exp
\left\{
- \frac{(2\theta - 2\theta_{C})^2}{2\sigma^{2}}
\right\}
\] | (3) |
where
I is the intensity of diffraction,
I0 and 2
θC are the peak intensity and the angle of diffraction, respectively, and
σ2 is the dispersion of the diffraction peak. For example,
Fig. 7(a) shows the X-ray diffraction pattern of the as-sprayed specimen whose profile is well fitted with the Gaussian function (dashed line) where the parameters are
I0 = 3995 counts, 2
θC = 43.19°, and
σ2 = 9.87°.
Figure 7(b) shows the diffraction pattern of the specimen heat-treated at 600℃ for 100 h. The profile includes over ten sharp peaks with a halo peak, and these sharp peaks suggest the existence of crystal phases. Thus, the profile in
Fig. 7(b) was fitted by the profile of the glass phase in
Fig. 7(a) and the sharp-peak profiles approximated by Gauss function. The apparent crystallization was estimated using the following equation;
| \[
f_{meas.} =
\frac{\sum\nolimits_{1}^{n} S_{cry}}{S_{glass} + \sum\nolimits_{1}^{n} S_{cry}} \times 100
\] | (4) |
where,
Scry and
Sglass are the integral intensities of profiles of the crystal phases and the metallic glass phase, respectively. The apparent crystallization of the specimen heat-treated at 600℃ for 100 h was calculated to be 41.7%. The effects of the holding time and the temperature of the heat treatment on the apparent crystallization are summarized in
Fig. 8. The apparent crystallization increases with increasing holding time and temperature, and the specimen heat-treated at 800℃ for 2 h has 70% apparent crystallization.
The crystallization process from a metallic glass is generally complicated and various phenomena are involved. Thus, in this study, we supposed that the major phenomena during heat-treatment were nucleation and growth, and we predicted the crystallization process using the following Johnson–Mehl–Avrami equation;
| \[
f_{calc.} = 1 - \frac{V}{V_\infty} = \exp (- Kt^{n})
\] | (5) |
where,
V and
V∞ are the volumes of the crystallized phase at time
t and in the equilibrium state, respectively, and
K and
n are constants. The following equation is obtained by modifying eq. (5);
| \[
\ln \left\{
- \ln
\left(
1 - \frac{V}{V_\infty}
\right)
\right\}
= \ln K + n\ln (t)
\] | (6) |
Thus, the experimental data in
Fig. 8 are rearranged using eq. (6) and plotted in
Fig. 9. Using the values of
K and
n obtained from eq. (6) and
Fig. 9, fitted curves are reversely plotted with solid lines in
Fig. 8. Although fitted curve 700℃ is slightly different from the measured data, the time dependence of the apparent crystallization can be estimated using eq. (5). Meanwhile, there may be some effect of the heating time, so we also plot data considering the heating period at 360 s and 480 s at 700℃ and 800℃, respectively. The results are shown as the broken lines in
Fig. 8, and the heating time was found to have less effect than the present experimental time on the crystallization.

Figure 10 shows the effect of the holding time on the hardness of the coatings at each temperature. The hardness of the as-sprayed coating is shown by dashed-dotted lines, and the hardness of the coating obtained using H2 is 752 HV, which is 80 HV higher than that using C3H6 gas despite the higher porosity. The reason for the greater hardness is still under discussion, but one possibility is that the oxidation of particle is inhibited and the metallic surface can come in direct contact and strongly bond with each other in H2. The hardness of the coating was slightly increased by the heat treatment at 600℃. However, the hardness of the coatings held at 700℃ and 800℃ increased from an early stage. That indicates that a higher temperature and longer heat treatment result in higher hardness despite the higher porosity of the coating. Thus, the hardness of the coating was evaluated with the apparent crystallization obtained from the X-ray diffraction peak profiles as shown in Fig. 11. The Vickers hardness linearly increased with the apparent crystallization under our experimental conditions from 500 to 800℃. This result shows that the hardness of coatings containing nanoscopic crystals tends to be higher than that of the glass coating, and that the crystal size has relatively little effect. Therefore, considering the Johnson–Mehl–Avrami relationship in Fig. 9, the hardness was predicted for each temperature and plotted as solid lines in Fig. 10, where the broken lines show the values considering 360 s and 480 s heating periods. The relationship between the hardness and the holding time or temperature can be approximately estimated even though the measured hardness widely varies. Therefore, an Fe-Cr-Mo alloy metallic glass coating sprayed using H2 gas has sufficient hardness after being exposed to an elevated temperature, and the optimization of the heat-treatment conditions can result a microstructure with high heat resistance and hardness.