3. Results and Discussion
3.1 Creep deformation behavior
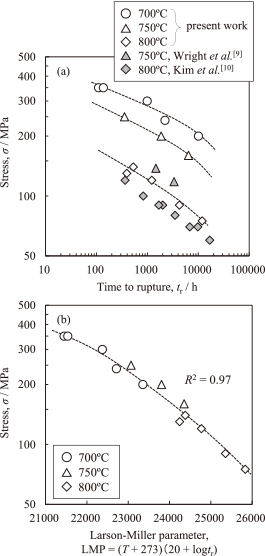
The strain rate-time curves obtained from the creep tests of times to rupture, tr, up to 2500 h and up to 12000 h are shown in Fig. 1(a) and (b), respectively. Creep deformation was observed under all creep test conditions. The arrows indicate the point of the creep interruption tests. Almost all the interruption points were in the accelerated creep region, except that at 442 h at 700℃-240 MPa, which was at the minimum creep. In the transient creep stage, the strain rate decreased rapidly and subsequently shifted to acceleration creep with no steady state. The results of the creep tests are summarized in Table 2. The relationships between stress and time to rupture, and between stress and the Larson-Miller parameter (LMP) are shown in Fig. 2(a) and (b), respectively. A Larson-Miller constant (CLM) of 20 is appropriate for normalization by the LMP for the present alloy5), and this value was used here. The creep rupture strength of the Alloy 617 used in this study was higher than the literature values9,10) in Fig. 2(a). We speculate that the difference in creep strength may arise from differences in the crystal grain diameter or in the amount of γ' phase constituent elements within the standard range. In Fig. 2(b), all the data could be approximated by a function with a determination coefficient of the least squares method, R2, of 0.97. Thus, the time to rupture at each temperature could be normalized by the LMP with CLM = 20.
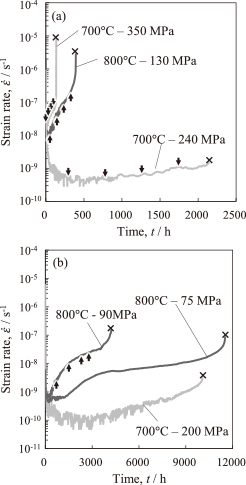
Figure 3(a) shows the relationship between the time to rupture and the minimum strain rate. At 700℃ and 800℃, the relationships did not lie on a common line. The strain rate exponent, mMG, for 800℃ was almost unity, whereas for 700℃ it was substantially lower than unity. This deviation of mMG from unity at 700℃ indicated that the strict Monkman-Grant relationship was not satisfied19). For the same minimum strain rate, the time to rupture at 800℃ was longer than that at 700℃. As shown in Table 2, the rupture elongations at 800℃ and 700℃ were substantially different. Therefore, this was a factor in why the relationship between the time to rupture and the minimum strain rate at 800℃ and 700℃ were different.
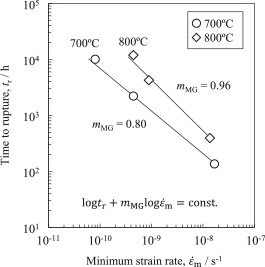
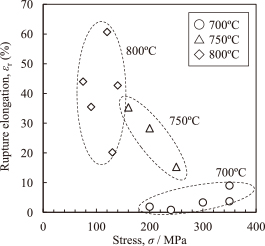
Figure 4 shows the relationship between the rupture elongation and stress. There were large differences in the rupture elongations depending on the creep test temperature. In the creep test at 700℃, fracture occurred at a very low ductility, with a maximum rupture elongation of less than 10%. At higher stresses, the rupture elongation tended to increase at 700℃, whereas the ductility decreased at higher stresses at 750℃. A large elongation of about 60% was obtained for the creep test at 800℃. The rupture elongation at 800℃ was not dependent on the stress. That is, the rupture elongation at each temperature exhibited different dependences on the stress. This result suggests that the microstructural changes during the creep deformation were different at each temperature.
3.2 Microstructure evolution
Microstructural observations were performed to investigate the fracture mechanism and causes of the different stress dependences of the rupture elongation. The SEM secondary electron images for the solution-treated sample and the sample aged at 800℃ and 700℃ are shown in Fig. 5. The sample aged at 800℃ for 4254 h was the grip portion of the crept sample. Figure 5(a) shows that the average grain size in the solution-treated sample was 50 to 100 μm. The γ' phase, which is expected to precipitate at the creep test temperature, was not observed in the solution-treated sample, whereas undissolved carbides were observed. In Fig. 5(b), two types of precipitates were observed in the sample aged at 700℃ for 10000 h. The bright regions were identified as the γ' phase and the dark regions were the M23C6 carbide. Although γ' particles were distributed uniformly, M23C6 particles were localized near or at the grain boundaries. The distribution state and type of precipitate phases in the sample aged at 800℃ were similar to those in the sample aged at 700℃, whereas the area fraction and the number density of γ' particles were lower than in the sample aged at 700℃. This is because the amount of the γ' phase precipitate at the thermal equilibrium state decreases and its growth rate increases at higher temperatures17). The area fraction of the γ' phase in the gauge portion of the creep-interrupted and creep-ruptured samples is shown in Fig. 6. The area fraction of γ' phase, which was not present in the solution-treated sample, was increased by holding at a high temperature, and it reached saturation at about 400 h. The saturated values of the area fraction were 6.4% at 700℃ and 2.7% at 800℃. The microstructural observations showed that the changes in the area fraction and the size of the precipitated γ' phase were different during creep deformation at different creep temperatures. Although M23C6 precipitated in the creep test temperature range, the amount of M23C6 is expected to be similar17) at both temperatures. Therefore, the large difference in the creep behavior depending on the temperature should be related to the dispersion of γ' phase. In addition, it is considered the γ' particles, which were uniformly dispersed in the grains, prevented the dislocation motion in the crystal grains more effectively than M23C6, which was distributed near the grain boundaries.
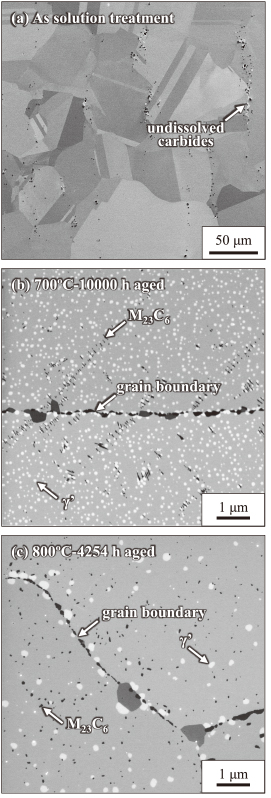
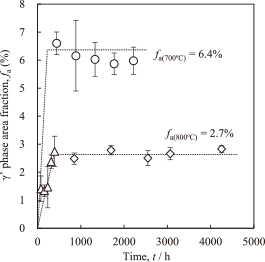
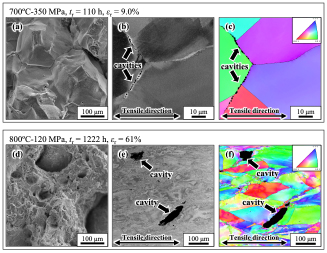
Figure 7 shows the SEM images and crystallographic orientation maps in the creep-ruptured samples at 700℃-350 MPa and 800℃-120 MPa. The cross-sectional view and the crystallographic orientation maps were observed parallel to the tensile direction of the creep test, and the horizontal direction of the images corresponds to the tensile direction. The fracture occurred at the grain boundaries at 700℃-350 MPa, in which rupture elongation εr was 9.0%, because the shape of the grains was clearly visible on the fracture surface. Many small cavities were observed at the grain boundaries transverse to the tensile direction in Fig. 7(b). On the other hand, the grain shape was unclear at the fracture surface of the 800℃-120 MPa sample in which rupture elongation εr was 61%. A dimple pattern was observed in Fig. 7(d), indicating that a ductile fracture occurred under these conditions. However, the cavities at the grain boundaries were also observed in the cross-sectional SEM image of the 800℃-120 MPa sample shown in Fig. 7(e), although the cavities were larger than those in the 700℃-350 MPa sample. Thus, despite the large differences in rupture elongation at the different creep test temperatures, the fracture was caused by cavities forming at the grain boundaries.
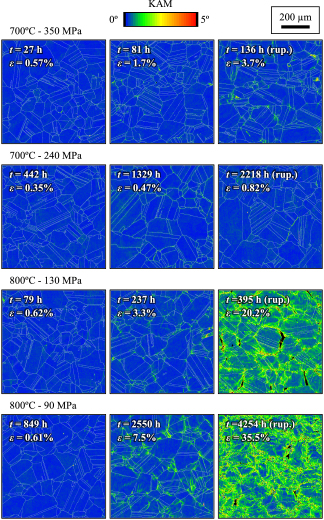
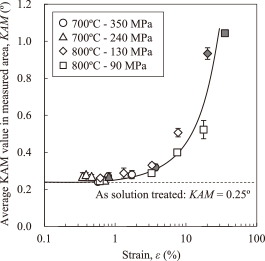
The orientation change of the crystal grains, expressed by the color gradient in the crystallographic orientation map shown in Fig. 7(c) and (f), showed that the crystal orientation inside of each individual grain was homogenous in the creep-ruptured sample aged at 700℃-350 MPa. However, an orientation change occurred in the 800℃-120 MPa sample. To evaluate the orientation change quantitatively, the kernel average misorientation (KAM) values20) were calculated from the crystallographic orientation maps of the creep-interrupted and creep-ruptured samples. The KAM value quantifies the difference in orientation between adjacent measurement points in orientation maps; it indicates localized misorientation and higher values indicate an evolution of a subgrain structure at high temperature21) such as creep deformation. Figure 8 shows the KAM maps of the creep-interrupted and the creep-ruptured samples. The high-angle boundaries (>15°) are shown by the white lines, and the magnitude of the KAM value is indicated by the color bar in the figure. There was no noticeable increase in the KAM value for the 700℃ crept sample, which ruptured at low ductility. However, the KAM value for the 800℃ crept sample increased when the creep strain was greater than several percent. In particular, the KAM values increased preferentially near the high-angle grain boundaries. The relationship between average KAM value in the measurement area and strain is shown in Fig. 9. In the solution-treated sample, the average KAM value was 0.25° and was similar to that of the solution-treated sample at the stage where the strain was small. Thereafter, when the strain exceeded about 3%, the average KAM value increased considerably. Thus, a subgrain microstructure evolved with increasing strain. All the KAM values lay roughly on a single curve. Therefore, the change in KAM with increasing strain was the same at 700℃ and 800℃. Although the evolution of the subgrain structure was the same at both temperatures, the creep sample ruptured before the subgrain structure was formed throughout the sample at 700℃.
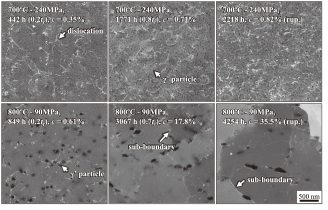
To reveal the evolution of the dislocation substructure, including the subgrain structure, the dislocation substructure was observed by SEM-ECCI. The contrast in SEM-ECC images depends on the backscattered electron intensity and thus observation objects that contain lighter elements appear as darker contrast and lattice defects, which prevent electron channeling, are observed as brighter contrast. Figure 10 shows the SEM-ECC images of the dislocation substructure in the creep-interrupted and creep-ruptured samples at 700℃-240 MPa and 800℃-90 MPa. In both crept samples, dark-contrast γ′ particles and bright-contrast dislocation lines were observed in the matrix of intermediate brightness. The change in the channeling contrast depending on the matrix crystal orientation across the sub-boundary (arrows in Fig. 10) means that the crystal orientation slightly changed at these boundaries. These observations confirmed that the creep deformation occurred through dislocation motion at both 700℃ and 800℃, because dislocation lines or their substructures were observed. In the 700℃ crept sample, from the 0.2tr-interrupted sample to the ruptured sample, each dislocation was observed as a single line. In the 800℃ crept samples, although dislocations in the 0.2tr-interrupted sample were observed as a single line, dislocations were mutually tangled and formed sub-boundaries in the 0.7tr-interrupted sample and in the ruptured sample. The dislocation density in the interior of each subgrain of the 800℃ crept samples decreased greatly, resulting from the recovery and rearrangement of dislocations. In contrast, the dislocation density in the 700℃ crept sample increased with the progression of creep deformation without the rearrangement of dislocations, even in the ruptured sample.
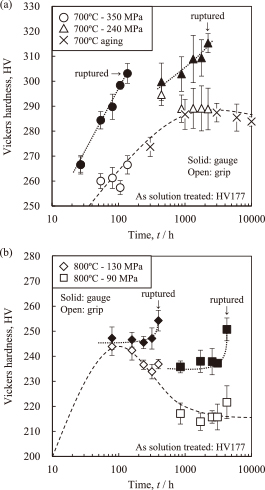
The increase in the dislocation density observed in the crept samples should cause work hardening. Therefore, to examine the work hardening behavior accompanying the creep deformation, the Vickers hardnesses of the creep-interrupted material, creep-ruptured material, and aged material were measured. Figure 11 shows the change in the Vickers hardness of the crept sample and the aged sample. Open and solid symbols indicate the hardnesses of the grip and gauge portions of the crept sample, respectively. The Vickers hardness of the solution-treated sample was HV177, and the hardness increased due to aging or creep. The hardnesses of the aged sample and the grip portion in the crept samples at 700℃ were similar. Therefore, the aging treatments at 800℃ were not performed. The hardness of the sample aged at 700℃ was higher than that of the sample aged at 800℃. This was because of the difference in the amount of precipitated γ′ phase. When the alloy was aged at 700℃, the hardness reached a maximum at around 1000 h, and then decreased slightly. On the other hand, the hardness of the grip portion in the crept samples at 800℃ reached a maximum at 100 h, decreased up to 800 h, and then became constant after 800 h. At both temperatures, the hardness was higher in the crept sample gauge portion than in the non-deformed samples, such as the crept sample grip portion and the aged sample. These results mean that the work hardening of the samples occurred through creep deformation.
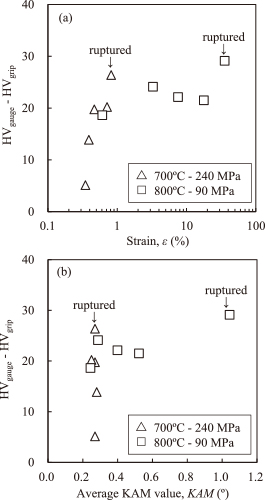
By evaluating the difference in hardness between the gauge portion and the grip portion of the crept sample, we estimated the contribution of work hardening without the effect of the precipitation strengthening on the hardness. For this purpose, the difference in the hardness of the gauge and grip portions of the crept sample (HVgauge - HVgrip) was calculated. The relationships between HVgauge - HVgrip and strain and between HVgauge - HVgrip and average KAM value are shown in Fig. 12 (a) and (b), respectively. The gauge portion hardness increased sharply at small strains of less than 1% in the 700℃-240 MPa sample, indicating that large work hardening occurred. The work hardening accompanying the creep deformation occurred at 700℃, even though these samples were interrupted in the accelerated creep region. In contrast, in the 800℃-90 MPa sample, the hardness increased similar to the sample crept at 700℃ up to 1% strain, although the subsequent increase in hardness was small. That is, the work hardening at 800℃ was smaller than that at 700℃. In the relationship between the difference in hardness of the gauge and grip portions and the KAM value, the increase in hardness became moderate when the KAM value started to increase. That is, for the crept sample at 800℃, further work hardening was suppressed by the accumulated dislocations rearranging to the grain interior and forming a subgrain microstructure.
Work hardening due to creep deformation was different at 700℃ and 800℃, because of the presence or absence of the subgrain microstructure formation. At 700℃, although the subgrain microstructure was hardly formed even after the creep fracture, the hardness was increased substantially by work hardening. In contrast, at 800℃, the formation of the subgrain microstructure suppressed further increase in the dislocation density. In addition to the difference in the recovery rate depending on the creep test temperature, the dispersion state of the γ' particles may also contribute to the cause of these differences in the formation behavior of the dislocation substructure.
Čadek et al.22) compared the stress dependence of the minimum strain rate and the microstructure after creep for Ni-based alloys containing γ′ particles. They demonstrated that, in the alloy containing γ′ particles, dislocation motion occurred but no subgrain structure was formed. From these results, they concluded that the precipitate strengthening in the alloy was caused by inhibiting the recovery of the dislocation substructure, rather than by the resistance to the dislocation motion among the dispersed particles. In addition, Seidman et al.23) reported that, in an Al alloy containing coherent precipitate particles, the presence or absence of a subgrain structure depends on the size of precipitates when the minimum creep strain rate occurs. They considered that under conditions where no subgrain structure is formed, the pinning effect of dislocations due to precipitated particles becomes more efficient because the climbing motion of the dislocations to the particles is slowed. Similarly, it has been reported that no subgrain structure formed after creep deformation in oxide dispersion-strengthened steel24).
Based on these reports, the fracture behavior and the evolution of the creep deformation microstructure in Alloy 617 could be explained as follows. In the 800℃ sample, in which the amount of γ' particle precipitate was small, the subgrain structure evolved as creep deformation occurred by balancing the increase in the dislocation density and the dislocation rearrangement. The formation of the subgrain microstructure suppressed the increase in dislocation density. Consequently, excessive work hardening did not occur in the 800℃ sample. In contrast, in the 700℃ sample, which contained large amounts of γ' particles, the recovery of the dislocations was inhibited by the densely dispersed γ' particles. Thus, the dislocation density continued to increase without the rearrangement of dislocations. Consequently, excessive work hardening occurred and the hardness continued to increase. However, the suppression of recovery by the dispersed particles is not well understood. Therefore, further research into the interaction of dislocations with the γ' particles is required to reveal the relationships between the development of the dislocation structure and the particle dispersion.
Furthermore, as shown in Fig. 3, the relationship between the minimum strain rate and the time to rupture was different between samples crept at 700℃ and 800℃. This result indicates that while the intragranular deformation was linked to fracture as a damage process at 800℃, the relationship between these processes was weaker at 700℃. At both temperatures, however, the final fracture occurred because of cavitation at grain boundaries. In general, the growth of cavities at grain boundaries transverse to the tensile direction is constrained by the surrounding crystal grains25). If the crystal grains are sufficiently deformed, the cavities at the grain boundaries grow with the deformation of the crystal grains under constraint by the adjacent crystal grains. Therefore, there is a correlation between the strain rate of the grains and the time to rupture, even if fracture is caused by cavitation at the grain boundaries. In this case, the Monkman-Grant relationship holds26) and a large rupture ductility is obtained. In contrast, if the grains are very strong, as in the 700℃ crept sample, the growth of cavities is suppressed by the strong constraint of the surrounding crystal grains. However, the result shown in Fig. 7(b) shows that cavities were formed at the grain boundaries even in this case. Therefore, in the 700℃ sample, in which the cavity growth was suppressed by the strong crystal grains, fracture was caused by a large number of small cavities linking together, rather than the growth of individual cavities. In this case, the sample did not exhibit a strict Monkman-Grant relationship because the cause of fracture and intragranular deformation were not related. In other words, the difference in the cavity growth processes was caused by the difference in the strength of the crystal grains that resulted from the microstructures formed during creep deformation, such as the dispersed γ' phase and the dislocation substructure. In particular, the excessive work hardening that occurred in the 700℃ crept sample could be a characteristic microstructural change causing the difference in the cavity growth. Furthermore, this difference in the cavitation behaviors also explained why the presence or absence of the Monkman-Grant relationship depended on the creep temperature.