Abstract
In the present work, selective extraction of rare earth (RE) metals from NdFeB magnets is investigated by studying the effects of various fluxes, viz. AlF3, ZnF2, FeF3 and Na3AlF6 in the LiF-NdFeB system. The aim is to convert RE from RE magnet into the fluoride salt melt. The results show the complete selective separation of neodymium (also dysprosium) from the magnet and formation of rare earth fluoride, leaving iron and boron unreacted. The formed rare earth fluoride can subsequently be processed in the same reactor through an electrolysis route so that RE can be deposited as a cathode product. The results of XRD and EPMA analysis of the reacted samples indicate that AlF3, ZnF2 and FeF3 can act as strong fluorinating agents for extraction of rare earth from NdFeB magnet, converting the RE to REF3.
The results confirm the feasibility of the rare earth metals recovery from scrap NdFeB magnet as raw material. The fluoride conversion-electrolysis route suggested in the present work enables the extraction of rare earth metals in a single step using the above-mentioned fluxes.
1. Introduction
In view of the issues of supply and demand of the rare earth metals due to the uneven distribution of these metals, there is a strong demand for recycling waste products, as for example, rare earth magnets. Due to the lack of technologically and economically feasible recycling technologies, only less than 1% of the rare earth elements were recycled until 20111). An effective process for the recycling of rare earth scrap is a major concern since most developed countries import their required rare earth elements2).
Hydrometallurgical and pyro-metallurgical process routes have been the subject of investigation by a number of researchers3–7). However, the drawbacks of hydrometallurgy processes are the low reaction rates and the serious environmental problems arising from the huge amounts of waste water generated in the process, which, in turn, need further processing. Alternatively, molten salt processing routes offer a more attractive flow sheet in view of the lower energy consumption, higher efficiency and higher purity of the deposits8–10). The molten salt process is currently used in the production of reactive metals such as aluminium, magnesium, sodium, potassium and also in general for the production or separation of lanthanides from actinides11).
Based on the Salt Extraction Process12,13) and for recovery of metal in the molten salt systems14), the feasibility of the neodymium extraction from NdFeB magnet in chloride salt electrodeposition method has been investigated15). A new approach involving molten fluoride bath has been proposed in a recent study at TU Delft for solving the problem of low solubility and oxyfluoride formation of rare earth oxides (REOs) in molten fluorides. In this approach, AlF3, ZnF2, FeF3 and Na3AlF6 were used as fluorinating agents in the LiF-Nd2O3 system. The rare earth oxide was converted into rare earth fluoride, which can subsequently be processed in the electrolysis route in which rare earth metal is electrochemically extracted as the deposition on the cathode. Complete conversion of REO in molten fluorides can overcome the problem of the low solubility of REOs in the molten fluorides. The objective of the present work is to examine the applicability of this process concept for the extraction of neodymium and other rare earth elements from NdFeB magnets, using AlF3, ZnF2, FeF3 and Na3AlF6 in the LiF-NdFeB system. It is interesting to examine the possibility of selective extraction of the rare earth metal from Nd magnet by fluorination. The REF3 which is formed as the result of the chemical reaction between the additives and the RE-containing components of the magnet, will be subjected to electrolysis to extract the RE as the cathodic product. To overcome fluorocarbon formation on the anode a reactive anode was employed instead of the conventionally used graphite anode. This reactive anode is anodically dissolved to re-generate the fluorinating agent in-situ in the electrochemical reactor. This method provides a one-step process for direct recycling of rare earth metal from neodymium magnet scrap by molten fluoride salt extraction and electrolysis.
2. Thermodynamic Evaluations
Prior experiments by the present authors indicate that AlF3, ZnF2 and FeF3 can be used for the extraction of neodymium from neodymium oxide. As thermodynamic calculations confirm the feasibility of the conversion of neodymium oxide to neodymium fluoride using AlF3, ZnF2 and FeF3 as fluorinating agents, these fluorides were used in the present work for the rare earth extraction from neodymium magnet (NdFeB). Due to the high price of AlF3 compared to cryolite, the use of cryolite as a substitute for AlF3 was also studied. Hence the LiF-NdFeB-Na3AlF6 system was also investigated as part of the present work.
Thermodynamic calculations of the pure components show that AlF3, ZnF2, FeF3 and Na3AlF6 act as the fluorinating agents leading to formation of REF3 (RE = Nd, Dy), while Fe remains unreacted in the molten fluorides. The standard Gibbs free energies of the binary reactions of the four systems were calculated using FactSage (Tables 1–4).
Table 1
Gibbs free energies of possible binary reactions for the formation of fluoride in the LiF-Nd
2Fe
14B-AlF
3 system at
T = 1223 K.
| Reaction |
ΔGo [kJ/mol] |
| Nd + AlF3 ⇄ NdF3 + Al |
−176 |
| Dy + AlF3 ⇄ DyF3 + Al |
−199 |
| Fe + AlF3 ⇄ FeF3 + Al |
411 |
| 3Fe + 2AlF3 ⇄ 3FeF2 + 2Al |
769 |
| B + AlF3 ⇄ BF3 + Al |
130 |
Table 2
Gibbs free energies of possible binary reactions for the formation of fluoride in the LiF-Nd
2Fe
14B-ZnF
2 system at
T = 1223 K.
| Reaction |
ΔGo [kJ/mol] |
| 2Nd + 3ZnF2 ⇄ 2NdF3 + 3Zn |
−1076 |
| 2Dy + 3ZnF2 ⇄ 2DyF3 + 3Zn |
−1121 |
| 2Fe + 3ZnF2 ⇄ 2FeF3 + 3Zn |
99 |
| Fe + ZnF2 ⇄ FeF2 + Zn |
15 |
| 2B + 3ZnF2 ⇄ 2BF3 + 3Zn |
−462 |
Table 3
Gibbs free energies of possible binary reactions for the formation of fluoride in the LiF-Nd
2Fe
14B-FeF
3 system at
T = 1223 K.
| Reaction |
ΔGo [kJ/mol] |
| Nd + FeF3 ⇄ NdF3 + Fe |
−588 |
| Dy + FeF3 ⇄ DyF3 + Fe |
−610 |
| B + FeF3 ⇄ BF3 + Fe |
−281 |
Table 4
Gibbs free energies of possible binary reactions for the formation of fluoride in the LiF-NdFeB-Na
3AlF
6 system at
T = 1223 K.
| Reaction |
ΔGo [kJ/mol] |
| Nd + Na3AlF6 ⇄ NdF3 + 3NaF + Al |
−67 |
| Dy + Na3AlF6 ⇄ DyF3 + 3NaF + Al |
−89 |
| Fe + Na3AlF6 ⇄ FeF3 + 3NaF + Al |
521 |
| 3Fe + 2Na3AlF6 ⇄ 3FeF2 + 6NaF + Al |
989 |
| B + Na3AlF6 ⇄ BF3 + 3NaF + Al |
240 |
According to the standard Gibbs energies of the reactions in Tables 1–4, aluminium fluoride reacts only with the REs in the magnet. The formation of FeF3 and BF3 are not thermodynamically feasible in the standard state. However, ZnF2 and FeF3 can not only react with REs but also with B in the magnet (Table 2 and Table 3), showing the feasibility of BF3 formation in both cases. Yet, the formation of FeF3 in the LiF-Nd2Fe14B-ZnF2 and LiF-Nd2Fe14B-Na3AlF6 systems at T = 1223 K is not favoured. In the case of the presence of Dy in the magnet, DyF3 would be formed in all systems. It is important to note that these reactions refer to the case of the reacting species at their standard state as pure substances. In the real systems, the activity of the components would be lower than unity. Due to the absence of thermodynamic data for the fluoride systems, it is not possible to calculate the equilibrium potential of the fluorides in a similar way as it has been calculated for chlorides16). Thus, the ideal Temkin model was used in order to calculate the activities of the different fluorides in the system, assuming that the magnet is dissolved in the salt, thereby forming fluorides which are completely ionized in the salt melt. Hence, the system is a mixture of cations and fluorine ions. Based on this model, the activity of a compound such as NdF3 was calculated as:
| \[a_{NdF_3} = (X_{Nd^{3+}})(X_{F^-})^3\] | (1) |
In which the
X-term refers to the ionic fraction of cations and anions:
| \[X_{Nd^{3+}} = \frac{n_{Nd^{3+}}}{\Sigma n_+} \quad {\rm and} \quad X_{F^-} = \frac{n_{F^-}}{\Sigma n_-}\] | (2) |
is the number of moles of ions. Using these activities, the relative partial molar Gibbs energies (chemical potentials) of the fluorides species in the LiF-NdFeB-AlF
3, LiF-NdFeB-ZnF
2, LiF-NdFeB-FeF
3 and LiF-NdFeB-Na
3AlF
6 systems were then calculated using the expression:
| \[\Delta \bar{G}_{NdF_3} = RT\ Ln\ a_{NdF_3}\] | (3) |
The activities and relative partial molar Gibbs energies of the fluorides are listed in
Table 5. The relative partial molar Gibbs energies of NdF
3 in all systems are lower than the corresponding values for FeF
3. Using a reactive anode in which FeF
3 is constantly generated in the system will generate sufficient amounts of FeF
3 that are instantly consumed in the fluorination of the magnet scrap. This should enable NdF
3 formation.
Table 5
Relative partial molar Gibbs energies and activities of the fluoride species in the systems with different fluorinating agents, assuming ideal Temkin behavior of the systems at
T = 1223 K.
| System |
LiF-NdFeB-AlF3 |
LiF-NdFeB-ZnF2 |
LiF-NdFeB-FeF3 |
LiF-NdFeB-Na3AlF6 |
| |
a |
Δ$\bar{G}$ [kJ/mol] |
a |
Δ$\bar{G}$ [kJ/mol] |
a |
Δ$\bar{G}$ [kJ/mo] |
a |
Δ$\bar{G}$ [kJ/mol] |
| LiF |
0.26 |
−13.6 |
0.237 |
−14.6 |
0.260 |
−13.6 |
0.211 |
−15.8 |
| NdF3 |
0.077 |
−25.9 |
0.071 |
−26.9 |
0.077 |
−25.9 |
0.063 |
−28 |
| FeF3 |
0.544 |
−6.1 |
0.496 |
−7.1 |
0.622 |
−4.8 |
0.441 |
−8.3 |
| BF3 |
0.039 |
−33 |
0.035 |
−33.9 |
0.039 |
−33 |
0.031 |
−35.1 |
| ZnF2 |
|
0.160 |
−18.6 |
|
|
| AlF3 |
0.077 |
−25.9 |
|
|
|
| Na3AlF6 |
|
|
|
0.0004 |
−78.8 |
The REF3 formed in the system will dissolve in the LiF melt which will further participate in the electrolysis process. Based on the calculated Gibbs free energies for the formation of the pure substances (Table 1 Table 4), the decomposition voltage of NdF3 at 1223 K for pure substances is about 4.7 V, not considering the over-potentials which need to be determined experimentally. This enables the extraction of Nd from the fluoride bath. In case of BF3 formation, B can be co-deposited on the cathode with the RE elements, since it has a lower decomposition voltage than NdF3. As the boron concentration in the magnet is however quite low (1 mass%), this can be neglected. Using cryolite as the extracting agent, NaF will form in the molten salt, which has a lower decomposition voltage than NdF3 (decomposition voltage of NaF at 1223 considering calculation with pure substances is ~3.6 V). The cathodic reactions will be (Reaction (5) will occur only in the case of using cryolite):
| \[{\rm RE}^{3+} + 3{\rm e}^- \rightleftarrows {\rm RE}\] | (4) |
| \[{\rm Na}^+ + {\rm e}^- \rightleftarrows {\rm Na}\] | (5) |
The anodic reaction using a reactive anode (M) is:
| \[{\rm M}\ ({\rm anode}) + {\rm xF}^-\ ({\rm salt}) \rightleftarrows {\rm MF}_{\rm x}\ ({\rm Salt}) + {\rm xe}^-\] | (6) |
A schematic diagram of the salt extraction process, including the fluorinating step and the electrochemical extraction step is shown in
Fig. 1.
3. Experiments
Lithium fluoride (98.5%-Alfa Aesar) was mixed in a glove box with NdFeB magnets (supplied by Magneti Ljubljana), which were ground into fine powder. The magnet composition as provided by Magneti Ljubljana is shown in Table 6.
Table 6
Composition of the neodymium magnet supplied by Magneti Ljubljana analyzed with XRF.
| Element |
Nd |
Dy |
Al |
Fe |
B |
Co |
Pr |
Cu |
Ga |
Total |
| mass% |
28.9 |
2.72 |
0.14 |
63.4 |
- |
2.91 |
0.67 |
0.19 |
0.07 |
99.0 |
Either aluminium fluoride (99+%-Alfa Aesar), zinc fluoride (99%-Alfa Aesar), iron fluoride (97%-Alfa Aesar) or cryolite (99%-Alfa Aesar) powder was added to the lithium fluoride and magnet mixture. This mixture was then charged into a graphite crucible. The fluorinating agents were added in the stoichiometrical amount that is needed for fluorinating the rare earth in the magnet. The mixtures were heated up to 1223 K for 3 hours under argon atmosphere. The Ar gas was purified by passing through KOH flakes for CO2 removal and also through silica gel and P2O5 to remove moisture. The gas was further purified by passing through a tube furnace containing Ti sponge which was heated to 1123 K in order to remove the traces of O2. After 3 hours treatment, the samples were quenched in liquid nitrogen.
The samples were analysed by X-Ray Diffractometry (XRD) as well as by Electron Probe Micro Analysis (EPMA) in order to determine the phases that are formed during the experiments and their compositions. For the EPMA analyses, WDS point analyses and mappings were performed at either 15 kV-15 nA or at 5 kV-15 nA. For the quantification, standards were used.
4. Results
4.1 AlF3 in LiF-NdFeB system
From the XRD pattern of the LiF-NdFeB-AlF3 sample after fluorination treatment (Fig. 2), the peaks of NdF3 phase are identified along with LiF, α-Fe and the Fe3Al intermetallic phase. Because of the low concentration of B in the magnet, B-containing phases were not detected by the XRD analysis.
Figure 3 shows the EPMA mapping of the LiF-NdFeB-AlF3 sample after fluorination treatment. Nd and Fe are separately distributed in the sample. This proves that Nd is selectively extracted from the Nd magnet, whereas Fe remains in the magnet matrix. F is detected in the Nd-containing regions and Al is distributed in the Fe-containing regions. B could not be detected in the EPMA mapping due to its low atomic number and low concentration in the NdFeB magnet.

The sample was also analyzed using EPMA point analysis. A BSE image and the measured composition of the RE-fluoride, the FeAl and the FeAlB phase are shown in Fig. 4. The results clearly show the formation of a FeAl intermetallic phase (89 at% iron and 9 at% aluminum). Boron was quantified in the FeAlB phase with concentrations of 80 at% iron, 15 at% aluminum and 1.1 at% boron. The quantification data show a fluorine concentration of 72 at% and Nd concentration of 25 at% in the REF phase. The presence of 2.5 at% dysprosium along with 25 at% neodymium was detected in the rare earth fluoride phase.
4.2 ZnF2 in LiF-NdFeB system
The XRD result of the experiment of the LiF-NdFeB-ZnF2 system after fluorination shows the formation of NdF3 in the sample (Fig. 5). LiF, Fe-Zn, Li2ZnF4 and Fe2B are the other identified phases. Nd was thus selectively extracted by ZnF2 as extracting agent and Fe remains unreacted. B also stays unreacted in the Fe2B phase. Part of the Zn has formed Fe9Zn with Fe and the rest is dissolved in the salt by forming Li2ZnF4.

The EPMA mapping of the LiF-NdFeB-ZnF2 sample after fluorination treatment is shown in Fig. 6. The formation of NdF3 is confirmed by Fig. 6 (a). The areas with higher concentration of fluoride correspond to the LiF phase. Fe and Zn are distributed in the same areas and are separated from Nd and F. In order to detect B, an EPMA mapping was performed at 5 kV (Fig. 6 (b)). B is present in the areas with the highest Fe concentration. According to the XRD results, this can be the Fe2B phase. In the areas where both Fe and Zn are present, B is present in a lower concentration. This is the FeZnB phase. The areas were both Nd and F are detected correspond to the NdF3 phase.
In Fig. 7, the BSE image of the LiF-NdFeB-ZnF2 sample after fluorination is shown. The light areas in this image are REF3 phase (RE being 23 at% neodymium and 2 at% dysprosium) with 74 at% fluorine and the dark matrix is FeZnB intermetallic phase consisting of 91 at% iron, 8 at% zinc and 1 at% boron.
In Fig. 7, the EPMA quantification results show that the dark gray grains correspond to iron boron phase with high concentration of boron (25 at% boron and 73 at% iron).
For more detailed detection of the element distribution and especially for a better detection of B, a WDS mapping was also performed at 5 kV (Fig. 6(b)). This mapping agrees with Fig. 6(a), viz. the white phase is the NdF3 phase dispersed in the grey matrix of Fe-Zn-B phase and the darker grains on the sample are Fe borides. A BSE image of the same area in the LiF-NdFeB-ZnF2 sample after fluorination is shown in Fig. 7 together with the measured phase compositions.
4.3 FeF3 in LiF-NdFeB system
The XRD result of the LiF-NdFeB-FeF3 sample after fluorination treatment is shown in Fig. 8. NdF3 has formed from the reaction between FeF3 and the Nd in the magnet. LiF and α-Fe are the two other identified phases. For the same reasons mentioned earlier, B-containing phases were not detected with the XRD analysis.
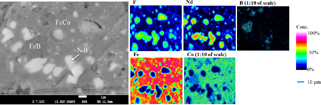
The elemental mappings of F, Nd, B, Fe and Co elements are shown in Fig. 9. Nd is extracted from the Nd magnet and forms NdF3 (the white appearing phase). Fe and Co are distributed in the same areas indicating that no FeF3 or CoF3 have formed during fluorination treatment. The slightly darker grains in the FeCoB matrix consist of Fe and B, indicating the presence of Fe borides. The concentration of Co in these grains is lower than in the FeCoB matrix. The EPMA mapping images show the presence of NdF3, FeCo and FeB phases.
4.4 Na3AlF6 in LiF-NdFeB system
The XRD result of the LiF-NdFeB-Na3AlF6 sample after fluorination treatment is shown in Fig. 10. The formation of Na1.5Nd1.5F6 shows that Nd in the magnet has substituted Al in the cryolite, hence Nd is extracted from the magnet. The small peaks related to cryolite show that a low concentration of this phase has remained in the sample. The XRD pattern also shows peaks related to α-Fe and LiF.

The EPMA elemental mappings of the LiF-NdFeB-Na3AlF6 sample after fluorination are shown in Fig. 11. The different phases in the sample were identified and are marked on Fig. 12. Fe and Co are present in the same areas. Al is distributed in the same areas as Nd and F, but its concentration is low compared to Nd. The light appearing grey grains contain Fe and Co and are clearly separated from the dark appearing phase consisting of Nd, Dy, F and Al. The very bright appearing phases in the middle of the Fe-rich grains are the phases in which the intensity of Nd and F are very high and Al is not present. This can be related to the Na1.5Nd1.5F6 phase. According to the XRD results, both Na1.5Nd1.5F6 and Na3AlF6 phases are present in the sample. The small black spots on the sample have high concentration of F in which Nd and Al are absent. This can be LiF phase.
5. Discussion
In all the experiments, Nd (and Dy in the case of the fluorinated samples after treatment with cryolite) are completely extracted from the NdFeB magnet and have formed rare earth fluoride. No (intermetallic) phases consisting of both rare earth elements and Fe were found by XRD and EPMA. This proves the complete extraction of the rare earths from the magnet. Extracted Nd had been completely converted to NdF3 after reaction with AlF3, ZnF2 and FeF3. In the case of using cryolite as the fluorinating agent, Na1.5Nd1.5F6 is formed instead of NdF3. Dissolution of Na1.5Nd1.5F6 in molten LiF during the electrochemical extraction process will lead to reduction of both Nd and Na on the cathode, due to the lower stability of NaF compared to NdF3:
| \[{\rm NaF} \rightleftarrows {\rm Na} + 1/2{\rm F}_2 \quad \Delta G^{\rm o}(T = 1223\,{\rm K}) = 571\,{\rm kJ/mol}\] | (7) |
| \[{\rm NdF}_3 \rightleftarrows {\rm Nd} + 3/2{\rm F}_2 \quad \Delta G^{\rm o}(T = 1223\,{\rm K}) = 1665\,{\rm kJ/mol}\] | (8) |
The decomposition voltages of NaF and NdF
3, which were calculated from the standard Gibbs energy of these reactions at their standard states, are −4.6 and −4.7 V for NaF and NdF
3, respectively. Na will therefore deposit on the cathode at lower voltages compared to Nd and co-deposition of Nd and Na will occur.
Both the XRD and EPMA results of the experiments with AlF3 show that Al replaced Nd in the magnet, forming FeAl and FeAlB phases and no Al in the form of fluoride is present in the system. The same results can be seen using FeF3 as fluorinating agent. All FeF3 has reacted with Nd in the magnet and Fe has replaced the rare earths in the magnet matrix, thereby forming FeCo and Fe boride phases.
In the experiment with ZnF2, XRD and EPMA results show that different Zn compounds have formed. The XRD result indicates the presence of the Li2ZnF4 phase. Besides this phase formation, EPMA analysis indicates that Zn has replaced Nd in the matrix, thereby forming FeZnB phase.
The results from the experiments with Na3AlF6 show that not all the cryolite has reacted with Nd, hence dissolution of the excess cryolite in LiF during the electrolysis process will lead to co-deposition of not only Na with Nd, but also Al.
Supposing that FeAl, FeB, FeZn and FeCo compounds (with varying stoichiometry) would not dissolve in the molten salt, it is expected that only rare earth deposition will occur during the electrolysis process. However, as was discussed earlier, in the case of cryolite treatment, co-deposition of Na and Al along with the rare earths can be expected.
Based on the thermodynamic calculations, the formation of boron fluoride appeared feasible using FeF3 as the fluorinating agent. However, the experimental results analysed by EPMA mappings show that B and Fe are distributed in the same area, indicating the presence of Fe borides. The reason that boron had not reacted with iron fluoride can be the fact that stoichiometric amount of FeF3 was used in the experiment and since REF3 has higher stability than BF3, REF3 is formed and no excess iron fluoride is present for reaction with boron. The other reason might be related to the kinetics of the reactions.
6. Conclusion
This study shows that AlF3, ZnF2, FeF3 and Na3AlF6 can act as strong fluorinating agents for extraction of Nd and Dy in the NdFeB magnet. In all the treatments, Nd was separated from the Fe and B in the magnet and was converted to rare earth fluoride. Al, Zn and Fe from AlF3 (Na3AlF6), ZnF2 and FeF3, respectively, replaced the rare earth in the magnet matrix, thereby forming compounds with Fe. In the case of cryolite, co-deposition of Al and Na along with the rare earth elements, makes cryolite as fluorinating agent unsuitable for the recovery of rare earths from NdFeB magnet.
Once NdF3 is formed, it can subsequently be electrolysed and extracted on the cathode by an electrolysis process in the same batch. Hence, conversion of the rare earth in the magnet to rare earth fluorides provide the possibility of a one-step recycling process of the rare earths from magnets. The findings of our study on the electrolysis process will be reported in the future.
Acknowledgment
This research has received funding from the European Community's Seventh Framework Programme ([FP7/2007-2013]) under grant agreement n°607411 (MC-ITN EREAN: European Rare Earth Magnet Recycling Network, Project website: www.erean.eu). This publication reflects only the authors` view, exempting the Community from any liability. Authors would also like to thank Ruud Hendrikx and Richard Huizenga for the XRD analyses.
REFERENCES
- 1) K. Binnemans, P.T. Jones, B. Blanpain, T. Van Gerven, Y. Yang, A. Walton and M. Buchert: J. Clean. Prod. 51 (2013) 1–22. 10.1016/j.jclepro.2012.12.037
- 2) O. Takeda, T.H. Okabe and Y. Umetsu: J. Alloy. Compd. 408–412 (2006) 387–390. 10.1016/j.jallcom.2005.04.094
- 3) Y. Bian, S. Guo, L. Jiang, J. Liu, K. Tang and W. Ding: ACS Sustainable Chemistry & Engineering 4 (2016) 810–818. 10.1021/acssuschemeng.5b00852
- 4) T. Nohira, S. Kobayashi, K. Kobayashi, R. Hagiwara, T. Oishi and H. Konishi: ECS Trans. 33 (2010) 205–212. 10.1149/1.3484777
- 5) A.M. Martinez, O. Kjos, E. Skybakmoen, A.r. Solheim and G.M. Haarberg: ECS Trans. 50 (2013) 453–461. 10.1149/05011.0453ecst
- 6) S. Riaño and K. Binnemans: Green Chem. 17 (2015) 2931–2942. 10.1039/C5GC00230C
- 7) H.D. Bandara, K.D. Field and M.H. Emmert: Green Chem. 18 (2016) 753–759. 10.1039/C5GC01255D
- 8) B. Mishra and D.L. Olson: J. Phys. Chem. Solids 66 (2005) 396–401. 10.1016/j.jpcs.2004.06.049
- 9) W. Han, Q. Chen, Y. Sun, T. Jiang and M. Zhang: Metall. Mater. Trans., B 42 (2011) 1367–1375. 10.1007/s11663-011-9567-5
- 10) Y. Castrillejo, M.R. Bermejo, P. Díaz Arocas, A.M. Martínez and E. Barrado: J. Electroanal. Chem. 575 (2005) 61–74. 10.1016/j.jelechem.2004.08.020
- 11) P. Taxil, L. Massot, C. Nourry, M. Gibilaro, P. Chamelot and L. Cassayre: J. Fluor. Chem. 130 (2009) 94–101. 10.1016/j.jfluchem.2008.07.004
- 12) S. Seetharaman, O. Grinder: US patent application nr. 12/991128, ref. no.: 12057 (2010).
- 13) A. Abbasalizadeh, S. Seetharaman, L. Teng, S. Sridhar, O. Grinder, Y. Izumi and M. Barati: Journal Of Materials 65 (2013) 1552–1558. 10.1007/s11837-013-0752-7
- 14) T.H. Okabe, S. Shirayama: Method and apparatus for recovery of rare earth element, US8323592 B2 (2012).
- 15) A. Abbasalizadeh, L. Teng, S. Sridhar and S. Seetharaman: Mineral Processing and Extractive Metallurgy 124 (2015) 191–198. 10.1179/1743285514Y.0000000062
- 16) T. Uda: Mater. Trans. 43 (2002) 55–62. 10.2320/matertrans.43.55