Abstract
The effect of coat permeability on mold filling for thin wall aluminum alloy castings in the expendable pattern casting (EPC) process was investigated experimentally. Thin wall aluminum alloy plates were cast by the EPC process, using eight kinds of coats with different permeabilities. The fluidity length and melt velocity were measured. The use of thin expendable polystyrene (EPS) pattern led to shorter fluidity length of melt. When the coat permeability was less than approximately 2, the fluidity length of the melt and melt velocity increased with increasing coat permeability. When the coat permeability was greater than approximately 2, even when the coat permeability increased, the fluidity length of the melt and melt velocity did not increase so much. The application of high expansion ratio of EPS pattern or high pouring temperature, led to long fluidity length of the melt. The distances of melt flow stop were predicted based on the heat transfer from the molten metal to the mold through the coat using measurement melt velocity values. The predicted values more or less agreed with experimental values for fluidity length.
This Paper was Originally Published in Japanese in J. JFS 88 (2016) 192–197.
1. Introduction
Aluminum alloys have been extensively used in automobile parts to achieve high fuel efficiency. The expendable pattern casting (EPC) process is very attractive, particularly for the casting of thin-wall components with complex shapes such as automobile parts1,2), because near net shape castings are obtained without having to divide and assemble the mold and core. Furthermore, because no molding binder is added to the mold in the EPC process, the environmental load can be reduced. Because of the extremely high recycling rate of sand, the cost of packing sand can be also reduced, under situations where silica sand is replaced with artificial sand.
However, in the EPC process, the mold filling takes place along with the thermal decomposition of the expendable polystyrene (EPS) pattern and discharge of the pyrolysate through the coat layer, which makes the mold filling mechanism more complicated and the melt velocity is much lower than when using a cavity mold3). Especially in the EPC process of aluminum alloys, the temperature of the molten metal is lower than that of cast iron, which results in a lower thermal decomposition rate of the EPS pattern and lower melt velocity. Therefore, because the time of heat release to the mold becomes long, a misrun due to the temperature drop at the melt surface4,5) can easily occur. Moreover, in thin wall castings, due to an increase in the specific surface area, the rate of heat loss of the melt due to radiation increases, which means that the temperature drop at the melt surface is more significant. To circumvent these problems, when the high permeability coat is used, the melt velocity increases4) and an increase in the melt fluidity can be expected. However, when the coat permeability changes, the thickness of the thermal decomposition gas layer between the melt surface and non-decomposition EPS pattern changes. Therefore, the coat permeability and melt velocity do not have a simple relationship6–8), and the effect of the high permeability coat on the increase in the melt velocity cannot be easily predicted.
Recently, a relatively large number of investigations have been conducted on the mold filling for the EPC process, such as the research on molten cast iron by Maruyama et al.9,10) However, few studies have been performed on the mold filling mechanism in the EPC process, such as on the quantitative effect of process parameters on the melt velocity6,11,12). In particular, almost no studies have been reported on the melt fluidity in thin wall castings. Moreover, there are few mold filling analysis systems that can exactly simulate the EPC process13–15). Therefore, there are examples of the direct observation of mold filling by using a heat-resistant glass9,16) or an X-ray image1,3).
In a previous study12), for eight coats having a wide range of the permeability, an aluminum alloy plate was cast, and the effect of the coat permeability on the melt velocity was examined. However, with respect to thin wall castings, although the experimental results on the melt velocity were shown under certain conditions, the effect on the melt fluidity was not examined.
In the present work, for a thin wall aluminum alloy casting, the effects of the coat permeability, pouring temperature, and expansion ratio of EPS pattern on the fluidity length of the melt were examined experimentally. The relationship between the fluidity length of the melt and melt velocity was discussed. Additionally, the solidification analyses4,5) were carried out by using the measured values of the melt velocity. The distance of melt flow stop was predicted by taking into account the critical solid fraction for the melt flow stop due to the temperature drop at the melt surface. The experimental values of the fluidity length were compared with the calculated values of the distance of melt flow stop. In the present study for the EPC process of plate-type aluminum alloys, the condition of the casting thickness of 5 mm in which a misrun had occurred under many conditions in this work, was defined as a condition of thin wall casting.
2. Experimental Procedure
Figure 1 shows a schematic of the casting apparatus used in the experiments, which was similar to that used in a previous study4,5,12). The steel molding flask was a cylindrical vessel with an inside diameter of 200 mm and depth of 300 mm. The EPS pattern shown in Fig. 1 has a plate shape with width, height and thickness of 70 mm, 200 mm, and 5 mm, respectively, which has a depth direction length of 70 mm to a figure. The cluster of the bottom pouring system was assembled with the EPS pattern. The EPS pattern with a size of 200 × 70 × 10 mm was used in some cases. A ceramic tube (25 mm inside diameter, 35 mm outside diameter, and 300 mm length) was used as a sprue from the pouring basin to the runner. The pouring basin was an insulating sand mold with an inner diameter of 80 mm, depth of 80 mm, and thickness of 15 mm. The runner was a plate EPS with a cross section of 35 × 10 mm and a length of 125 mm. The cross section of the ingate was 35 × 10 mm. A double sided adhesive tape (base: paper, adhesive: acrylic, thickness: 0.09 mm) was used to connect the runner and EPS pattern. They were attached only at the circumference in the cross section of the ingate.
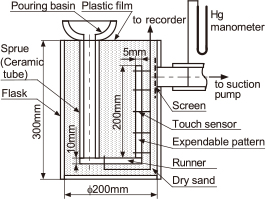
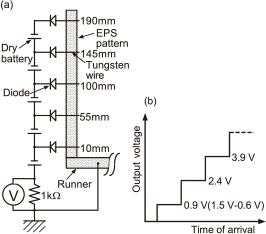
In the present study, the melt fluidity was evaluated by measuring the fluidity length of the melt. In order to measure the time of arrival of the molten metal in the flow direction distance y, touch sensors10) of the molten metal were inserted into the EPS pattern at 10, 55, 100, 145, and 190 mm from the ingate, as shown in Fig. 2(a). The touch sensors were tungsten wires with diameters of 0.5 mm. These wires passed through the center of the 70 mm wide EPS pattern. As shown in Fig. 2(b), the voltage across the resistance increased in a stepwise fashion, every time the molten metal contacted a touch sensor. The arrival time was defined from the increasing time in this voltage change chart. In order to determine the arrival time from the ingate, it was necessary to know the time when the molten metal reached the ingate. This time was determined by extrapolation from the times when the molten metal reached y = 10 mm and y = 55 mm. When the mold filling was incomplete, the average melt velocity was defined with respect to the time when the molten metal reached the touch sensor finally.
Eight kinds of coats shown in Table 1 were used in this study, consisting of one mica base coat (coat A) and seven kinds of silica base coats (coats B–H). The values of coat permeability, listed in Table 1, are in the range 0.13–45, and are in accordance with the JIS mold permeability (JIS Z2603)17), and also measured values by using the method reported in a previous study12). The coat layer of mica base coat (coat A) generally has a high heat insulation characteristics not only a low permeability. The coat permeability of seven kinds of silica based coats was varied by changing the aggregate diameter. The EPS pattern was coated using a dipping method. The coated pattern was then dried for over 24 h in a drying furnace at 323 K. Each coat was coated so that the thickness of coat after drying was approximately 1 mm.
Table 1
Test coat used in experiments.
Test
Coat |
Coat type |
Main
Component |
Coat
permeability |
| A |
Low permeability,
High insulating |
Mica, Silica,
Alumina |
0.13 |
| B |
Low permeability |
Silica |
0.41 |
| C |
Low permeability |
Silica |
0.81 |
| D |
Middle Permeability,
General use |
Silica |
1.7 |
| E |
Middle Permeability,
General use |
Silica |
2.6 |
| F |
High permeability |
Silica |
5.1 |
| G |
High permeability |
Silica |
10 |
| H |
High permeability |
Silica |
45 |
Silica sand with a mode diameter of approximately 0.15 mm (AFS grain fineness number 62) was poured into the flask. Two kinds of EPS patterns with expansion ratios of 60 times (density = 18 kg·m−3) and 100 times (density = 11 kg·m−3) were used. Only atmospheric pressure was applied as the pressure conditions in the flask during the pouring process and mold filling, and only the bottom pouring system was applied as a casting design. The aluminum alloy JIS AC2A (A319 equivalent) was used as a casting material. It was melted in a high frequency electric induction furnace and cast directly from the furnace. The pouring temperature was set at approximately 973 K or approximately 1073 K. During the pouring process, the distance from the bottom of the pouring basin to the melt surface was maintained at approximately 50 mm. The pouring operation was continued, until the height of the melt surface in the basin did not changed, either due to the complete mold filling or due to the melt flow stop. As a result, the melt head at the melt surface during mold filling had nearly the same value in the different experiments.
3. Analytical Procedure
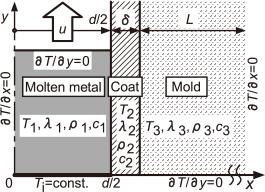
The case where the molten aluminum alloy replaces in the EPS pattern of a semi-infinite plate by the bottom pouring system as shown in Fig. 3, was considered. In this analysis, the melt velocity was assumed to be constant. Adiabatic condition was applied to the melt surface, assuming that there was no significant effect on the temperature drop at the melt surface due to the heat loss by the thermal decomposition of the EPS pattern. Based on this assumption, the area of the EPS model was considered as a cavity, as shown in Fig. 34,5). In this case, the heat release from molten metal becomes the only heat transfer to the dry sand mold through the coat layer. In Fig. 3, x is the distance from the center of the molten metal in the thickness direction, d/2 is the half thickness, and y is the distance from the inlet of the molten metal. In this case, the conductive heat transfer from the molten metal to the mold through the coat, can be formulated as:
| \[\text{Molten metal:}\quad \rho_1 c_1 \frac{\partial T_1}{\partial t} = \lambda_1 \left( \frac{\partial^2 T_1}{\partial x^2} + \frac{\partial^2 T_1}{\partial y^2} \right)\] | (1) |
| \[\text{Coat:}\quad\hskip3.5em \rho_2 c_2 \frac{\partial T_2}{\partial t} = \lambda_2 \left( \frac{\partial^2 T_2}{\partial x^2} + \frac{\partial^2 T_2}{\partial y^2} \right)\] | (2) |
| \[\text{Mold:}\quad\hskip3.25em \rho_3 c_3 \frac{\partial T_3}{\partial t} = \lambda_3 \left( \frac{\partial^2 T_3}{\partial x^2} + \frac{\partial^2 T_3}{\partial y^2} \right)\] | (3) |
where
t is the time,
T is the temperature,
λ,
c, and
ρ are the thermal conductivity, the specific heat, and the density respectively. Subscripts 1, 2, and 3 show the corresponding values in the molten metal, coat, and mold respectively. The heat transfer coefficient at the molten metal-coat interface was assumed to be
h = 350 W・m
−2・K
−1 4,5).
For numerical calculations, the finite differential method was used. In this analysis, the following simplification4,5) was applied for the molten metal flow. It was assumed that the melt surface moves step by step so that the melt surface may agree with the finite difference mesh. In the interval during which the melt surface moves to the next mesh, the calculation of heat conduction was carried out assuming a fixed melt surface. The temperature recovery method18) was used to deal with the latent heat of solidification. As a relationship between the solid fraction fS and temperature of melt T, the linear approximation18) was used as follows:
| \[T = T_L - (T_L - T_S)f_s\] | (4) |
where
TL and
TS are the solidus and liquidus temperatures. The melt flow stop was determined from the time when the solid fraction at the center of melt surface have reached 0.52
19).
Table 2 shows the main physical properties used in calculations. The values for JIS AC2A20) were used for physical properties of the molten aluminum alloy. The measured values by authors were used for the thermal conductivity and bulk density of the dry sand packed bed21). The literature data22) was used for the specific heat of the sand mold. The measured values by authors were used as thermal conductivities of the coat layer23). The thermal conductivity of the mica base coat (coat A) is approximately one-third that of the other silica base coats4). Even with different aggregate diameters of silica based coats (coat B–H), the thermal conductivity of the coat layer did not change significantly4). The correlation line of the measured melt velocity in this work was used for the melt velocity at the ingate.
Table 2
Physical properties used in calculations.
| |
Molten
metal |
Coat |
Sand
mold |
Thermal conductivity
λ/W・m−1・K−1 |
92 |
0.20 (Coat A)
0.54 (Coats B-H) |
0.44 |
Specific heat
c/kJ・kg−1・K−1 |
1.09 |
0.90 |
0.90 |
Density
ρ/kg・m−3 |
2350 |
1640 |
1640 |
Heat of fusion
Hf/kJ・kg−3 |
390 |
- |
- |
Liquidus temperature
TL/K |
883 |
- |
- |
Solidus temperature
TS/K |
793 |
- |
- |
4. Experimental Results and Discussion
Figure 4 shows the experimental values of the fluidity length of the melt Lf for EPS of the expansion ratio of 60 times, as a function of the coat permeability K, with the pouring temperature as a parameter. The range of the coat permeability K is 0.13–45, which is a difference of approximately 350 times. Therefore, the horizontal axis is shown on a logarithmic scale. The fluidity length of 200 mm shown as the dotted line in Fig. 4 expresses the completed mold filling. As can be seen in Fig. 4, with increasing pouring temperature, the fluidity length increases. When the pouring temperature is 1073 K, the mold filling has been completed in the high coat permeability region. When the coat permeability is less than approximately 2, for the pouring temperatures of 973 K and 1073 K, the fluidity length increases with increasing coat permeability. When the coat permeability is larger than approximately 2, for the pouring temperature of 1073 K, the effect of the coat permeability on the fluidity length cannot be examined, because the mold filling has been completed. However, for the pouring temperature of 973 K, the fluidity length of the melt does not increase significantly with increasing coat permeability. It is considered that the melt flow stop depends on the increase in the solid fraction due to the temperature drop at the melt surface. Furthermore, it is considered that the temperature drop at the melt surface is dependent on the melt velocity which is related to the heat radiation time during mold filling. The relationship between the fluidity length of the melt and melt velocity is examined in the following.
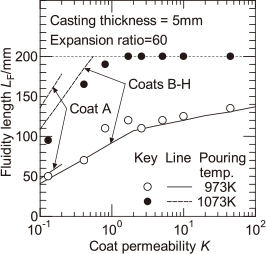
Figure 5 shows the experimental values of the melt velocity u obtained in the measurement of the fluidity length as shown in Fig. 3, as a function of the coat permeability K. When the coat permeability is less than approximately 2, the melt velocity increases with increasing coat permeability. However, when the coat permeability is larger than approximately 2, the rate of increase in the melt velocity is reduced. This result is similar to that observed for the casting thickness of 10 mm reported in a previous report12), and qualitatively agrees with the result of the fluidity length shown in Fig. 4. Even if the pouring temperature is increased, there is no significant increase in the melt velocity. As a result, it is thought that the increase in the fluidity length with pouring temperature is dependent on the increase in degree of the superheat from the solidus temperature.
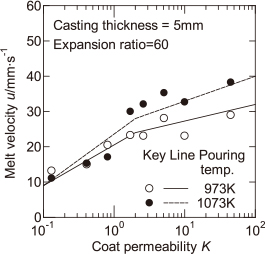
The solid and dashed lines in Fig. 4 represent the calculated values of the distance of melt flow stop. As shown in Table 2, because the thermal conductivity of coat A with a coat permeability K = 0.13 is different from those of coats B–H, the calculated values of the distance of melt flow stop are different. Therefore, the calculated value for coat A within the range K = 0.1 to 0.2 was shown in a different line from that for coats B–H. Because the thermal conductivity of coat A is smaller than those of coats B–H, the corresponding calculated values of the distance of melt flow stop are slightly higher. In this calculation, the value of the melt velocity u is required. However, a previous study12) has shown that, when the coat permeability is large and the casting thickness is 5 mm, it is difficult to predict the melt velocity based on the mold filling model6). Therefore, the experimental values of the melt velocity u shown in Fig. 5, are divided into two regions, namely, the region for which the coat permeability is less than 2 and that for which the coat permeability is more than 2. The correlation lines that are linearly approximated in each region were used for the melt velocity u. The solid and dashed lines in Fig. 5 represent the correlation lines of the melt velocity for the two pouring temperatures. As shown in Fig. 4, when the pouring temperature is 1073 K and the coat permeability is large, the fluidity length is 200 mm and the mold filling has been completed. In this case, it is not possible to compare the experimental values of the fluidity length of the melt with the calculated values of the distance of melt flow stop. In the region where the fluidity length is less than 200 mm, when the pouring temperature is 1073 K, the calculated values of the distance of melt flow stop are slightly larger than the experimental values of the fluidity length of the melt. However, it is considered that the calculated values at two pouring temperatures more or less agreed with the experimental values. As a result, when the melt velocity is known, the fluidity length of the melt can be estimated. This means the quantitative examination for the effects of the melt velocity and degree of the superheat from the solidus temperature on the fluidity length of the melt. The reason why that the calculated values of the distance of melt flow stop at the pouring temperature of 1073 K were slightly larger than the experimental values, may be as follows. In the measured and calculated values shown in Fig. 4, it is seen that the fluidity length of the melt is very sensitive to the pouring temperature. Therefore, it is possible that the experimental pouring temperature might be slightly lower than 1073 K.
Figure 6 shows the experimental values of the fluidity length of the melt Lf similar to that in Fig. 4, for the pouring temperature of 973 K, with the expansion ratio of EPS pattern as a parameter. The fluidity length of the melt for the EPS pattern with an expansion ratio of 100 times is larger than that with an expansion ratio of 60 times. In this case, the mold filling has been completed in the high coat permeability region. Similar to the case where the pattern expansion ratio is 60 times, when the coat permeability is less than approximately 2, the fluidity length increases with increasing coat permeability.
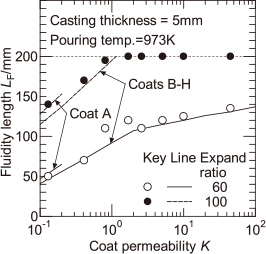
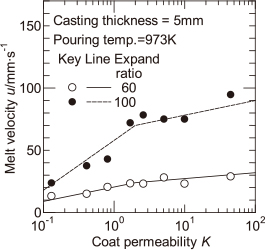
Figure 7 shows the experimental values of the melt velocity u with the expansion ratio of EPS pattern as a parameter similar to that in Fig. 5. When the EPS pattern with expansion ratio of 100 times is used, the melt velocity is increased. As a result, the differences in the fluidity length of the melt shown in Fig. 6 are dependent on the differences in the melt velocity. It is thought that when the melt velocity is higher, the heat radiation time becomes shorter, and the temperature drop at the melt surface is lowered. The solid and dashed lines in Fig. 7 represent the correlation lines of the melt velocity for two different expansion ratios of the EPS pattern. The correlation lines were used to calculate the distance of melt flow stop.
The calculated values of the distance of melt flow stop shown by solid and dashed lines in Fig. 6 are compared with the experimental values for the fluidity length of the melt. It seems that the experimental and calculated values more or less agreed. In this calculation, the difference in the expansion ratio of EPS pattern results in a difference in the melt velocity. As a result, if the relationship between these values is known, the effect of the expansion ratio of EPS pattern on the fluidity length of the melt can be quantitatively predicted.
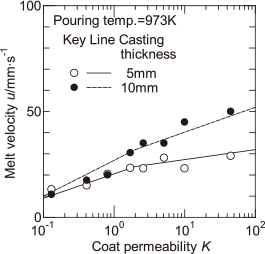
Figure 8 shows the effect of the casting thickness on the fluidity length, in the case where the expansion ratio of EPS pattern is 60 times and the pouring temperature is 973 K, and shows the comparison between casting thicknesses of 10 mm and 5 mm. When the casting thickness is 10 mm, the fluidity length of the melt is higher than when it is 5 mm, and the mold filling has been completed in the high coat permeability region. In this case, when the coat permeability is less than approximately 2, the fluidity length increases with increasing coat permeability.
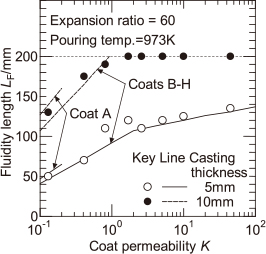
Figure 9 shows the effect of the casting thickness on the melt velocity. The melt velocity for the casting thickness of 10 mm is slightly higher than that for 5 mm. However, there is no significant effect of the casting thickness on the melt velocity. As a result, it is thought that the difference in the fluidity length of the melt shown in Fig. 8 is dependent on the specific surface area which is related to the radiation area per unit volume of the melt. Thus, it seems that the temperature drop at the melt surface for the casting thickness of 5 mm is larger than that for 10 mm. The solid and dashed lines in Fig. 9 represent the correlation lines of the melt velocity for each of the casting thicknesses used to calculate the distance of melt flow stop.
The calculated values of the distance of melt flow stop shown by solid and dashed lines in Fig. 8 are compared with the experimental values for the fluidity length of the melt. It seems that the experimental and calculated values more or less agreed. In this calculation, the difference in the casting thickness results in a difference in the radiation area per unit volume of the melt. As a result, if the effect of casting thickness on the melt velocity is known, the effect of the reduction in casting thickness on the fluidity length of the melt can be predicted.
5. Conclusion
In order to examine the effect of the coat permeability on the mold filling for a thin wall aluminum alloy casting in the EPC process, aluminum alloy plates were cast by the EPC process using eight coats with different permeabilities, and the fluidity lengths of the melt were measured. The following conclusions were obtained under the conditions of this work.
(1) When the thin EPS pattern was used, the fluidity length of the melt was lowered, because of the increase in the heat radiation area per unit volume of the melt.
(2) When the coat permeability was less than approximately 2, the fluidity length of the melt increased with increasing coat permeability. However, when the coat permeability was larger than approximately 2, because the melt velocity increased very little even if the coat permeability increased, the increase in fluidity length of the melt was small.
(3) A high pouring temperature led to a long fluidity length of the melt due to an increase in degree of the superheat with respect to the solidus temperature.
(4) When the EPS pattern with a high expansion ratio was used, the melt velocity became larger. As a result, the fluidity length of the melt increased due to the decrease in temperature drop at the melt surface.
(5) The calculated values of the distance of melt flow stop using the measurement values of the melt velocity more or less agreed with experimental values for the fluidity length of the melt.
REFERENCES
- 1) A.T. Speda: Mod. Cast. (2001) 29.
- 2) General Motors Asia Pacific Japan: SOKEIZAI (1994) 5.
- 3) F. Sonnenberg: LOST FOAM casting made simple (American Foundry Society, Schaumburg) (2008).
- 4) S. Koroyasu and A. Ikenaga: Mater. Trans. 53 (2012) 224–228. 10.2320/matertrans.M2011242
- 5) S. Koroyasu and M. Matsuda: J. JFS 76 (2004) 687–694.
- 6) S. Koroyasu: J. JFS 81 (2009) 377–383.
- 7) J. Zhu, I. Ohnaka, T. Ohmichi, K. Mineshita and Y. Yoshioka: J. JFS 72 (2000) 715–719.
- 8) I Ohnaka, T. Ohmichi, J. Zhu, Y. Hagino, B. Yamamoto and K. Shinano: Report of JFS Meeting 138 (2000) 101.
- 9) T. Nakamura, M. Tamaoki and T. Maruyama: Report of JFS Meeting 164 (2014) 92–92.
- 10) T. Maruyama, K. Katsuki and T. Kobayashi: J. JFS 78 (2006) 53–58.
- 11) M.R. Barone and D.A. Caulk: Int. J. Heat Mass Transfer (2005) 4132–4149. 10.1016/j.ijheatmasstransfer.2005.03.031
- 12) S. Koroyasu: J. JFS 88 (2016) 192–197.
- 13) K. Kubo and H. Asao: Report of JFS Meeting 146 (2005) 23.
- 14) Y. Hotta, H. Yamagata, M. Nikawa, I. Ohnaka, Y. Tate and Y. Mizutani: Report of JFS Meeting 162 (2013) 82.
- 15) F. Kinoshita: J. JFS 86 (2014) 927–930.
- 16) Y. Sakaguchi and T. Yamada: J. JFS 75 (2003) 355–361.
- 17) EPC Process Technical Meeting: Characteristic and Standardization of Coat for EPC Process (Kansai Branch of JFS) (1996) 18.
- 18) I. Ohnaka: Computer Den-netsu Gyoukokaiseki Nyumon, (Maruzen, Tokyo) (1990) p.202.
- 19) S. Kashiwai, J.D. Zhu and I. Ohnaka: J. JFS 73 (2001) 592–597.
- 20) Japan Foundry Engineering Society: Tyuzoukougaku Binran, (Maruzen, Tokyo) (2002) p. 450.
- 21) S. Koroyasu and M. Matsuda: J. JFS 68 (1996) 949–955.
- 22) I. Ohnaka: Computer Den-netsu Gyoukokaiseki Nyumon, (Maruzen, Tokyo) (1990) p.326.
- 23) W. Nakajima: Saishin Den-netu Keisoku Gizyutsu, (1992) pp.259–262.