Proton Conduction and Incorporation into La1−xBaxYb0.5In0.5O3−δ
2018 Volume 59 Issue 1 Pages 14-18

Details
2018 Volume 59 Issue 1 Pages 14-18
In order to clarify the effect of the dopant concentration and phase transition on the proton conduction and proton concentration, the electrical conductivity and proton concentration were determined for La1−xBaxYb0.5In0.5O3−δ (x = 0.1. 0.3. 0.5, 0.7). The phase transition from the orthorhombic system to the cubic system was over x = 0.3. The proton/deuteron isotope effect on the conductivity was observed for all samples at 673 K. The proton concentration was independent of the barium content above 673 K. The proton concentration increased with the barium content below 673 K, but the concentration ratio of the proton to dopant decreased following an increase in the barium concentration. It was determined that the dopant concentration and phase transition do not have an influence on the conduction and incorporation of protons into the La1−xBaxYb0.5In0.5O3−δ.
Some perovskite-type oxides undergo the proton conduction at the intermediate temperature. The oxide ion vacancies were formed in the crystal when a cation of the perovskite-type oxide was replaced by a cation having a low valence. Protons are incorporated into crystal by the flowing reaction1):
| \[ {\rm H}_{2} {\rm O} + V_{\rm O}^{\bullet\bullet} = 2{\rm H}_{\rm i}^{\bullet} + {\rm O}_{\rm O}^{\times} \] | (1) |
The ratio of the proton concentration to dopant concentration for the La-based perovskite oxide was in the order La0.9Sr0.1InO3−δ > La0.9Sr0.1ScO3−δ > La0.9Sr0.1YbO3−δ > La0.9Sr0.1AlO3−δ2). It was found that the proton concentration depends on the B-site of the ABO3 perovskite.
In a previous study3–6), we suggested that the limitation on the degree of hydration in the oxide is attributed to the existence of the immobile oxide ion vacancy. Oikawa et al. reported that some oxygen vacancies in the MO5 polyhedra are structurally stable; they do not affect the hydration7). It is expected that the dissolution limit of the protons is related to the local structure of the oxygen octahedral.
Ba-doped LaInO3 was reported to be the mixed conductor of the oxide ion and hole8–10). Moreover, the phase transition occurred by increasing the Ba content. In a part of report11), proton conduction was observed for this system in a wet atmosphere. However, the evidence of proton conduction has not been thoroughly obtained and the effect on phase transition is not known.
In order to clarify the effect of the dopant concentration and phase transition on the proton conduction and proton concentration, the proton conductivity and proton concentration were determined for La1−xBaxYb0.5In0.5O3−δ. In this study, the isotope effect on the conductivity was observed for La1−xBaxYb0.5In0.5O3−δ and the proton concertation was measured by a thermogravimetric analysis.
La1−xBaxYb0.5In0.5O3−δ (x = 0.1. 0.3. 0.5, 0.7) were prepared by a solid state reaction method. The reagent-grade La2O3 (99.9%), Yb2O3 (99.9%), BaCO3 (99.9%), and In2O3 (99.9%) powders were weighted to form the composition La1−xBaxYb0.5In0.5O3−δ, then mixed in ethanol using a mortar. The powder mixtures were calcined in air for 10 h at 1573 K. The calcined powder was pressed into a pellet at 200 MPa by CIP. The pellets were next sintered at 1873 K for 10 h in air. The compact density was over 98%. The crystal structures were identified by an X-ray diffraction analysis using a MinFlex (Rigaku) with CuKα-radiation.
2.2 Thermogravimetric analysisThe proton concentrations were determined from the weight change of the sample due to water absorption based on a thermogravimetric analysis (TGA). The samples were first treated at 1473 K for 1 h in dry-N2-Ar to remove any existing hydrogen. The weight changes of the samples were then measured in 1.9%H2O-N2 in the temperature range of 473–1473 K using a STA449F3 Jupiter (NETZSCH). The effect of buoyancy was corrected using the data from a blank test without any sample.
2.3 AC impedance measurementThe electrical conductivity was measured by a four-terminal AC technique. Porous platinum electrodes were attached to each end of the bar sample (10.0 mm × 3.0 mm × 2.0 mm) by a painting paste, then sintering at 1273 K in air. In order to verify the protonic conductivity, the electrical conductivity was measured under 1.9%H2O–1%O2 and 1.9%D2O–1%O2 in the temperature range of 673–1173 K. The samples were equilibrated with 1.9% H2O–1%H2 (or O2)-Ar in the temperature range of 573 K–1173 K. The complex impedance was measured in the frequency range of 0.02 Hz–1 MHz using an LCR meter (NF corporation: ZM2375 or HIOKI corporation: IM3536).
2.4 Electromotive force measurementThe EMF of the gas concentration cells was measured for La0.5Ba0.5Yb0.5In0.5O3−δ at 1073 K. The samples were formed into pellets (φ13.5 mm diameter and 0.5 mm thickness). Porous platinum electrodes were prepared on both surfaces of the pellet samples. The samples were held between the alumina tubes by pyrex glass gaskets, thus separating the two electrode compartments. The gas concentration cell is represented by the following cell formula:
| \[ \begin{split} & (-), {\rm Pt} (p_{{\rm H}_{2}} ({\rm I})\ {\rm or}\ p_{{\rm O}_{2}} ({\rm I}),\ p_{\rm H_{2}O} ({\rm I}))\\ &\quad \left| {\rm La}_{0.5} {\rm Ba}_{0.5} {\rm Yb}_{0.5} {\rm In}_{0.5} {\rm O}_{3 - \delta} \right|\\ &\quad {\rm Pt}(p_{{\rm H}_{2}} ({\rm II})\ {\rm or}\ p_{{\rm O}_{2}} ({\rm II}),\ p_{{\rm H_{2}O}} ({\rm II})),\ (+) \end{split} \] | (2) |
Figure 1 shows the X-ray diffraction pattern of La1−xBaxYb0.5In0.5O3−δ (x = 0.1. 0.3. 0.5, 0.7). As shown in Fig. 1, the phases of x = 0.1 and x = 0.3 were determined to be the orthorhombic perovskite structure. The phase of x = 0.5 was confirmed to be the cubic system and single phase. The diffraction pattern of x = 0.7 showed an unknown peak of the second phase.
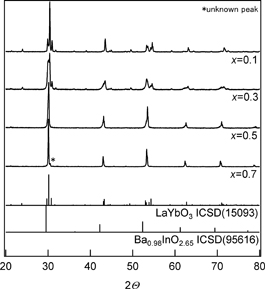
X-ray diffraction pattern of La1−xBaxYb0.5In0.5O3−δ (x = 0.1. 0.3. 0.5, 0.7).
Figure 2 shows the proton concentration of La1−xBaxYb0.5In0.5O3−δ (x = 0.1. 0.3. 0.5, 0.7). As shown in Fig. 2(a), the proton concentration decreased with an increase in the temperature. The substitution of barium ions on the lanthanum ion-site then lead to an enhancement of the proton concentration at a low temperature. Figure 2(b) shows the proton concentration normalized by the barium ion concentration. The normalized proton concentration decreased with an increase in the barium content. This suggested that the proton concentration is not proportional to that of the formed oxygen vacancy.
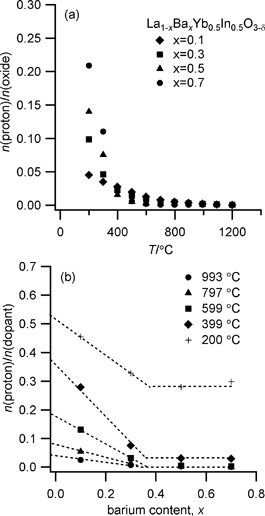
Proton concentration of La1−xBaxYb0.5In0.5O3−δ (x = 0.1. 0.3. 0.5, 0.7). (a) Temperature dependence of the proton concertation. (b) Concentration ratio of proton to dopant as a function of the barium content.
Figure 3(a) shows the decay curve of the conductivity for evaluateing the proton/deuteron isotope effect at 400℃. As shown in the figure, the isotope effect on the conductivity was observed. the proton was found to be the predominant charge carrier. Figure 3(b) shows the ratio of the conductivity in 1.9%H2O–1%O2 to that in 1.9%D2O–1%O2. The conductivity ratio decreased with an increase in the temperature or Ba content. This suggested that the proton transport number decreased with an increase in the temperature or Ba content. At a low temperature, the conductivity ratio was over 1.34 which is the value expected for a local mode with a reduced mass approximation. This might be attributed to the difference in the zero-point motion between the proton and deuteron12).
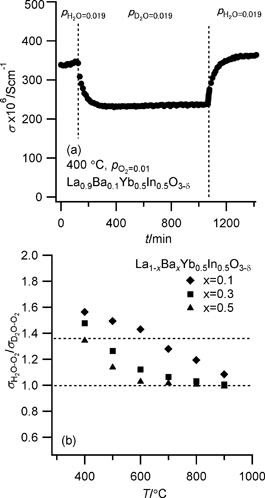
Proton/deuteron isotope effect on conductivity. (a) Conductivity change with exchange of the proton for the deuteron. (b) Ratio of the conductivity under H2O–O2 and the conductivity under D2O–O2.
Figures 4(a) and (b) show the temperature dependence of the electrical conductivity. As shown in Fig. 4(a), the conductivity was independent of the Ba content at a low temperature. According to the isotope effect on the conductivity, the proton conduction is dominant at a low temperature. Therefore, the proton conduction is independent of the Ba content. On the other hand, the conductivity increases with the increasing in Ba content at a high temperature. In order to clarify the dominant charge carrier, the EMF of the gas concentration cells was measured for La0.5Ba0.5Yb0.5In0.5O3−δ at 1073 K. Figures 5(a) and (b) show the EMF of the hydrogen concentration and the water vapor concentration under a reducing atmosphere, respectively. The EMF of the hydrogen concentration was in agreement with the theoretical value according to the Nernst equation. This indicated that the ionic transport number is unity. The EMF of the water vapor concentration was observed, but was lower than the calculated theoretical value based on the Nernst equation when the transport number of the oxide ion is unity. Therefore, La0.5Ba0.5Yb0.5In0.5O3−δ was found to be a mixed ion conductor of the proton and oxide ion under the reducing atmosphere. The EMF of the mixed ion conductor can be represented as follows:2)
| \[ E = - \frac{RT}{F} \ln \frac{p_{\rm H_{2}O(II)}^{-1/2} + \sigma_{{\rm H}_{\rm i}^{\bullet}}^{\circ}/\sigma_{V_{\rm O}^{\bullet\bullet}}^{\circ}} {p_{\rm H_{2}O(I)}^{-1/2} + \sigma_{{\rm H}_{\rm i}^{\bullet}}^{\circ}/\sigma_{V_{\rm O}^{\bullet\bullet}}^{\circ}} \] | (3) |
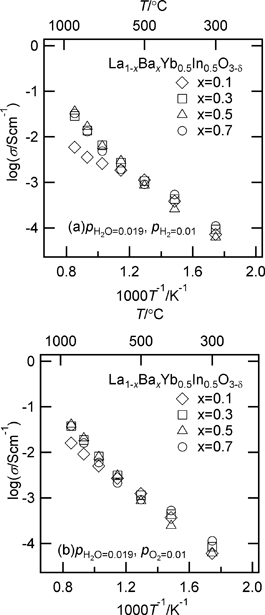
Temperature dependence of conductivity. (a) Conductivity under a reducing atmosphere containing hydrogen. (b) Conductivity under an oxidizing atmosphere containing oxygen.

EMF of gas concentration cell using La0.5Ba0.5Yb0.5In0.5O3−δ as the electrolyte. (a) Hydrogen concentration cell under H2O–H2. (b) Stem concentration cell under H2O–H2. (c) Oxygen concentration cell under H2O–O2.
| \[ \sigma_{{\rm H}_{\rm i}^{\bullet}} = \sigma_{{\rm H}_{\rm i}^{\bullet}}^{\circ} p_{\rm H_{2}O}^{1/2} \] | (4) |
| \[ \sigma_{{\rm V}_{\rm O}^{\bullet\bullet}} = \sigma_{{\rm V}_{\rm O}^{\bullet\bullet}}^{\circ} \] | (5) |
| \[ t_{{\rm H}_{\rm i}}^{\bullet} = \frac{ \sigma_{{\rm H}_{\rm i}^{\bullet}} } { \sigma_{{\rm H}_{\rm i}^{\bullet}} + \sigma_{{\rm V}_{\rm O}^{\bullet\bullet}}} = \frac{\sigma_{{\rm H}_{\rm i}^{\bullet}}^{\circ} p_{\rm H_{2}O}^{1/2}/ \sigma_{{\rm V}_{\rm O}^{\bullet\bullet}}^{\circ}} {\sigma_{{\rm H}_{\rm i}^{\bullet}}^{\circ} p_{\rm H_{2}O}^{1/2}/ \sigma_{{\rm V}_{\rm O}^{\bullet\bullet}}^{\circ} + 1} \] | (6) |
Figure 4(c) shows the EMF of the oxygen concentration cell under an oxidizing atmosphere. The observed EMF was lower than the theoretical value according to the Nernst equation. Therefore, La0.5Ba0.5Yb0.5In0.5O3−δ was found to be a mixed conductor of the hole and ions.
The phase of La1−xBaxYb0.5In0.5O3−δ transforms from orthorhombic to cubic following an increase in the barium content. The proton conductivity did not change with the phase transition. The transform to cubic does not improve the proton conductivity and concentration. The crystal system does not affect on the proton conductivity and concentration for La1−xBaxYb0.5In0.5O3−δ. Moreover, the proton concentration was independent of the barium content above 673 K. The concentration ratio of the proton to dopant decrease with an increase in the barium content as shown in Fig. 2(b). The proton concentration is not proportional to the number of oxide ion vacancy. This indicated that the proton concentration does not simply increase with an increase in the number of the oxide ion vacancies. The proton concentration might depend on the local structure around the oxide ion vacancy and the acceptor dopant.
The conduction and incorporation of a proton into La1−xBaxYb0.5In0.5O3−δ (x = 0.1. 0.3. 0.5, 0.7) were examined in the temperature range of 573–1073 K. The effects of the phase transition and the dopant concentration on the proton conductivity were not observed. The proton concentration was independent of the barium content above 673 K. The concentration ratio of the proton to dopant decreases with an increase in the dopant content. This indicated that all the oxygen vacancies do not act during the hydration reaction. The change in the mean structure and the number of the oxygen vacancies might not be important regarding incorporation of a proton into La1−xBaxYb0.5In0.5O3−δ.
This study was partially supported by JSPS KAKEN Grant number 16H06124 (Grant-in-Aid for Young Scientist(A)).