Abstract
In this study, the effects of impurities and processing conditions on the thermal stability of substructures formed via hot deformation were investigated using a plane strain compression (PSC) test. Two types of Al–1%Mn alloys were prepared. One of the alloys had a low content of silicon and iron owing to the use of pure aluminum bare metal (4N–1Mn alloy). The other was cast by using A1050 alloy (1050–1Mn alloy). The PSC tests were performed between 300 and 500°C and were followed by annealing at 500°C for 120 s in a salt bath. After the salt bath treatment, the 4N–1Mn alloys exhibited a recrystallized structure, whereas the 1050–1Mn alloys retained their fiber structure. Although the 4N–1Mn alloys exhibited a small increase in conductivity after the PSC test, the conductivity of the 1050–1Mn alloys showed an apparent increase. The synchrotron radiation analysis confirmed Al–Mn–Si precipitations in the compressed 1050–1Mn alloys. These precipitations could be the reason for the change in conductivity in the compressed 1050–1Mn alloys. Precipitations were barely observed for the compressed 4N–1Mn alloys, and small precipitations formed during hot deformation seemed to affect the formation of the thermal stabilized substructures. In addition, the study results showed that impurities, such as silicon, contribute to precipitation during hot deformation.
1. Introduction
Microstructures that form through hot deformation significantly affect the properties of a material. Although hot rolling is often performed at recrystallization temperatures or higher, fibrous microstructures consisting of grains in a pancake shape can be produced in the rolling direction depending on the conditions.1) In this case, subgrain structures often exist in the fibrous microstructures. This indicates that the subgrain structures are maintained without forming recrystallized grain structures owing to the formation of thermally stabilized substructures. Horita et al.2) investigated the thermal stability of various practical aluminum alloys by using the equal-channel angular pressing method. They reported that fine grain structures of AA5083 and AA3004 alloys are maintained up to 200°C, whereas those of AA2024 and AA7075 alloys are maintained up to 300°C.
We have investigated the formation of thermally stabilized substructures of the 5000 series,3) 6000 series,4) and 7000 series aluminum alloys.5) We found that thermally stabilized substructures are formed under rolling conditions by controlling the processing temperature and strain rate with the addition of transition elements such as manganese and zirconium. We also identified that the fibrous structures consisting of subgrain structures have anisotropic properties with high strength and good corrosion resistance.3–5) 3000 series aluminum alloys are widely used in food and beverage cans. To improve the strength and corrosion resistance of 3000 series aluminum alloys, it is important to optimize the process conditions for obtaining thermally stabilized substructures.
In the current study, the conditions of substructure formation in Al–1%Mn alloys were investigated using the plane strain compression (PSC) test method4) to determine the strain distribution in a test sample. This study aims to clarify the effects of impurities and hot processing conditions on the formation of thermal stabilized substructures. To determine the effect of impurities, two types of Al–1%Mn alloys were prepared: one with a low content of silicon and iron owing to the use of high-purity aluminum bare metal (4N–1Mn alloy), while the other was cast by using A1050 aluminum alloy (1050–1Mn alloy). The recrystallization behavior was studied after heat treatment of the PSC test pieces.
2. Experimental Procedures
The compositions of the materials tested during this study are listed in Table 1. The two types of Al–1%Mn alloys, 4N–1Mn and 1050–1Mn alloys, were cast into 175 mm long slabs by using a standard semi-continuous direct chill technique.

Table 1 Chemical composition of the samples.
The average grain sizes of the 4N–1Mn and 1050–1Mn alloys were respectively 250 µm and 94 µm, by using the cutting method.6) To clarify the effect of solute atoms, the slabs were not homogenized; they were machined to a height (ST direction), width (LT direction), and length (L direction) of 10, 20, and 50 mm, respectively. The PSC test temperature was set to a range between 300 and 500°C. In all the experiments, the warm-up time was 1 min. The specimens were compressed after being maintained at a set temperature for 1 min, resulting in a change in thickness from 10 to 5 mm, while the strain rate of the anvils was varied between 0.1, 1, and 10 s−1. The compressed specimens were then quenched immediately using water. Next, the specimens were heat treated at 500 or 530°C for 120 s in a salt bath, followed by water quenching. The cross sections of the obtained compressed specimens were investigated using a polarizing microscope. Further, after the PSC test, the electric conductivity was measured at the center layer in a part compressed by anvils (constriction part) and at the surface layer in the noncompressed part (invariant part).
3. Results
3.1 Changes in microstructure
The microstructures of the specimens compressed at a strain rate of 1 s−1 are shown in Fig. 1. For the 4N–1Mn alloy, a fibrous structure is shown at 300°C and recrystallized grains were partially formed over 400°C. Furthermore, the constriction parts were characterized by recrystallized grain structures after heat treatment at 500°C. For the 1050–1Mn alloy, the fibrous structure was maintained even after heat treatment at 500°C. Tables 2 and 3 show the microstructural changes of the 4N–1Mn and 1050–1Mn alloys, respectively. The 4N–1Mn alloys exhibit recrystallized grain structures (marked R in the table) after heat treatment at 500°C in all the compression conditions. However, the 1050–1Mn alloys maintain fibrous microstructures (marked F in the table) after heat treatment at 530°C in the case of compression at a temperature higher than 400°C. The 1050–1Mn alloys tended to exhibit recrystallized grain structures in the case of compression under 350°C. Based on these results, we conclude that 1050–1Mn alloys are hardly recrystallized compared to 4N–1Mn alloys, implying that thermally stabilized substructures were formed during hot compression processes in the 1050–1Mn alloys.


Table 2 Microstructure change of 4N–1Mn alloy.

Table 3 Microstructure change of 1050–1Mn alloy.
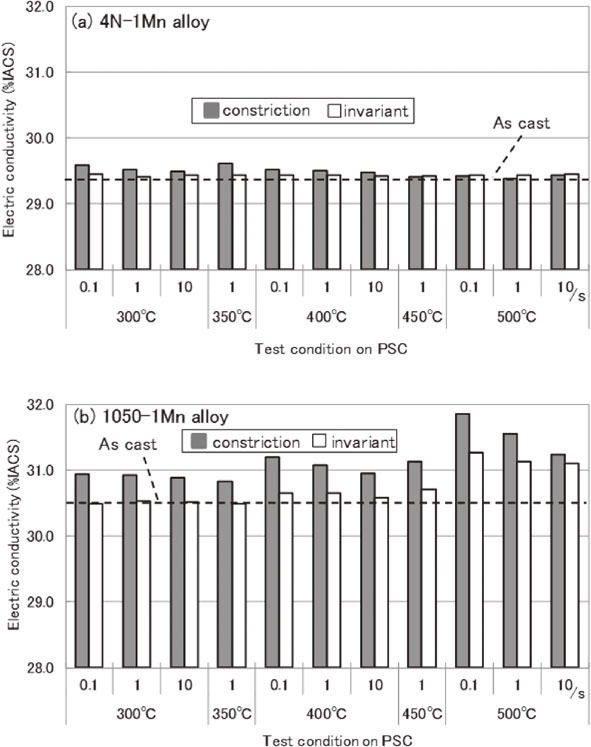
The electric conductivities cast were 29.4% and 30.5%IACS for the 4N–1Mn and 1050–1Mn alloys, respectively. Figure 2 shows the changes in the electric conductivity of the alloys after the PSC tests. A small change is observed in the electric conductivities of the 4N–1Mn alloys in the constriction and invariant parts. For the 1050–1Mn alloys, the electric conductivities in the constriction part increased relative to those in the invariant part. In addition, the electric conductivities in the invariant part increased when the PSC tests were performed at temperatures of over 400°C.
4. Discussion
Electric conductivity is fluctuated by solution atoms, precipitates, and lattice defects such as dislocations. In addition, electric conductivity is known to be decreased by 0.2%IACS when the dislocation density reaches 1011 cm−2.7,8)
It is known that the dislocation density of cold-worked aluminum alloys gets at 1010 cm−2.9) In the current study, the dislocation density of the constriction part is estimated to be under 1010 cm−2 due to hot deformation. Hence, the effect of dislocations on the electric conductivity should be small in the constriction parts. Electric conductivity is also known to be decreased by 6.5%IACS when the content of the solid solution on manganese increases 0.1 mass%.10) Thus, it should be considered reasonable that Fig. 2 shows the change of the content of the solid solution on manganese.
Figure 3 illustrates the relation between the forming time and electric conductivity for 1050–1Mn alloys shown in Fig. 2. We determined that the electric conductivity changes according to the natural logarithm of the forming time, as expressed in eq. (1). Consequently, the change in the electric conductivity of the 1050–1Mn alloys is correlated with the precipitation number of compounds containing manganese. Hence, the precipitation amount is roughly proportional to the natural logarithm of the forming time.
| \begin{equation}
\text{EC} = K\times\text{Log}(t) + \text{EC$_{0}$}
\end{equation}
| (1) |
where EC is the electric conductivity [%IACS],
K is a constant, and
t is the forming time [s].

X-ray diffraction (XRD) measurements were conducted using Aichi synchrotron radiation to observe the precipitations. Table 4 shows the analysis method of the synchrotron radiation, in which PSC samples compressed at 400°C at a rate of 1 s−1 were used. The measuring plane used in XRD is the same plane used for electric conductivity measurements. Figure 4 shows the X-ray diffractograms. In the case of the 4N–1Mn alloys, a very small peak is observed in the constriction part. This small peak can be attributed to the Al0.5Fe0.9Mn0.6 phase. For the invariant part of the 4N–1Mn alloy, X-ray diffraction peaks are identified owing to the Al6Mn phase, which should be formed in the casting process. It was hard to identify the Al6Mn compounds with an optical microscope owing to the scattered distribution. In the constriction part, the distribution of the Al6Mn compounds might be wide due to metal flow to the longitudinal direction. An X-ray diffraction peak attributed to the Al6Mn phase could not be identified in the constriction part.
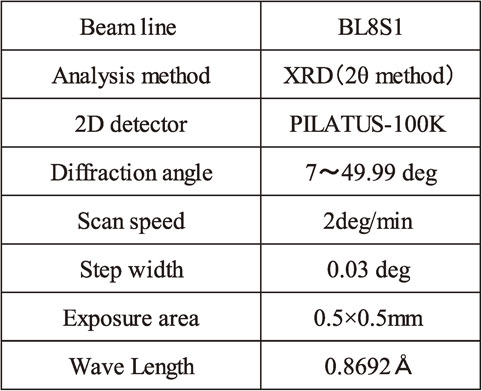
Table 4 Analysis method of Aichi synchrotron.
For the 1050–1Mn alloys, some peaks were identified at the same diffraction angle in both the invariant and constriction parts. These phases are probably formed in the casting process except Al5Mn2Si5 and Al0.5Fe0.9Mn0.6 phases. The peak related to the Al5Mn2Si5 phase is clearly observed in the constriction part. The increase in electric conductivity at the constriction parts of the 1050–1Mn and 4N–1Mn alloys is due to precipitations of the Al5Mn2Si5 and Al0.5Fe0.9Mn0.6 phases, respectively. This study showed that during hot deformation, impurities of silicon and iron derive precipitations including manganese such as Al5Mn2Si5 and Al0.5Fe0.9Mn0.6 phases.
A proposed mechanism for the formation of stabilized substructures is illustrated in Fig. 5. Dynamic precipitations during hot deformation inhibit dislocation movement, whereas a dislocation moving on a different slip plane results in an immotile dislocation.11) Because the slip plane of this integrated dislocation should be the (001) plane, the integrated dislocation would not be able to move on the (001) plane.
If hot deformation was performed in a C-curve nose to enable decomposition of the solid solution, many immotile dislocations would be produced. These immotile dislocations result in thermally stabilized substructures and subgrain boundaries. This hypothesis should be supported by future theoretical and empirical examinations. We plan to conduct small-angle X-ray scattering (SAXS) measurements to clarify the compound size and distribution in the Al5Mn2Si5 phase. By using SAXS data, we can clearly determine a mechanism for the formation of stabilized substructures.
5. Conclusions
The effects of impurities and processing conditions on the thermal stability of substructures formed during hot deformation were investigated using the PSC test. The principal findings are as follows:
-
(1)
4N–1Mn alloys exhibit recrystallized grain structures after heat treatment at 500°C under all compression conditions. The 1050–1Mn alloys maintain fibrous microstructures after heat treatment at 530°C in the case of compression over 400°C; however, they tend to exhibit recrystallized grain structures in the case of compression under 350°C.
-
(2)
There is a small change in the electric conductivity of 4N–1Mn alloys in the constriction and invariant parts after the PSC tests. However, for the 1050–1Mn alloys, the electric conductivity in the constriction part increases compared with that in the invariant part.
-
(3)
The precipitation of the Al5Mn2Si5 phase in the constriction part of 1050–1Mn alloys occurs, as shown through XRD measurements using synchrotron radiation. The impurities of silicon and iron were observed to derive precipitations including manganese, such as Al5Mn2Si5 and Al0.5Fe0.9Mn0.6 phases, during hot deformation.
Acknowledgements
The authors acknowledge Assistant Professor D. Egusa, The University of Tokyo in Japan, for the analysis of the electric conductivities.
REFERENCES
- 1) T.H. Courtney: Mechanical Behavior of Materials, (McGraw-Hill, 1990) p. 309.
- 2) Z. Horita, T. Fujinami, M. Nemoto and T.G. Langdon: Metall. Mater. Trans. A 31 (2000) 691–701.
- 3) H. Tanaka, Y. Nagai, Y. Oguri and H. Yoshida: Mater. Trans. 48 (2007) 2008–2013.
- 4) H. Tanaka and Y. Nagai: Proc. 15th Int. Conf. on Aluminum Alloys, (Trans. Tech. Publications, 2017) pp. 281–289.
- 5) H. Tanaka, H. Esaki, K. Yamada, K. Shibue and H. Yoshida: Mater. Trans. 45 (2004) 69–74.
- 6) Technical Committee of Light Metal Rolling Industry Association: J. JILM 15 (1965) 377–389.
- 7) S. Komatsu and S. Fujikawa: J. JILM 47 (1997) 170–181.
- 8) T. Kino: Bulletin of the Japan Institute of Metals 12 (1973) 631–638.
- 9) Y. Murakami: Foundations and industrial technology on aluminum alloys, (Japan Aluminium Association, Tokyo, 1985) pp. 79–110.
- 10) J.E. Hatch: Aluminum, (American Society for Metals, Ohio, 1984) pp. 200–241.
- 11) T. Nakamura: Elementary dislocation theory, (Maruzen, Tokyo, 1968) pp. 82–105.