Abstract
The effects of tungsten (W) addition and isothermal annealing on the microstructure and related hardening behavior were investigated for the dual two-phase Ni3Al-Ni3V intermetallic alloys. The microstructures in the homogenized alloys depended on the W substitution manner for Ni, Al or V. Distinctively fine and coherent dual two-phase microstructures were developed for the homogenized alloy in which W was substituted for Al and resulted in the largest hardness in the investigated alloys. Disk-shaped and fine Ni4W particles were precipitated in the channel region of the isothermally annealed alloy in which W was substituted for Ni. Hardness of the alloys increased with increasing annealing time and made a peak, followed by decrease, irrespective of the W substitution manner. The initial increase of hardness at early annealing time was attributed to the maturity of the eutectoid microstructure prematurely developed in the channel region before annealing. The simultaneous addition with W and Nb stabilized the eutectoid microstructure in the channel region and suppressed softening at a prolonged annealing time. Hardening mechanisms for the homogenized and annealed alloys were discussed in terms of the microstructural and phase stability and compared with the alloys with the simultaneous addition with W and Nb.
1. Introduction
Multi-phase intermetallic alloys are receiving increased attention because drawbacks such as low tensile ductility at ambient temperature and insufficient strength at elevated temperature have been overcome by refining microstructure or reserving coherent interface and rigid orientation relationship between constituent phases.1,2) For examples, TiAl-based intermetallic alloys have been developed, based on microstructures with a combination of γ (TiAl) and lamellar morphology consisting of α' (Ti3Al) and γ or fully lamellar-like microstructure consisting of α' and γ.3) Also, Mo-Si intermetallic alloys comprised of Mo, Mo3Si and Mo5SiB2 have been interested in development of an ultra high-temperature structural material.4) So-called Ni base dual two-phase intermetallic alloys have been developed by the present authors' group, based on Ni3Al (L12: lattice parameter; a = 3.572 nm) and Ni3V (D022: lattice parameters; a = 0.354 nm, c = 0.722 nm) pseudo-binary alloy system shown in Fig. 1.5) The D022 structure (space group; P4/mmm (123)) is crystallographically derived from the L12 structure (space group; $P{\rm m} \bar 3 {\rm m}$ (221)): the a parameter of the D022 structure is close to that of the L12 structure but the c parameter of the D022 structure is roughly doubled. A1 phase (Ni solid solution (γ: fcc structure) region, and related liquidus and solidus lines in high temperature portion of the present diagram have not been determined yet. At high temperatures above 1273 K, alloys with a hypereutectoid composition exhibit microstructures comprised of primary Ni3Al phase (γ') precipitated from A1 phase matrix: in most cases, orthogonally aligned cuboidal Ni3Al precipitates are surrounded by channel region comprised of the A1 phase, similar to conventional Ni base γ/γ'-type superalloys. At low temperatures, the A1 phase in the channel region is transformed into a lamellar-like eutectoid microstructure consisting of the Ni3Al and Ni3V phases with a submicron size by the eutectoid reaction.6–19) The microstructural stability is believed to be high at elevated temperatures because the constituent crystal structures are coherent each other. Such a microstructural feature reveals that the dual two-phase intermetallic alloys have to be attractive as high-temperature structural materials. Indeed, it has been observed that the dual two-phase intermetallic alloys display unique materials properties for hardness, tensile strength, tensile ductility and wear resistance at high temperatures.20)

Alloying elements are generally used to further improve mechanical properties as have been actually conducted on conventional superalloys. In the present alloy system, alloying elements can be divided into two groups in terms of relative phase stability among the three constituent phases relevant to the formation of the dual two-phase microstructure, as shown in Table 1.5,21) Ti, Nb and Ta stabilize the two constituent intermetallic phases and are expected as potential solid solution strengthener because they are quite soluble in the both phases. Actually, it has been observed that Ti,6–10,14) Nb11–14) and Ta15,16) behaved as effective solid solution strengtheners. On the other hand, Mo, W, Re and Si destabilize the two intermetallic phases and therefore are less soluble in the both phases decomposed from the prior A1 phase at low temperatures. The elements in this group may bring about two effects. One is that the eutectoid microstructure in the channel region is destabilized or inhibited. Other is that precipitation occurs in the channel region owing to over-saturated solutes in the two intermetallic phases. In the alloy to which Mo, W or Re was added, it has been actually observed that the precipitation occurred in the channel region and resulted in precipitation hardening.16–18) However, the microstructural evolution including the precipitation in the channel region has not been clarified in detail. Besides, it is interesting to investigate the effect of simultaneous addition of the both types of elements on the microstructure and mechanical properties of the dual two-phase intermetallic alloy. For example, both solid solution strengthening and precipitation strengthening may be expected to simultaneously arise.
Table 1
Partition coefficients and solid solubility of the alloying elements in the Ni base dual two-phase intermetallic alloy.
5)
| Alloying element |
Group number in periodic table |
Type of alloying element |
Partition coefficient |
Solid solubility |
| k (L12/A1) |
k (D022/A1) |
| Ti |
4 |
Stabilizing intermetallc phases |
3.0 |
1.8 |
L12 > D022 > A1 |
| Nb |
5 |
1.1 |
1.9 |
D022 > L12 > A1 |
| Ta |
2.1 |
2.4 |
D022 > L12 > A1 |
| Cr |
6 |
Stabilizing A1 (fcc) phase |
0.3 |
0.6 |
A1 > D022 > L12 |
| Mo |
< 1* |
- |
A1 > D022 > L12 |
| W |
0.2 |
0.9 |
A1 > D022 > L12 |
| Re |
7 |
0.3 |
0.3 |
A1 > D022 > L12 |
| Co |
9 |
0.9 |
0.9 |
A1 > D022 > L12 |
| Si |
14 |
0.9 |
0.5 |
A1 > L12 > D022 |
* Ref. 21)
In this study, the effects of the simultaneous addition of W and Nb as well as the single addition of W on the microstructural evolution and hardening behavior are in detail investigated in terms of the W substitution manner and isothermal annealing at temperatures below the eutectoid temperature.
2. Experimental Procedure
The alloy compositions used in this work are shown in Table 2. The nominal composition expressed by 75Ni10Al15V (in at%) was chosen as a base alloy. 1.5 at% W was added to the base alloy, substituting each for Ni, Al and V. These alloys are referred to as, e.g., 1.5W(Ni) where the second alphabet between the parentheses indicates the constituent element substituted by W. Also, additional alloys with the simultaneous addition of 1.5 at% W and 3 at% Nb were prepared. In the additional alloys, Nb was substituted for V because experimental and theoretical studies have shown that Nb substitutes preferentially for V in Ni3V.22)
Table 2
Nominal compositions (at%) of the alloys used in this study.
| Alloy |
Ni |
Al |
V |
Nb |
W |
| Base |
75 |
10 |
15 |
- |
- |
| 1.5W(Ni) |
73.5 |
10 |
15 |
- |
1.5 |
| 1.5W(Al) |
75 |
8.5 |
15 |
- |
1.5 |
| 1.5W(V) |
75 |
10 |
13.5 |
- |
1.5 |
| 1.5W(Ni)3Nb |
73.5 |
10 |
12 |
3 |
1.5 |
| 1.5W(Al)3Nb |
75 |
8.5 |
12 |
3 |
1.5 |
| 1.5W(V)3Nb |
75 |
10 |
10.5 |
3 |
1.5 |
The alloys were made from starting raw materials of 99.99 mass% Ni, 99.99 mass% Al, 99.9 mass% V, 99.9 mass% W and 99.9 mass% Nb. Button ingots with 30 mm in diameter were prepared by arc melting in argon gas atmosphere using a non-consumable tungsten electrode on a copper hearth. The button ingots were remelted at least three times to ensure chemical homogeneity through the entire cross section. They were heat-treated (homogenized) at 1553 K for 5 h in vacuum and then furnace-cooled at a cooling rate of 10 K/min to room temperature. The button ingots were cut into proper sizes using an electro discharge machine. Some of the homogenized specimens were isothermally annealed in vacuum at 1248 K, 1223 K and 1198 K for intended durations up to 150 h, followed by furnace cooling.
Microstructural observation and phase identification were performed with field emission-type scanning electron microscopes (FESEM; JEOL JSM-7001F operating at 15 kV and JEOL JXA-8530F equipped with wave dispersive spectroscopy (WDS) operating at 20 kV), X-ray diffraction (XRD; Rigaku RINT-2500 operating at 35 kV) and a transmission electron microscope (TEM; JEOL JEM-2000FX microscope operating at 200 kV). The specimens used for the FESEM observation and XRD were abraded on SiC paper and were electrochemically polished in a mixture solution of 15 vol% H2SO4 + 85 vol% CH3OH at approximately 243 K. The XRD was performed using a CuKα target. XRD diffraction profiles for identifying the constituent phases were drawn at a scanning speed of 1°/min in diffraction angle range between 2θ = 20° and 100°. On the other hand, those for measuring precise lattice parameters of the two constituent phases were drawn at a scanning speed of 0.1°/min. The lattice parameters a of the Ni3Al phase were calculated using the 200 reflection peak appearing at 2θ~50.55°. The lattice parameters a and c of the Ni3V phase were calculated using the (200) and (004) reflection peaks appearing at 2θ~51.59° and 2θ~50.52°, respectively, according to a following equation:
| \[1/d^2 = 4 \sin2 \theta / \lambda^2 = ( h^2 + k^2 )/a^2 + l^2/c'^2,\] | (1) |
where
d is an interplanar spacing,
θ is diffraction angle, λ is a wave-length of X-ray,
h,
k and
l are Miller indices and
c' is a half of
c.
The specimens used for TEM observation, with approximately 3 mm in diameter, were mechanically abraded to approximately 0.03 mm in thickness. They were jet-polished in a mixture solution of 15 vol% H2SO4 + 85 vol% CH3OH at approximately 253 K. The TEM observation was performed mostly using a beam incident from [001] of the Ni3Al or Ni3V phase.
The Vickers hardness test was performed in the conditions of a holding time of 10 s and a load of 1 kgf at room temperature. The hardness data of at least 10 points were averaged after excluding the largest and smallest values for each experimental condition.
3. Results
3.1 Homogenized alloys with single addition of W
Figure 2 shows the FESEM-secondary electron images (SEIs) of the microstructures of the alloys homogenized at 1553 K for 5 h. The microstructures are composed of the primary Ni3Al precipitates and channel region with no third-phase precipitates or dispersions. The primary Ni3Al precipitates in the 1.5W(Al) alloy are especially fine and cuboidal while those of other alloys are coarser and more rounded than the 1.5W(Al) alloy. The volume fractions of the primary Ni3Al precipitates in the microstructures were measured from point count method and shown in Table 3. The measured volume fraction of the primary Ni3Al precipitates for the base alloy was roughly identical to that calculated from the phase diagram shown in Fig. 1.5): the volume fraction of the primary Ni3Al precipitates is calculated to be 70% if assuming that the solubility limits of the two constituent intermetallic phases are not affected by temperature below the eutectoid temperature. Also, the volume fraction of the primary Ni3Al precipitates was smaller in the 1.5W(Al) alloy than in the other alloys.

Table 3
Volume fractions (%) of the primary Ni
3Al precipitates in the microstructures of the homogenized alloys with the single addition of W and the simultaneous addition of W and Nb.
Base
(cal.) |
Base |
1.5W(Ni) |
1.5W(Al) |
1.5W(V) |
| 1.5W(Ni)3Nb |
1.5W(Al)3Nb |
1.5W(V)3Nb |
| 70 |
73 |
74 |
63 |
72 |
| 72 |
63 |
73 |
Figure 3 shows the TEM-bright field (BF) image and selected area diffraction pattern (SADPs) taken from area containing both the primary Ni3Al and channel region for each homogenized alloy. For reference, the simulated SADPs of the possible constituent phases are shown in the appendix (Fig. A1). The SAD spots corresponding to the 1/2 1 0 were observed for all the alloys, therefore indicating that the Ni3V phase is actually present in the channel region of all the alloys. In other words, the dual two-phase microstructures are formed in all the alloys. Regarding the partition behavior of the constituent elements Ni, Al and V, and the additive element W, the elemental maps analyzed from FESEM-WDS, e.g., for the 1.5W(Ni) alloy annealed at 1248 K for 5 h are shown in Fig. 4. W as well as V are enriched in the channel region (i.e. the prior A1 phase), consistent with the prediction that W stabilize the A1 phase and therefore is more dissolving in the channel region. Also, Ni4W second-phase precipitates were observed to occur in the channel region, as will be discussed later. Accordingly, it is presumed that in the homogenized state, W is enforced to dissolve into the major phase Ni3V comprising the eutectoid microstructure. Such a preferential partition behavior of W into the channel region was observed to occur irrespective of the W substitution manner.


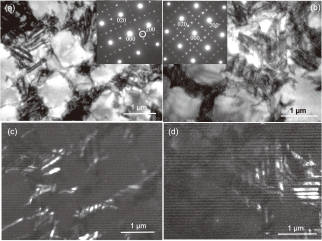


Figure 5 shows the XRD profiles of the homogenized alloys. For reference, the predicted diffraction peaks from the two binary Ni3Al and Ni3V phases are shown in the lower part of the figure (Figs. 5(c) and (d)). The different relative reflection intensities among the observed alloys are due to preferential orientation distribution of large grains (i.e., with a size of mm order) in as-melted alloys. Each reflection peak was indexed by probable reflections from the Ni3Al (L12) and Ni3V (D022) phases. The probable reflections are in many cases overlapped due to similar lattice parameters of both the phases, as shown in Figs. 5(c) and (d). However, the presence of the Ni3Al phase is at least confirmed because the ordered reflection peaks 100 and 110 from the Ni3Al phase were detected. Also, it is assumed that the Ni3V phase as well as the Ni3Al phase is present because some peaks including the 200 peaks around 2θ~51° split into two or three peaks, or made broad peaks, as shown in Fig. 5(b). Thus, the XRD results agree with the previous TEM observation (Fig. 3) in which rigorous phase identification was done.
Lattice parameters and unit cell volumes in the two constituent intermetallic phases were calculated from the XRD (Fig. 5), and plotted in Fig. 6. In many cases, the lattice parameters of the both phases were obtained resolving the overlapped peaks, with the help of the computer. Here, the lattice parameters c and unit cell volumes V of the Ni3V phase were divided by a factor 2 and plotted as c' and V' to equivalently compare with those of the Ni3Al phase. Here, the data points are plotted on the horizontal axis scaled by the nominal (i.e., overall) W content of the alloy but not plotted on that scaled by the W content actually partitioned in the two intermetallic phases. Taking into account the partition coefficient of W (Table 15)), the data points for the Ni3Al phase have to be plotted at lower W contents than 1.5 at% while those for the Ni3V phase larger W contents than 1.5 at%. In the Ni3Al phase, the changes of the lattice parameter as well as the unit cell volume by the addition of 1.5 at% W (nominal content) were small due to the low W partition coefficient into the Ni3Al phase. In the Ni3V phase, the changes of the lattice parameter (a and c') and unit cell volume (V') were large, agreeing with the large W partition coefficient into the Ni3V phase. The increase of the unit cell volume V' was the largest for the 1.5W(Al) alloy in the three alloys investigated. Comparing Fig. 6(c) with Fig. 6(d), it is found that the difference in the unit cell volume (ΔV = V−V') between the two intermetallic phases Ni3Al and Ni3V becomes small by the addition of 1.5 at% W (nominal content). In the base alloy and the three alloys in which W was substituted on different manners, the 1.5W(Al) alloy showed the smallest unit cell volume difference (−0.96 × 10⁻⁴ nm3) while the base alloy did the largest one (3.68 × 10⁻⁴ nm3). To quantitatively and reliably discuss the variations of the lattice parameters and unit cell volumes with W contents, the W contents actually partitioned in the two phases should be analyzed in near future, using e.g., TEM-energy dispersive spectroscopy (EDS).
Figure 7 shows the Vickers hardness of the alloys homogenized at 1553 K for 5 h. The hardness was more or less increased by the addition of 1.5 at% W (nominal content): the largest hardness was observed in the 1.5W(Al) alloy while the moderate hardness was observed in the 1.5W(Ni) and 1.5W(V) alloys.
3.2 Isothermally annealed alloys with single addition of W
The SEM observation reveals that the microstructure of the annealed alloys is primarily insensitive to the annealing time in the size and morphology. However, an exception was observed in the 1.5W(Ni) alloy: disk-shaped (or needle-like) fine precipitates were observed in the channel region, as shown in Fig. 8. W less soluble in the channel region is presumed to be precipitated during the isothermal annealing, combining with Ni. The precipitates will be in detail analyzed in the following TEM observation. Consequently, the solubility limits of W in the base alloy are smaller than 1.5 at% for the W(Ni) alloy but larger than 1.5 at% for the W(Al) and W(V) alloys.
Figure 9 shows the TEM-BF image and SADP of the microstructure of the 1.5W(Ni) alloy annealed at 1248 K for 5 h. The SAD spots corresponding to the 1/2 1 0 were visible (Fig. 9(b)). Also, the lamellar-like microstructures consisting of two (or three)-types of Ni3V variant structures were observed, indicating the development of the dual two-phase microstructure. Also, fine precipitates with a size of several hundred nm in diameter were observed in the channel region in the dark field (DF) image (Fig. 9(c)) taken from the extra spot (marked by a circle) neighboring to the incident beam in the selected area diffraction pattern (SADP) (Fig. 9(b)). The fine precipitates have to be the same as those observed in the SEM image of this alloy (Fig. 8). By the SADP analysis, the fine precipitates were identified as Ni4W with a tetragonal crystal structure (a = 0.5730 nm, c = 0.3553 nm) that have also been observed in the previous study.17) Figure 10 shows the TEM-BF and DF images of the microstructures of the 1.5W(V) alloy annealed at 1248 K for 5 h and 50 h, respectively. In both the annealing conditions, the dual two-phase microstructures were developed: the primary Ni3Al islands are surrounded with the channel region comprised of the lamellar-like microstructures consisting of two-types (or three-types) of Ni3V variant structures, as clearly imaged in the DF images taken from the 1/2 1 0 ordered spots. Also, it should be noted that the lamellar-like microstructures in the channel region coarsen during the annealing: the lamellar spacing becomes larger as the annealing time increases. Similar microstructural feature for the TEM images, i.e., the coarsening of the lamellar-like microstructures was observed for the 1.5W(Ni) and 1.5W(Al) alloys annealed at 1248 K.
Figure 11 shows the variations of the Vickers hardness with increasing annealing time at 1198 K, 1223 K and 1248 K for each alloy. For the base alloy, the hardness moderately increased with increasing annealing time and then reached constant values: the saturated hardness value was greater as the annealing temperature decreases. An apparent softening did not occur at a longer annealing time. For the W-added alloys, the hardness increased with increasing annealing time and made a peak, followed by decrease at a longer annealing time, irrespective of the W substitution manner or the annealing temperature. The peak hardness became larger and occurred at a longer annealing time as the annealing temperature decreases, as has been universally observed for age hardenable alloys. Also, the hardness increment by annealing was most significant in the 1.5W(Ni) alloy in which the precipitation occurred.
3.3 Alloys with simultaneous addition of W and Nb
The microstructural feature in the homogenized alloys with the simultaneous addition of W and Nb was similar to those with the single addition of W (Fig. 2). Both the elements were dissolving into the two constituent phases irrespective of the W substitution manners. The volume fractions of the primary Ni3Al precipitates were not different from those in the homogenized alloys with the single addition of W, as compared in Table 3. The hardness of the alloys with the simultaneous addition of W and Nb is compared with those with the single addition of W in Fig. 7. The hardness for the homogenized alloys with the simultaneous addition of W and Nb was larger than those with the single addition of W. The rank of the hardness in the observed alloys was same as that in the alloys with the single addition of W: the largest hardness was observed in the 1.5W(Al)3Nb alloy while the lowest hardness was observed in the 1.5W(V)3Nb alloy.
The TEM observation was carried out focusing on the microstructures of the isothermally annealed alloys. Figure 12 shows the TEM-BF image and SADP of the microstructure of the 1.5W(Ni)3Nb alloy annealed at 1248 K for 50 h. The SAD spots corresponding to the 1/2 1 0 were visible, indicating the formation of the dual two-phase microstructures. Many disk-shaped fine precipitates with a size of approximately one hundred nm in diameter were observed in the channel region, as shown in the DF image (Fig. 12(c)). The fine precipitates were the same Ni4W as that identified in the annealed 1.5W(Ni) alloy (see Fig. 9). Figure 13 shows the TEM images of the microstructures of the 1.5W(V)3Nb alloy homogenized and then annealed at 1248 K for 50 h. The TEM observation reveals that the dual two-phase microstructure has been already formed in the homogenized state before annealing. Also, an apparent coarsening of the lamellar-like microstructures in the channel region did not occur in contrast to the alloys with the single addition of W. Similarly, the coarsening of the lamellar-like microstructures did not occur in the annealed 1.5W(Al)3Nb and 1.5W(Ni)3Nb alloys.
Figure 14 shows the variations of Vickers hardness (HV) and Vickers hardness increment (ΔHV) with increasing annealing time at 1248 K for the alloys with the simultaneous addition of W and Nb, together with those for the alloys with the single addition of W. The data for the alloys with the single addition of W were redrawn from the previous diagrams shown in Fig. 11. The hardness of all the alloys with the simultaneous addition of W and Nb rapidly increased at an early annealing time and quickly reached steady (saturated) values. However, an apparent softening did not occur for all the alloys with the simultaneous addition of W and Nb, in contrast to the alloys with the single addition of W. Also, the hardness increment by annealing is most significant in the 1.5W(Ni)3Nb as well as 1.5W(Ni) alloys in which the precipitation occurred in the channel region.
4. Discussion
Let us first discuss the characteristic microstructures observed in the homogenized alloys. The 1.5W(Al) alloy exhibited the microstructures with the most distinctively cuboidal and fine Ni3Al precipitates, that is, the most coherent microstructure between the constituent phases, as shown in Fig. 2. It is not irrational to assume that lattice misfit parameter primary governs the microstructural coherency for the present dual two-phase microstructure, if considering some analogy with the microstructure of the γ/γ' type superalloys.23–28) In this case, the unit cell volume misfit,δ, defined according to
| \[\delta = 2 \times [(V-V')/(V+V')] \times 100 (\%)\] | (2) |
is adequate to be evaluated because the lattice misfits in the three orthogonal axes between the both constituent structures are implicitly involved in this equation. Here,
V and
V' are already defined in the previous section. Using the data shown in
Fig. 6, the values of 0.90%, 0.30%, −0.18% and 0.31% are calculated as the unit volume misfits for the base, 1.5W(Ni), 1.5W(Al) and 1.5W(V) alloys, respectively: the calculated misfit is negative and the lowest for the 1.5W(Al) alloy, whereas positive and the largest for the base alloy in the four alloys observed. The calculated values are consistent with the microstructural coherency observed on the homogenized alloys (
Fig. 2): the base alloy exhibited the microstructure with the rounded Ni
3Al precipitates while the 1.5W(Al) alloy did that with the most cuboidal one. As a result, it was found that the addition of 1.5 at% W into the base alloy is effective in improving the microstructural coherency between the primary Ni
3Al precipitates and the channel region involving the Ni
3V phase.
Next, let us discuss the hardening mechanisms operating on each alloy homogenized and annealed (see Table 4). Regarding the homogenized alloys with the single addition of W, the hardness was ranked in order, the base < 1.5W(Ni)~1.5W(V) < 1.5W(Al) alloys (Fig. 7). The hardening mechanism for the base alloy definitely stems from the specifically unique dual two-phase microstructure involving various interfaces between two intermetallic phases or between different Ni3V variant structures in the channel region. It is expected that mobile dislocations activated in primary Ni3Al precipitates or lamellar-like Ni3Al or Ni3V phase comprising the eutectoid microstructure interact with the phase interfaces. Similarly, the mobile dislocations interact the interfaces between different D022 variant structures in the eutectoid microstructure (channel region), resulting in extra hardening. When the mobile dislocations penetrate the interfaces, extrinsic interface dislocations are left at the interfaces. Such extrinsic interface dislocations have to retard the penetration of the successive mobile dislocations, resulting in further hardening. The total interface area per unit volume of the alloy increases as the microstructure becomes finer. Consequently, the chance of the interaction between the mobile dislocations and the interfaces increases, resulting in extremely large base-hardening in the present dual two-phase intermetallic alloy.
Table 4
Strengthening mechanisms operating on the homogenized and annealed (
italic) alloys.
| alloys |
1.5W(Ni)
1.5W(Ni)3Nb |
1.5W(Al)
1.5W(Al)3Nb |
1.5W(V)
1.5W(V)3Nb |
Additional
hardening |
Precipitation
hardening |
Hardening due to further
microstructural refining |
- |
| Solid solution hardening due to W (and Nb) |
| Base-hardening |
Dual two-phase hardening
(due to fine, coherent and duplex microstructure) |
The additional hardening mechanisms operating on the alloys with the single addition of W can be attributed to the solid solution hardening due to W dissolving in the two constituent phases. The parameter, the unit cell volume increment rate |dV/dC| or |dV'/dC| derived from Figs. 6(c) and (d) would be a measure by which the solid solution hardening can be experimentally evaluated. Here, C is the W content (defined by at%) in the constituent phases. It is predicted that the larger the |dV/dC| is, the larger the solid solution hardening is. In Figs. 6(c) and (d), it is evident that the slopes in the Ni3Al phase were small and not so different among the three W substitution manners while those in the Ni3V phase are large. This result reflects that W is much more dissolving in the Ni3V phase via the prior A1 phase (consistent with Table 1 and Fig. 4). The rank of the hardness shown in Fig. 7 was identical to the rank of the |dV'/dC| in the Ni3V phase (Fig. 6(d)). Consequently, the additional hardening operating on the three alloys appears to be dominated by the solid solution hardening due to W dissolving in the Ni3V phase. Besides, the hardening due to the finer microstructure (composed of the finer Ni3Al precipitates) should be further added to the solid solution hardening and base-hardening operating on the 1.5W(Al) alloy, consequently resulting in the largest hardness. For the hardness of the alloys with the simultaneous addition of W and Nb, the rank was the same as that of the alloys with the single addition of W (Fig. 7). In this case, the solid solution hardening due to Nb substituted for V in the Ni3V phase had to be equally added to the three alloys.
The fine disk-shaped Ni4W was precipitated in the channel region of the isothermally annealed 1.5W(Ni) alloy as well as 1.5W(Ni)3Nb alloy (Figs. 9 and 12). As described already, W dissolving in the A1 phase exceeds the solubility limit in the two intermetallic phases present at low temperatures and consequently is precipitated as Ni4W.17) Relative W content to Ni in the prior A1 phase becomes more excess in the alloys in which W is substituted for Ni but not in the alloys in which W is substituted for Al or V. Therefore, it is most conceivable that the precipitation occurs in the 1.5W(Ni) (or 1.5W(Ni)3Nb)) alloy.
During isothermal annealing, distinctive difference was observed in the hardening behavior between the alloys with the single addition of W and the simultaneous addition of W and Nb (Fig. 14). In the alloys with the single addition of W, the hardening and subsequent softening took place irrespective of the precipitation of Ni4W. The eutectoid microstructure formed in the specimen furnace-cooled after the homogenization has to be prematurely developed. Accordingly, it is expected that the hardness increases as the degree of ordering in the two intermetallic phases proceeds with increasing annealing time, accompanied with the maturity of the Ni3V variant structures. The softening after reaching the hardness peak can be attributed to the coarsening of the eutectoid microstructure, i.e. the lamellar-like microstructures in the channel region (Fig. 10). There is another reason for this: since the W addition to the base alloy lowers the eutectoid temperature (1273 K) by a roughly 20 K,5) the relative annealing temperatures (1248 K, 1223 K and 1198 K) to the eutectoid temperature becomes high. Accordingly, the driving force (or chemical free energy) for the eutectoid reaction becomes small. Thus, the eutectoid microstructure has to be destabilized at a longer annealing time, resulting in the hardness decrease. On the other hand, apparent softening was not observed for the alloys with the simultaneous addition of W and Nb. Similar hardening behavior unaccompanied with the softening has been observed in the 75Ni8.75Al13.25V3Nb and 75Ni7.5Al15V3Nb (in at%) alloys isothermally annealed at 1248 K.19) Nb is the element stabilizing the eutectoid microstructure through stabilizing the two intermetallic phases. Since the Nb addition to the base alloy raises the eutectoid temperature by a roughly 30 K,5) the relative annealing temperatures to the eutectoid temperature becomes low. Consequently, the driving force (or the chemical free energy) for the eutectoid reaction becomes large. As a result, the eutectoid microstructure has to be much stabilized, suppressing in the hardness decrease. Also, Figs. 14(b) and (d) indicate that the hardness increment over the whole annealing time was the largest for the 1.5W(Ni) as well as 1.5W(Ni)3Nb alloys in which Ni4W was precipitated during isothermal annealing. The result implies that the precipitation hardening and the solid solution hardening are additive on those alloys.
Last, it should be pointed out that in the base alloy the initial hardness increase during isothermal annealing is negligibly small and never softened at a prolonged annealing time. The result means that the microstructural stability of the base alloy is intrinsically high. In other words, the eutectoid microstructure in the base alloy is already developed before annealing, i.e., during the furnace-cooling after the homogenization and is quite stable at high temperatures.
From the engineering point of view, the simultaneous addition of W and Nb to the Ni-Al-V alloy system is very useful because not only the microstructural stability but also the hardening capability are enhanced. High temperature resistant alloys that should not soften in creep condition, i.e., during longer annealing time are required. The dual two-phase alloys with the simultaneous addition of W and Nb meet this demand.
5. Conclusions
The effects of the single addition of W and the simultaneous addition of W and Nb on the dual two-phase microstructure and related hardening behavior were investigated in terms of the W substitution manner for Ni, Al or V, using field emission-type scanning electron microscopy (FE-SEM), X-ray diffraction (XRD), transmission electron microscopy (TEM) and Vickers hardness test. The following results were obtained from the present study.
-
(1)
The microstructures in the homogenized alloys depended on the W substitution manner for Ni, Al or V. Distinctively coherent microstructure was developed for the alloy in which W was substituted for Al and attributed to the small unit cell volume misfit between the Ni3Al and Ni3V structures.
-
(2)
The fine Ni4W precipitates were observed to occur in the channel region of the isothermally annealed alloy in which W was substituted for Ni.
-
(3)
The largest hardness was observed in the homogenized alloy in which W was substituted for Al and attributed to the solid solution hardening due to W preferentially dissolving in the Ni3V phase, in addition to the base-hardening due to the coherent and fine dual two-phase microstructure.
-
(4)
The hardness of the alloys with the single addition of W increased and made a peak with increasing annealing time, followed by decrease at a longer annealing time. The initial increase of hardness was attributed to the maturity of the eutectoid microstructures in the channel region. The subsequent softening was attributed to the coarsening of the eutectoid microstructure in the channel region.
-
(5)
The hardness of the alloys with the simultaneous addition of W and Nb rapidly reached steady hardness level at an early annealing time and did not decrease at a prolonged annealing time. Such hardening behavior was attributed to the stabilization of the eutectoid microstructure by the Nb addition.
-
(6)
The hardening mechanisms operating on the homogenized and annealed alloys in which W was substituted in different manners were discussed in association with the developed microstructures and lattice properties of W (and Nb) in the constituent intermetallic phases.
Acknowledgements
This work was supported in part by a Grant-in-Aid for Scientific Research (B) (No. 26289263) from the Japan Society for the Promotion of Science (JSPS).
Appendix: Selected area diffraction patterns of two-phase Ni3Al and Ni3V microstructure
The dual two-phase microstructure is composed of two intermetallic phases, Ni3Al (L12) and Ni3V (D022). The former phase is involved in the microstructure as primary precipitates, along with plates laminated with the latter phase in the channel region. These phases generally maintain a rigid orientation relationship, i.e., crystallographic coherency. The laminated Ni3V has three variant structures. Figure A1 shows the simulated TEM-SAD patterns of the ordered reflections corresponding to the L12 (Ni3Al) structure and to three variant structures, X, Y and Z, of the D022 (Ni3V) structure. The c-axes of the three variant structures X, Y and Z have an orthogonal relationship. From these simulated patterns, it is possible to identify whether the Ni3V phase exists in the channel region, i.e., whether a two-phase microstructure is formed in the channel region.
REFERENCES
- 1) R. Mitra: Structural intermetallics and intermetallic matrix composites, CRC Press, (2015).
- 2) R.W. Cahn, D.R.F. West, D.J. Dunstan, M. McLean, J.W. Martin and D. Morris: Phil. Trans. Phys. Sci. Eng. 351 (1995) 497–509. 10.1098/rsta.1995.0049
- 3) S.C. Huang and P.A. Siemers: Metall. Trans., A, Phys. Metall. Mater. Sci. 20 (1989) 1899–1906. 10.1007/BF02650276
- 4) D.M. Dimiduk and J.H. Perepezko: MRS Bull. 28 (2003) 639–645. 10.1557/mrs2003.191
- 5) S. Kobayashi, K. Sato, E. Hayashi, T. Osaka, T.J. Konno, Y. Kaneno and T. Takasugi: Intermetallics 23 (2012) 68–75. 10.1016/j.intermet.2011.12.008
- 6) Y. Nunomura, Y. Kaneno and T. Takasugi: Intermetallics 12 (2004) 389–399. 10.1016/j.intermet.2003.12.011
- 7) Y. Nunomura, Y. Kaneno, H. Tsuda and T. Takasugi: Acta Mater. 54 (2006) 851–860. 10.1016/j.actamat.2005.10.014
- 8) S. Shibuya, Y. Kaneno, M. Yoshida and T. Takasugi: Acta Mater. 54 (2006) 861–870. 10.1016/j.actamat.2005.10.016
- 9) S. Shibuya, Y. Kaneno, H. Tsuda and T. Takasugi: Intermetallics 15 (2007) 338–348. 10.1016/j.intermet.2006.08.004
- 10) S. Shibuya, Y. Kaneno, M. Yoshida, T. Shishido and T. Takasugi: Intermetallics 15 (2007) 119–127. 10.1016/j.intermet.2006.03.009
- 11) W. Soga, Y. Kaneno and T. Takasugi: Intermetallics 14 (2006) 170–179. 10.1016/j.intermet.2005.05.002
- 12) W. Soga, Y. Kaneno and T. Takasugi: Mater. Sci. Eng. A 473 (2008) 180–188. 10.1016/j.msea.2007.03.080
- 13) K. Kawahara, Y. Kaneno and T. Takasugi: Intermetallics 17 (2009) 938–944. 10.1016/j.intermet.2009.04.004
- 14) K. Kawahara, T. Moronaga, Y. Kaneno, A. Kakitsuji and T. Takasugi: Mater. Trans. 51 (2010) 1395–1403. 10.2320/matertrans.M2010097
- 15) T. Moronaga, S. Ishii, Y. Kaneno, H. Tsuda and T. Takasugi: MRS Symp. Proc. Publ. 1295 (2011) 231–236.
- 16) T. Moronaga, S. Ishii, Y. Kaneno, H. Tsuda and T. Takasugi: Mat. Sci. Eng. A 539 (2012) 30–37. 10.1016/j.msea.2011.12.106
- 17) D. Edatsugi, Y. Kaneno, S. Semboshi and T. Takasugi: Metall. Mater. Trans., A 47 (2016) 998–1008. 10.1007/s11661-015-3297-2
- 18) T. Moronaga, Y. Kaneno, S. Semboshi and T. Takasugi: Philos. Mag. 95 (2015) 3859–3875. 10.1080/14786435.2015.1108526
- 19) Y. Kaneno, W. Soga, H. Tsuda and T. Takasugi: J. Mater. Sci. 43 (2008) 748–758. 10.1007/s10853-007-2192-7
- 20) T. Takasugi and Y. Kaneno: MRS Symp. Proc. Publ. 1128 (2009) 351–356.
- 21) T. Yokokawa, M. Osawa, K. Nishida, T. Kobayashi, Y. Koizumi and H. Harada: Scr. Mater. 49 (2003) 1041–46. 10.1016/S1359-6462(03)00437-8
- 22) H. Sugimura, Y. Kaneno and T. Takasugi: J. Alloy. Compd. 496 (2010) 116–121. 10.1016/j.jallcom.2010.02.179
- 23) R. C. Reed: The superalloys: fundamentals and applications, Cambridge University Press, (2008).
- 24) T. Miyazaki, K. Seki, M. Doi and T. Kozakai: Mater. Sci. Eng. A 77 (1986) 125–132. 10.1016/0025-5416(86)90360-5
- 25) T. Miyazaki and M. Doi: Mater. Sci. Eng. A 110 (1989) 175–185. 10.1016/0921-5093(89)90168-8
- 26) W.C. Johnson and J.W. Cahn: Acta Metall. 32 (1984) 1925–1933. 10.1016/0001-6160(84)90174-3
- 27) M. Doi, T. Miyazaki and T. Wakatsuki: Mater. Sci. Eng. A 67 (1984) 247–253. 10.1016/0025-5416(84)90056-9
- 28) R.A. Ricks, A.J. Porter and R.C. Ecob: Acta Metall. 31 (1983) 43–53. 10.1016/0001-6160(83)90062-7

