Anisotropic Ferrite Growth and Substructure Formation during Bainite Transformation in Fe-9Ni-C Alloys: In-Situ Measurement
2018 Volume 59 Issue 2 Pages 214-223

Details
2018 Volume 59 Issue 2 Pages 214-223
Growth kinetics of bainitic ferrite is re-examined in Fe-C-9%Ni alloys by taking the morphological anisotropy of bainitic ferrite due to crystallographic constraint in in-situ observation using confocal laser scanning microscopy. The true lengthening kinetics determined, after identifying crystallographic variants of bainitic ferrite in post-transformation EBSD measurement, is faster by a factor of about 4 than the apparent lengthening kinetics measured as a projection on the observed surface. The lengthening rate is mostly equal to or still slower than those predicted by carbon diffusion controlled kinetics. Variant pairing of bainitic ferrite belonging to the same Bain group occurred preferably in development of local substructure as previously reported in low-alloy low-carbon steels.
Bainite transformation attracts more attention in development of modern high strength steels for application as sheet or plate steels. The mechanisms of bainite transformation has been under extensive discussions in decades based upon diffusion controlled processes and diffusionless/displacive processes1–3). One issue is growth kinetics of the ferrite component in the bainite structure. It is well known that Widmanstätten ferrite or ferrite component in bainite (hereafter bainitic ferrite) exhibits anisotropic morphologies. For Widmanstätten ferrite, plate-like morphology was well accepted in two-dimensional observation although degenerate morphology became dominant at lower temperature due to sympathetic nucleation4). Ex-situ and in-situ measurements mostly indicated that lengthening kinetics is slower than diffusion-controlled ones as summarized in Table 1. In the classical growth kinetics analysis, quantitative measurement of ferrite size was made after various isothermal transformation treatments5–7). There were also many studies on the lengthening kinetics using in-situ observation8–16). It is well known that theoretical analyses based on Zener-Hillert17,18) or Trivedi19) model assuming the plate with a cylindrical or ellipsoidal growth tip mostly predicted faster lengthening rates20). On the other hand, 3-dimensinal observation utilizing serial sectioning by Spanos et al.21) revealed that the true morphology is elongated triangular pyramid for primary Widmanstätten ferrite growing directly from austenite grain boundary but lath or plate for secondary Widmanstätten ferrite growing from grain boundary allotriomorph. Later, Enomoto et al.22) also deduced lath-like morphology of intragranular Widmanstätten ferrite (so-called ‘acicular ferrite’) in a low carbon steel weld metal. It was confirmed that such a ferrite with ~{111}γ//{110}α habit plane grows preferentially along <110>γ//<111>α. Thus, it is necessary to re-examine the lengthening kinetics of bainite by taking projection effects on the observing surface into account.
| Researchers | Alloys (mass%) | Temperature (K) | Growth rate (μm/s) | Method |
|---|---|---|---|---|
| Tsuya8) | Fe-0.8C-0.3Si-0.85Mn Fe-2.2Ni-1.1Cr-0.2Mo |
548~748 | 0.02~1 | In-situ (OM) |
| Hillert5) | Fe-(0.25~0.55)C-(0, 1.0)Ni-(0, 1.0)Si Fe-(0.2~0.8)C-(0.02, 0.3)Si-(0.2~0.6)Mn |
353~1023 | 0.3~400 | Freezing (OM) |
| Speich, Cohen9) | Fe-(1.0~1.4) C, Fe-1.1C-2.7Cr, Fe-1.1C-5.3Ni | 448~623 | 5~50 | In-situ (OM) |
| Goodenow et al.10) | Fe-(0.01~0.7)C-(0.2~0.4)Si-(0.6~0.8)Mn-9Ni -(0~0.9)Cr-(0~0.3)Mo Fe-0.7C-0.7Si-0.85Mn-1.8Ni-0.85Cr-0.8Mo |
180~525 | 0.005~2 | In-situ (OM) |
| Rao, Winchell11) | Fe-(0.12~0.75)C-10Ni | 656, 673 | 0.3~4 | In-situ (OM) |
| Yada et al.12,13) | Fe-(0.3~0.7)C-6Ni | 473~773 | 0.01~9 | In-situ (OM) |
| Schoen, Owen14) | Fe-(0.01~0.2)C-10Ni | 653, 723 | 0.05~1 | In-situ (OM) |
| Simonen et al.6) | Fe-(0.24~0.43)C | 723~973 | 0.6~3.2 | Freezing (OM) |
| Nemoto15) | Fe-0.5C-9Ni | 653 | 0.05 | In-situ (TEM) |
| Bhadeshia16) | Fe-0.43C-2Si-3Mn | 653 | 75 | In-situ (OM) |
| Quidor, Bretchet7) | Fe-0.5C-5Ni, Fe-0.5C-5Ni-1Si | 573~773 | 0.2~4 | Freezing (OM) |
Furthermore, the grain size of bainitic ferrite is important for strengthening and toughening. Effective grains in bainite structure are packets and blocks, which are similar to lath martensite. The present authors examined those substructures in Fe-C-9Ni alloys by using electron backscatter diffraction technique23) and showed that block size decreases as transformation temperature or carbon content is lowered. However, later, Takayama et al.24) reported that a region of the same Bain correspondence consisting of variants misoriented by low angles (denoted as 'Bain region') is formed dominantly at high temperature bainite in a low-carbon, low-alloy steel. It is also necessary to examine the substructure development in Fe-C-Ni alloys under the concept of the Bain region.
The present study aims to examine the growth behaviors of bainitic ferrite by in-situ high temperature observation and ex-situ electron backscatters diffraction (EBSD) analysis in the same Fe-C-Ni alloys used previously23). True lengthening rate of bainitic ferrite is deduced by converting from the projected growth rates measured on the surface and sequence of variant pairing developed is clarified.
The materials used in this study are Fe-C-9Ni (mass%) alloys. Ingots prepared by induction melting were hot-forged to 15 mm thick plates and homogenized in Ar gas atmosphere. Carbon contents after homogenization are 0.08, 0.23 and 0.4 mass% as listed in Table 2 with corresponding Ae3 temperatures for para-equilibrium and Ms temperatures. For in-situ observation of bainite transformation, confocal laser scanning microscope (CLSM) with a heating stage first evacuated by rotary pump and back-filled with high-purity Ar gas of which oxygen was removed by filtering was used. Inside the stage, platelets of 3 mml × 2 mmw × 1 mmt, which were buff-polished using diamond paste (3 μm and 1 μm) and colloidal silica, were infrared heated to 1370 K at 20 K/s, held for 900 s and cooled to various transformation temperatures in a range between 773 K and 623 K at 5 K/s and held for various time periods. It was confirmed that bainitic ferrite accompanies a sharp surface relief, which enable us to measure its growth kinetics. After apparent transformation was finished, the specimens were furnace cooled to room temperature. Post transformation structure was observed by field-emission SEM (Joel JSM7001F) with EBSD measurement after being lightly buff polished using diamond paste and colloidal silica, and finished with vibratory polishing with active oxide polishing suspension. Orientation analysis was performed by using the TSL-OIM software.
| Alloy | C (mass%) | Ni (mass%) | Para-Ae3 (K) | Ms (K) |
|---|---|---|---|---|
| 0.08 C | 0.083 | 8.93 | 878 | 640 |
| 0.23 C | 0.232 | 9.02 | 866 | 586 |
| 0.4 C | 0.405 | 9.20 | 852 | 524 |
Orientation relationship (OR) of bainitic ferrite with respect to its austenite matrix was determined using the fully transformed specimens by the reconstruction method reported previously25). Figure 1 shows the ferrite/austenite orientation relationships deduced. As the carbon content is increased, the angular deviation between the close-packed planes of the two phases (θCPP) and that between the close-packed directions (θCPD) become slightly larger. Also, it seems that θCPP increases as the transformation temperature becomes higher. These measured ORs, which deviate slightly from the exact K-S OR were used to calculate the misorientation matrices between different variants to identify the inter-variant boundaries in the bainitic structure. The same notation of the near K-S variants as Takayama et al.24) was used in the present study.

Misorientation from the K-S relationship for all the transformation conditions.
Here, the development of bainite structure during isothermal holding is shown by observation of surface reliefs due to displacive characters of bainite transformation. Isothermal transformation microstructures in the heat treatments used were previously examined by SEM and TEM23), confirming the transformation product is bainite with cementite precipitation in the temperature range examined except at 773 K in the 0.4 C alloy.
Figures 2(a)~(c) show microstructure changes of the 0.08 C, 0.23 C and 0.4 C alloys during holding at 773 K, respectively. In all the alloys, bainitic ferrite starts to form at the grain boundaries of austenite matrix and grows toward the grain interior. In the 0.08 C alloy, bainitic ferrite grows fast in a form of needles or laths in the beginning and later develops as an aggregate. On the other hand, aggregates, which were shown to be ‘blocks’ or ‘packets’ by EBSD analyses, are formed at early stages in the 0.23 C and 0.4 C alloys. It is also seen that faint and granular relieves start to grow from a grain edge or corner as enclosed by dashed lines in (c). Those were identified as degenerate pearlite after polishing and etching.

CLSM images of the specimens transformed at 773 K. (a) 0.08 C, (b) 0.23 C and (c) 0.4 C alloys.
Figures 3(a)~(c) show microstructure changes of the 0.08 C, 0.23 C and 0.4 C alloys during holding at 723 K, respectively. As carbon content increases from (a) to (c), ‘interface’ of surface relief and the matrix becomes perturbed macroscopically and bainite grows slower. As pointed out by arrows in the figures, formation of relieves growing along different directions occurs from the interface of pre-existing relieves, which becomes more obvious as transformation proceeds. Figure 4 shows microstructure of the 0.4 C alloy transformed at 623 K. Star-like aggregates of bainitic ferrite with different growth directions are formed as holding is extended. As temperature is lowered, bainite is also formed within the grain as well as at grain boundaries in this alloy.

CLSM images of the specimens transformed at 723 K. (a) 0.08 C, (b) 0.23 C and (c) 0.4 C alloys.

CLSM images of the 0.4 C alloy transformed at 623 K.
Based on the surface relief observation, lengthening behaviors of bainitic ferrite were examined. Figures 5(a) and (b) are CLSM images showing lengthening of individual bainitic ferrite (BF) for the 0.08 C and the 0.4 alloys transformed at 773 K, respectively. Clear relieves associated with ferrite lengthening advance from left to right in both cases. It is noted that the lengthening rate is much slower in the 0.4 C alloy than in the 0.08 C alloys at this temperature.
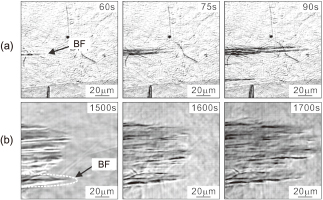
CLSM images showing lengthening of individual bainitic ferrite (BF). (a) 0.08 C and (b) 0.4 alloys transformed at 773 K.
Figure 6 shows that length change of bainitic ferrite measured by CLSM in each alloy transformed at various temperatures. In all the cases, the length changes continuously and linearly with holding time although there is some case in which grow rate changes in short time scale, typically seen at 723 K of (a). Similar features were reported in in-situ TEM experiments by Nemoto15), which are quite different to the repeated nucleation of fine ferrite ‘subunits’ observed in Fe-Mn-Si-C26) or 'degenerated ferrite' observed in Fe-C-Mo27) and in Fe-C-Cr28). The slope representing the lengthening rate shows scatters among different bainitic ferrites and becomes larger at lower temperature. However, the ratio of the maximum and minimum is less than 10 except in the 0.08 C at 723 K. Figure 7 shows the variation of lengthening rate with temperature for the alloys studied. At 773 K or 723 K, average growth rate increases as carbon content decreases. As temperature decreases, furthermore, growth rate tends to increase for the 0.08 C and 0.23 C alloys whereas that of the 0.4 C alloy decreases. This tendency was observed recently by Yin et al.29), who rationalized differences in C-curve of growth kinetics between low or medium carbon and high carbon alloys.
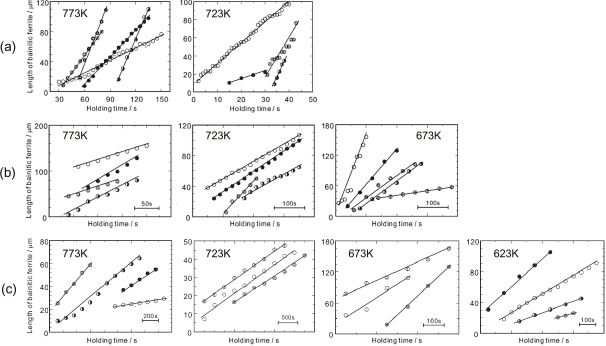
Variation of bainitic ferrite length at various temperatures. (a) 0.08 C, (b) 0.23 C and (c) 0.4 C alloys. Different symbols represent lengthening of different plates.

Lengthening rate measured by CLSM; (a) 0.08 C, (b) 0.23 C and (c) 0.4 C alloys. Note that the plots for different alloys at the same temperature were shifted each other by a small margin along the horizontal axis for easier identification. Each line connects average rates at different temperatures for each alloy.
Figure 8 shows ferrite orientation maps after bainite transformation is completed in the alloys used. At 773 K, coarse-grained regions containing low angle boundaries are formed. As the transformation temperature decreases, the grain size of the region surrounded by high angle boundaries decreases clearly in each alloy. Also when the alloys of different carbon contents were compared at 723 K or 673 K, the grain size increases with the increase of carbon content. At those temperatures, the bainite substructures similar to packets and blocks in lath martensite are recognized as reported in the previous study23).
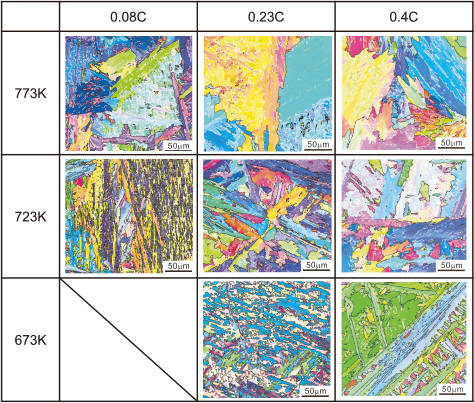
Ferrite orientation maps of (a) 0.08 C, (b) 0.23 C and (c) 0.4 C alloys. White line: low-angle boundary of which misorientation is between 5 to 15°, black line: high-angle boundary misoriented by more than 15.
Figure 9 shows fractions of the inter-variant boundaries in the bainite structure. Degenerate pearlite was formed partly at 773 K in the 0.4 C alloy. Since the growing interface of degenerate pearlite deviates largely from the K-S OR30), the analysis of variant pairing could not be made in this case. At 773 K where the coarse-grained bainite regions were formed in Fig. 8, the variants belonging to the same Bain group (V1, V4, V8, V11, V13, V16, V21 and V24) are dominantly formed in the 0.08 C (Fig. 9(a)) and 0.23 C (Fig. 9(b)) alloys. In particular, the fractions of V1/V4 and V1/V8 boundaries are extremely high. On the other hand, the fractions of inter-variant boundaries in the same CP group, i.e., the same packet, increase at 723 K in the 0.08 C alloy or at 673 K in the 0.23 C alloy. It is also seen that the increase in the carbon content leads to the increase in the variant pairing of the same Bain group at each transformation temperature. Such a variation with respect to the transformation temperature is essentially the same as that reported previously in the low-alloy, low-carbon steel by Takayama et al.24) They pointed out that formation of different variants is pronounced as the driving force of transformation increases by decreasing temperature. Decrease of carbon content also results in increase of driving force despite of decrease of the matrix strength not suitable for self-accommodation of transformation strain. Those effects are thought to be the main reasons of the finer 'grain' size at lower temperature or lower carbon content and can explain the observed variant pairing in the present study reasonably well.
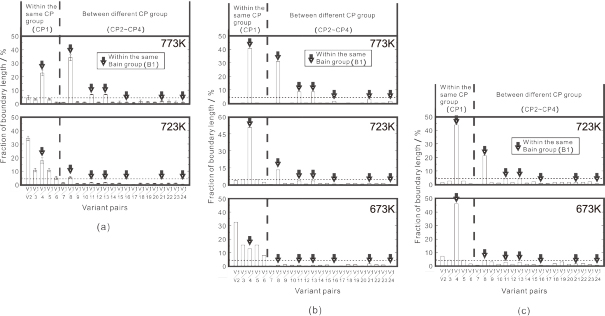
Fraction of variant pairing in the bainite structure; (a) 0.08 C, (b) 0.23 C and (c) 0.4 C alloys, respectively. Arrows indicate the inter-variant boundaries in the same Bain group (B1) [24]. Horizontal dotted line represents the expected fraction for random formation of all the 24 variants (4.3%).
In order to clarify actual sequence of the variant pairing, in-situ CLSM observation was combined with the ex-situ EBSD analysis in the same area after the completion of transformation. Figure 10 shows the result in the 0.23 C alloy transformed at 723 K. By comparing Figs. 10(a) and (d), it is clear that bainitic ferrites of V1 and V4 grow together after nucleating at austenite grain boundaries. Since there is usually strong variant selection in grain boundary nucleation of bainitic ferrite31,32), it is likely that one variant forms first and nucleation of another variant neighboring to the first one follows. As transformation proceeds, V8 nucleates at the V1/austenite interface and formation of V11 on top of V8 occurs subsequently (see Figs. 10(b) and (d)). Since the habit planes of V1/V4 and V8/V11 are different, change in the apparent growth direction occurs between those pairs.

Development of bainite substructure in the 0.23 C alloy transformed at 723 K. (a), (b) in-situ CLSM images, (c) 001α pole figure and (d) corresponding ferrite orientation map after transformation is completed. Note V8/V11 pairing is equivalent to V1/V4 pairing in the misorientation.
Figure 11 shows the analysis made in the same alloy transformed at a lower temperature, 673 K. Here it can be recognized that sharp and smooth reliefs form first as encircled in (a) and complexity in the relieves due to multi-variant formation comes later in (b). White arrow in (b) indicates formation of V1/V2 pair whereas black arrow seems to indicate formation of one variant (perhaps V2 in (e)) in the beginning. During further holding, formation of another CP group (V17/V18) is observed in (b) and (c). V1/V2 and V17/V18 are both twin-related pairing and effectively accommodate transformation strain33). In the center region of Fig. 11(e), bainitic ferrite of V18 dominates and that of V17 appears to be minor. Thus, it is likely that V18 forms first and its twin-related variant, V17, is formed subsequently. Also, since the formation of V8 occurs attached to V1, there is still some tendency to form the same Bain group in neighbor at this temperature.
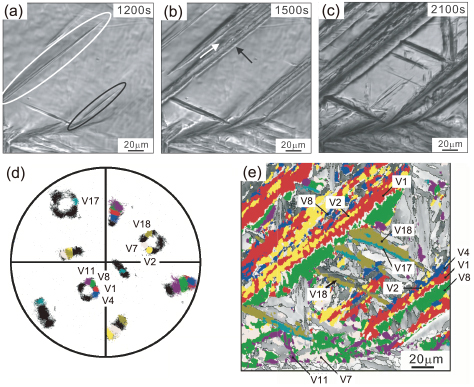
Development of bainite substructure in the 0.23 C alloy transformed at 673 K. (a)–(c) in-situ CLSM images, (d) 001α pole figure and (f) corresponding ferrite orientation map after transformation is completed. Note V1/V2 and V17/V18 pairs are both twin-related.
In the present study, in-situ CLMS observation of surface relieves associated with bainite transformation was made in combination of ex-situ local crystallographic analyses. It is known that bainitic ferrite exhibits lath morphology34). The habit plane of ferrite lath is deviated from the parallel close packed plane, (111)γ//(011)α and shows scattering around (252)γ~(232)γ. The longitudinal direction of lath is close to the parallel close-packed directions, [−101]γ//[−1−11]α. Figure 12(a) shows geometrical configuration of bainitic ferrite lath intersected on the surface. Since we could reconstruct the orientation of austenite from bainitic ferrite orientations, it is easy to deduce the misorientation angle (θ) between the true lengthening direction and the apparent growth direction on the surface.

(a) Geometrical configuration of bainitic ferrite lath intersected on the surface. (b) 011α poles and (c) 001α poles calculated for 24 K-S variants on austenite stereographic projection. (d), (e) Deduction of the apparent growth direction plotted on the 011α pole figure and (e) angular deviation in growth direction (θ) on the 001α pole figure, respectively.
Figures 12(b) and (c) shows (011)α and (001)α pole figures for the ideal K-S OR, respectively. Characteristic {011}α pole groups in (b) and {001}α pole groups in (c) are encircled, respectively. At the center of each pole group, a low-indexed γ pole is located. If the variant of bainitic ferrite is identified, the parallel closed-packed plane (CPP) and the parallel close-packed directions (CPD) are both determined based on this kind of orientation distributions. Figures 12(d) and (e) are typical examples analyzed. Here, the center of the stereographic projection corresponds to the surface plane normal. Apparent and true growth directions are both located on the great circle and the misorientation θ was deduced.
The measurement was made in the 0.08 C alloy transformed at 773 K. Figure 13 shows variation of the apparent lengthening rate with respect to angular deviation of true lengthening direction from the apparent one observed in in-situ experiments. As the deviation angle θ decreases and approaches to zero, the growth rate increases drastically. The growth rate at larger angle should corresponds the edgewise growth. The ratio of the maximum and minimum, about 4, indeed, is nearly equal to the length/width ratio observed in the previous study on the 3D morphology of Widmanstatten ferrite plate22). However, even at the same angular deviation, there is some scatter as pointed out by arrows. The observed change is significantly affected by the actual morphology. Since we could not measure the length/width aspect ratio (denoted as ‘a’), a rough estimation of variation curve against the deviation angle for different aspect ratios was made by assuming an elliptic plate for ferrite morphology as in Fig. 13(b). The apparent growth rate, va, and the ratio of the apparent growth rate, f(θ) and the true longwise growth rate, v1, is given as follows.
| \[ v_{a} = \frac{L_{a}}{L_{1}} \cdot v_{1} = v_{1} \cdot f(\theta) \qquad f(\theta) = \sqrt{ \frac{1 + \tan^{2}\theta}{1 + a^{2} \tan^{2}\theta} } \] |

(a) Plot of apparent lengthening rate with respect to angular deviation of true lengthening direction from the apparent one observed in in-situ experiments of the 0.08 C at 773 K. (b) Schematic illustration of elliptic ferrite plate intersecting the specimen surface and (c) variation in the fraction of the apparent growth rate over the true growth rate. Aspect ratio, a, is taken to be the ratio of length against width.
We also examined the observed growth rates in Fig. 8 based on the carbon-diffusion controlled growth kinetics model which is an approximate version of the original Trivedi model9) deduced by Bosze and Trivedi35) with infinite boundary mobility. The lengthening rate, V, is given by the following equation:
| \[ V = \frac{9}{8\pi} \frac{D}{\rho} \Omega_{*}^{2} \] |
| \[ \Omega_{*} = \frac{\Omega_{0}}{1-\cfrac{2}{\pi} \Omega_{0} - \cfrac{1}{2\pi} \Omega_{0}^{2}}, \quad \Omega_{0} = \frac{x_{\gamma} - x_{0}}{x_{\gamma} - x_{\alpha}} \] |
| \[ \frac{1}{\rho} = \frac{3}{32} \Omega_{*} \cdot \frac{1}{\rho_{c}} \] |
| \[ \rho_{c} = \frac{\sigma}{-(\Delta G_{V} + \Delta G_{S})} \] |
| \[ D = \frac{1}{x_{\gamma} - x_{0}} \int_{x_{0}}^{x_\gamma} D'(x, T)dx \] |
Figure 14 shows variation of the apparent growth rate with temperature calculated for the alloys used by taking the reduction of the driving force due to the strain energy into account. The experimentally measured rates are also plotted for comparison. In the calculation, the interfacial energy is taken to be 0.2 J/m2, by following the analysis made by Simonen et al.6) Strain energy of 50 J/mol or 400 J/mol, were chosen for references, which are usually selected as required undercooling in discussion of the growth kinetics for carbon diffusion controlled Widmanstätten ferrite (with respect to Para Ae3) and diffusionless bainitic ferrite (with respect T0), respectively36). The growth rate calculated decreases with the increase of carbon content. When the strain energy is ignored, the growth rate first increases and decreases as the temperature decreases, resulting in the maximum between 723 K and 673 K. When the contribution of strain energy increases, the growth rate decreases. Its decrement is larger at higher transformation temperature obviously and the peak of growth rate shifts to lower temperature. Even though the projection effect discussed in the previous subsection, the largest lengthening rate in the scatters may well correspond to the growth nearly parallel to the observed plane. Thus, in most cases, it can be said that the calculation overestimates the growth rate when the strain energy is ignored. It was confirmed that increase in interfacial energy resulted in slower growth by the capillarity effect. Those results are consistent with the previous deduction6).

Comparison between the calculated and measured growth rates; (a) 0.08 C, (b) 0.23 C and (c) 0.4 C alloys, respectively. Energy values in the figure are strain energies taken into account.
For the 0.08 C and 0.23 C alloys (Figs. 14(a) and (b), respectively), it seems that reduction of constant strain energy up to 400 J/mol from the driving force can explain the range of observed growth rate and its decreasing trend with respect to the increase in temperature reasonably well. However, in the case of the 0.4 C alloy (Fig. 14(c)), the observed growth rate decreases as the temperature decreases. This change is opposite to that in the calculation. At lower temperature, plastic accommodation of transformation strain should become difficult due to higher strength of austenite as well as ferrite. Increase in carbon content also results in higher strength of austenite as well as the decrease in driving force. So strain energy contribution could be a source of retardation in the growth controlled by carbon diffusion.
An alternative source for slower growth is interfacial mobility. Simonen et al. analyzed the lengthening with limited supersaturation based on the concept of low mobility partly coherent interface6). Its effect was taken to be larger although its physical meaning was not clearly discussed. For ferrite growth with incoherent interface, effects of interfacial mobility have been discussed extensively as summarized in the paper by Gamsjäger et al.37) Its temperature dependence is given as follows,
| \[ M = M_{0} \exp \left( \frac{-Q}{RT} \right) \] |
The estimated mobility varies by several orders of magnitude, depending on researchers, but show consistency in terms of the same activation energy Q = 140 kJ/mol despite of a wide variety of the pre-exponential factor M0. The mobility will decrease with decrease of temperature. By changing the temperature from 773 K to 623 K, the mobility decreases by a factor of ~20. So the trend for the 0.4 C alloy can be also explained by the decrease in interfacial mobility. Instead, it becomes difficult to apply the same discussion in the case of lower carbon alloys.
Therefore, it is still necessary to consider some other effects. Since the recent 3DAP analysis38) showed that there is no clear segregation of Ni at the ferrite/austenite interface, it is difficult to introduce large contribution of solute drag effect in this case. One possibility, which may be worthwhile to explore, is the interfacial drag by carbon (‘Cottrell drag’) discussed by Schoen and Owen14). They analyzed the lengthening rate with this effect coupled with lattice resistance up to 50 kpsi (~340 MPa) against boundary migration and could deduce reasonably good estimations. In future, effects of multiple sources of dragging force at the interface and strain energy should be examined carefully.
Lengthening kinetics of bainitic ferrite was re-examined in Fe-C-9%Ni alloys by in-situ observation by taking anisotropic shape of ferrite. True lengthening rate along the surface plane was larger than most of apparent rate by a factor of ca. 4. Variant pairing of bainitic ferrite belonging to the same Bain group occurred at the pre-existing bainitic ferrite.