Abstract
In this study, the effect of sintering temperatures on fatigue crack propagation rates of sintered Ag nanoparticles were investigated. Paris’ law type fatigue crack propagation law between the fatigue crack propagation rate and the inelastic strain energy density range was found to hold at all test temperatures. The power exponent in the fatigue crack propagation law for the Ag nanoparticles sintered at 423 K was large and the fatigue crack propagation rate was fast with excessively brittle behavior. The stress and strain concentrations at neck parts interlinked with each other in damaged areas, in addition to the brittle grain boundary fractures, resulted in the excessively brittle behavior. On the other hand, the Ag nanoparticles sintered at 473 K showed more ductile behavior as pores decreases with sintering progression and the local strain concentrations were fewer compared to the Ag nanoparticles sintered at 423 K. However, with test temperature increasing, the grain boundary became viscous, so the power exponent in the fatigue crack propagation law and fatigue crack propagation rate at any sintering temperature decreased, causing only minor differences by sintering temperature in fatigue crack propagation rates.
1. Introduction
Next generation power modules with the incorporation of SiC and other wide-bandgap semiconductors are expected to operate at high temperatures.1–3) Using conventional solder alloys as die attach for power modules with presumably high operating temperatures would pose difficulties in light of thermal resistance. In view of the situation, sintering bonding with Ag nanoparticles is drawing attention;4,5) however, mechanical properties of the sintered Ag nanoparticles that are essential for evaluating the reliability have not been demonstrated yet. Qualitative assessments of mechanical properties of Ag nanoparticles have been performed mostly through shearing tests and temperature cyclic tests using specimens of bonded bodies to date. As for research of fundamental mechanical properties of sintered Ag nanoparticles, available investigational results are very limited because of difficulty conducting mechanical testing solely with sintered Ag nanoparticles.6,7) The author et al. have so far reported that sintered Ag particles starts to creep, which is controlled by grain boundary diffusion, at temperatures lower than 0.4Tm at which creep becomes problems in general.8,9) In this way, sintered Ag nanoparticles differ from bulk Ag in mechanical properties — thus more detailed investigations are required. Especially, as investigations of fatigue crack propagation which determines or influences the reliability of power modules are extremely scarce, its elucidation is desired. The author et al. have recently clarified that pressureless-sintered Ag nanoparticles have faster fatigue crack propagation than bulk Ag, with the exhibition of brittle characteristics.10) On the other hand, Ag nanoparticles have an advantage that sintering is feasible at a wide range of temperatures,11,12) which raises concern about the relationship between sintering temperature and the fatigue crack propagation rate. In this study, the fatigue crack propagation tests in Ag nanoparticles sintered at different temperatures were performed and the effects of sintering temperatures on fatigue crack propagation rate were investigated.
2. Experimental Procedure
2.1 Specimens
For fabrication of test specimens, Ag paste with an average grain diameter of 100 nm was used. The paste was pressureless-sintered under atmospheric environment to shape into a plate-like sintered body, which was then made into specimens for tensile testing and fatigue crack propagation testing. Sintering temperatures were 423 K and 473 K with 30 minutes of holding time at each sintering temperature. Figure 1 shows the initial microstructure of each sintered body. The sintered body of Ag nanoparticles has the microstructure containing numerous pores; the porosity is 29.6% at 423 K and 15.7% at 473 K. The porosities were calculated from representative cross sectional SEM images of the specimens.

The specimen for tensile testing was miniature-sized and machined from the planar sintered body as in Fig. 2 and subsequently the specimen surface was polished with SiC polishing papers (1200 grit→2400 grit→4000 grit). A miniature-sized SEN (Single-Edge Notched) specimen which shown in Fig. 3 was used for fatigue crack propagation testing. The specimen was also machined in a manner similar to the fabrication of the tensile test specimen. Notch was made by a precision wire saw with a diameter of 50 µm. And then, the specimen surface was polished by SiC polishing papers as for the tensile test specimen. Additional polishing with diamond particles (3 µm→1 µm) and colloidal silica suspension was given to the specimen surface to obtain a mirror-finished surface for observing fatigue cracks.
2.2 Tensile test
In this study, tensile testing was performed to obtain static mechanical properties of sintered Ag nanoparticles. And a mechanical test machine equipped with the actuator with a linear DC motor (Saginomiya: LMH207-10) was used for the test. The images of the test machine and the specimen fixing part are shown in Fig. 4. The nominal strain rate was 10−3/s and test temperature was 298 K and 413 K to not exceed the sintering temperatures. The specimens were heated by a ceramic heater set inside the specimen fixing jig. The specimen temperature was controlled during testing to maintain ±2 K from the set temperatures.
2.3 Fatigue crack propagation test
A fatigue test machine equipped with a piezo actuator having a displacement-enlarging mechanism (Saginomiya: LMH207-20) was used for the fatigue crack propagation testing. The images of the test machine and the specimen fixing part are shown in Fig. 5. The fatigue crack propagation test was conducted through fatigue test under the displacement controlled tensile-tensile mode. The control waveform was a symmetric triangular wave; strain rate was 10−3/s strain rate; the total displacement range was 4 to 8 µm; and test temperatures were two levels of 298 K and 413 K as in the tensile testing. Fatigue crack lengths were video-recorded through a microscope installed on the upper part of the test machine and measured at every given number of cycles. The specimen was heated by the ceramic heater fixed inside the specimen fixing jig as in the tensile test.
2.4 Evaluation of fatigue crack propagation rate
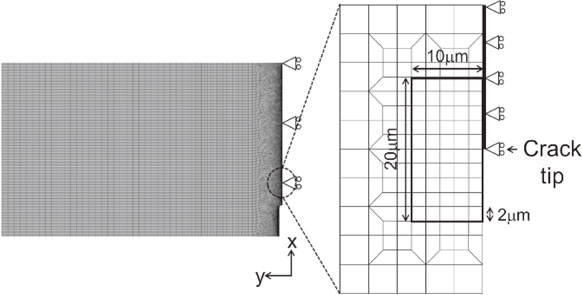
In recent years, FEM analysis method has proactively been used for assessing reliability of electronic devices; it is desirable that the results of fatigue crack propagation testing be utilized for analysis of power module reliability through FEM analysis. In fracture mechanics, the cyclic J-integral, ΔJ, having the property of path independent is used for assessing fatigue crack propagation rate in the loading conditions beyond small scale yielding. However, with unavailability of universal methods for computing ΔJ by general purpose FEM code, assessment of fatigue crack propagation rates by adopting scalar parameters instead of ΔJ is demanded. Under the situation, inelastic strain energy density range, ΔWin, around fatigue crack tip as scalar parameters as an alternate to ΔJ is now under discussion.13,14) This procedure has several points to note such as mesh sizes of FEM models and dependence of ΔWin on acquired range, while the computation of ΔWin by FEM is relatively easy, rendering the scalar parameter a promising means as an alternate to ΔJ. In this study, the technique to use ΔWin as a parameter in assessing the fatigue crack propagation rate was employed. The FEM analysis model is symmetrical with 1/2 size of the specimen shown in Fig. 6; models were created for every predetermined fatigue crack length to compute ΔWin. The area of 20 µm × 10 µm around the crack tip was divided into square elements with 2 µm/side. Then an assumption was made that the average of ΔWin in the area represents the mechanical environment of the damage progressing area. The average inelastic strain energy density range of the elements in the area was normalized by the volume of the elements as shown in eq. (1).
| \begin{equation}
\Delta W_{\text{in}} = \frac{\displaystyle\sum \Delta W_{\text{in}}^{\text{element}} \cdot V^{\text{element}}}{\displaystyle\sum V^{\text{element}}}
\end{equation}
| (1) |
Where Δ
Win is the average of the inelastic strain energy density range Δ
Winelement is the element solution of inelastic strain energy density range in each element,
Velement is the volume of each element. Element type was quadrilateral eight-node plane stress element. The solver was a general purpose code ANSYS ver. 17.2. For a two-dimensional problem, however, the solver gives volume of each element in its post-processing by assuming a unit thickness. Each of the sintered Ag nanoparticles was treated as an elasto-plastic body and the nonlinear kinematic hardening law (Chaboche model) in
eq. (2) was used for plastic hardening law.
| \begin{equation}
\dot{\chi}_{\text{i}} = \frac{2}{3}\sum_{i = 1}^{n}A_{1} \dot{\varepsilon}_{\text{p}} - A_{2}\chi_{\text{i}}\dot{p}
\end{equation}
| (2) |
Where
$\dot{\chi }_{\text{i}}$ is the back stress rate,
$\dot{\varepsilon }_{\text{p}}$ is the inelastic strain rate, χ
i is the back stress,
$\dot{p}$ is the accumulated inelastic strain rate, and
A1 and
A2 are the material constants. Material properties used for the analysis were determined by inverse analysis based on the stress-strain curves obtained from the tensile test results in a way that enables the load-displacement hysteresis loop obtained from each of the fatigue crack propagation tests to be reproduced. One example of material constants for the Chaboche model is presented in
Table 1.

Table 1
One example of material constants for the Chaboche model.
The microstructures of the specimens were observed by Field-Emission Scanning Electron Microscope (FE-SEM). The specimen surface was polished by Ar ion sputtering prior to the FE-SEM observation.
3. Results
3.1 Static properties
Figure 7 shows the stress-strain curves of sintered Ag nanoparticles at each test temperature. Table 2 shows typical static properties obtained. The stress-strain curves of sintered Ag nanoparticles were strongly dependent on test temperatures regardless of sintering temperatures. Strong strain hardening and severe brittleness were exhibited at 298 K. Young’s modulus of sintered Ag particles was significantly lower than that of bulk Ag (82.7 GPa).15) Moreover, the fracture strain in any of the test conditions was below 3% which is translated as being extremely brittle. At 413 K, on the other hand, strength decreased significantly at any sintering temperature, exhibiting the creep behavior which does not show strain hardening. Fracture ductility improved at 413 K compared with at 298 K. However, sintered Ag nanoparticles are still brittle compared with other bulk metals. While Young’s modulus and 0.1% proof stress increased with an increase in sintering temperature, no changes took place in brittleness and in creep behavior at 413 K. The Young’s modulus lower than in bulk Ag and the creep deformation at relatively low temperature — these are mechanical properties peculiar to sintered Ag nanoparticles, about which report has been made previously by authors.8) These properties are attributable to brittle grain boundaries formed by sintering and atomic diffusion within the grain boundaries.8)


Table 2
Static properties of sintered Ag nanoparticles.
Figures 8 and 9 give the relationship between the number of cycles N and fatigue crack length a at individual test temperature of the specimens sintered individually at 423 K and 473 K. In the experiment in this study, carried out under displacement control, there was little change in the strain energy across the fatigue crack tip during the fatigue experiment and the form of the fatigue crack propagation curve was nearly linear in any test condition. Therefore, the fatigue crack propagation rate was determined by the linear approximation calculation. And in either of the sintered bodies and at any test temperature, the rate of fatigue crack propagation showed a tendency to increase with an increase in displacement range.
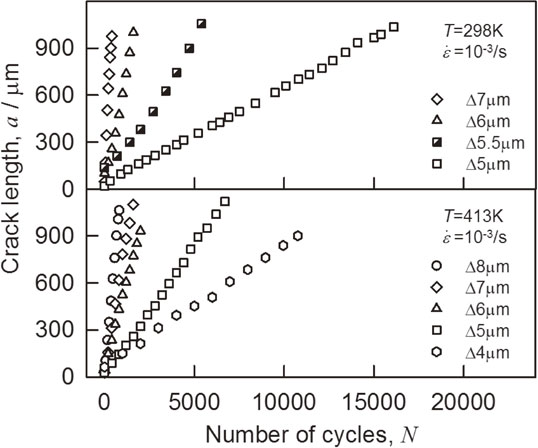
Figure 10 shows the relationship between fatigue crack propagation rate at each test temperature and ΔWin. The upper part of the figure is the result gained from the specimen sintered at 423 K and the lower part is the result from the specimen sintered at 473 K. At any of the test temperatures, a power relation was found between fatigue crack propagation rate and ΔWin and the relation obeyed eq. (3) which is Paris’ law type fatigue crack propagation law.
| \begin{equation}
\frac{da}{dN} = C_{1}\Delta W_{\text{in}}{}^{C_{2}}
\end{equation}
| (3) |
Where
da/
dN is the fatigue crack propagation rate, and
C1 and
C2 are the material constants. Material constants for fatigue crack propagation law at individual test temperatures are shown in
Table 3. The power exponent
C2 — which indicates the sensitivity of Δ
Win to fatigue crack propagation rate — was 5.6 to 2.1. In the case of fatigue crack propagation in solder alloys or in steel materials, the power exponent to Δ
J becomes 1.0–2.0.
16–18) Although Δ
Win is not equivalent to Δ
J, the power exponent of sintered Ag nanoparticles was found to be very high, especially at 298 K. Sintered Ag nanoparticles are brittle as described above, which in turn may have caused fatigue crack propagation rate to become extremely sensitive to the changes in Δ
Win, compared to bulk metals.
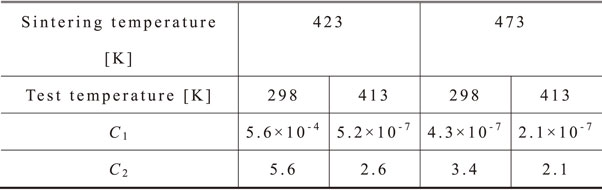
Table 3
Material constants for fatigue crack propagation law of sintered Ag nanoparticles for each condition.
A close look at sintering temperatures leads to the results that power exponent C2 and fatigue crack propagation rate decreased with an increase in sintering temperature, indicating that with an increase in sintering temperature, the strain energy absorbing capacity at the crack tip improved and fatigue crack propagation resistance increased. When a focus is placed on test temperatures, the power exponent C2 and fatigue crack propagation rate decreased and fatigue crack propagation resistance increased with increasing test temperature in any sintered bodies. This is contrary to the general tendency in relation to fatigue of metal materials. The changes in exponent C2 and fatigue crack propagation rate with increasing test temperature were marked in the specimen sintered at 423 K, whereas the specimen sintered at 473 K underwent practically few changes. When sintering temperature was raised, the effects of test temperature on fatigue crack propagation rate became reduced. And it was found that at 413 K test temperature, there were minor effects of sintering temperature on fatigue crack propagation properties. Unlike the published report that the law of fatigue crack propagation in solder alloys is less vulnerable to the effects of test temperature,19) the fatigue crack propagation law in sintered Ag nanoparticles was found to be heavily affected by test temperature.
3.3 Influence of element size and strain energy acquisition on strain energy density
Unlike J-integral having the property of path independence, inelastic strain energy density Win used in this study is dependent on the element size in FEM model and the acquired area of Win. Thus, alterations were made to the element size around crack tip to 2–20 µm and to the length of each side of the acquired area to 10–100 µm in order to investigate the effects of element size and acquired area size on the inelastic strain energy density. For FEM analysis, the material constant at 413 K for Ag nanoparticles sintered at 473 K was used to calculate Win by applying an average tensile load in the study. As in eq. (1), Win of the elements in the area was normalized by the volume of the elements. Figure 11 shows the relationship between element size and length of a side of the acquired area of Win. A power law was established between L the length of a side of the acquired area and Win and the exponent was −1. Thus, Win is inversely proportional to the length L. The HRR singularity field is formed at the distance sufficiently close to the crack tip, in which region stress and strain are proportional to (J/r)1/(n+1) and (J/r)n/(n+1), respectively.20,21) Here, r is the distance from the crack tip; J is the J-integral; and n is the strain hardening exponent. As the inelastic strain energy density given by integrating stress with inelastic strain is inversely proportional to the distance r from crack tip,20) an average of inelastic strain energy density in the area surrounding the crack is inversely proportional to the length of a side of the area regardless of the material properties. And in the models with different element sizes, differences in Win are minor, from which it is clear that Win becomes mostly independent on the element sizes by way of finding the mean of the element solutions of inelastic strain energy density in the area surrounding the crack tip. Thus, it is also discovered that the use of the average of inelastic strain energy density in the area where the HRR singularity field forms allows the correction of Win by the length of a side of the acquired area regardless of element sizes even between different models.

4. Discussion
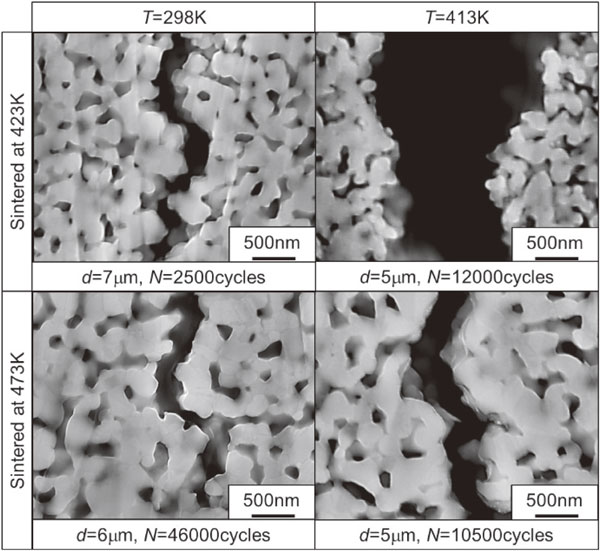
Figure 12 shows SEM micrographs of individual fatigue crack propagation paths at each test temperature in representative test conditions. Compared the initial structures shown in shown Fig. 1, neither post-test microstructural coarsening nor sintering progressions caused by increasing test temperature were observed. Fatigue crack propagated along the grain boundary formed by sintering regardless of test temperatures. The grain boundary fracture was the dominant mechanism of fatigue crack propagation in sintered Ag nanoparticles. It is generally known that deformation and fracture are dominated by the grain boundary property in crystalline materials with a grain size more or less 100 nm.22) In sintered Ag nanoparticles, the grain boundaries formed by sintering are characterized as being brittle,9) and fatigue cracks propagate along the brittle grain boundaries. This brittleness of grain boundaries can be explained by the fracture strain being not greater than 10% in the tensile testing. Therefore, the fatigue crack propagation rate of sintered Ag nanoparticles possibly became sensitive to increasing or decreasing strain energy in any test condition compared to solder alloys. However, it is not known why the fatigue crack propagation rate decreased with an increase in sintering temperature and test temperature although the mechanism of fatigue crack propagation was same whatever the test conditions.
First, a close look at changes in static material properties associated with increasing sintering temperature reveals that the elastic modulus, 0.1% proof stress, and fracture strain increased with an increase in sintering temperature. As shown in Fig. 1, the grain size increased with increasing sintering temperature. According to the Hall-Petch law,23,24) material strength should decrease with an increase in grain size. However, the strength increased in the study. Sintering progresses as atoms transport into the neck part where particles join each other.25) In the specimen sintered at high temperature, more atoms presumably flowed into the brittle grain boundary, in addition to decreasing porosity by progress sintering, improving the quality of the grain boundary resulting in its increased strength. If grain boundary fracture governs fatigue crack propagation, increased grain boundary strength become resistance to fatigue crack propagation — in this way, in sintered Ag nanoparticles the fatigue crack propagation rate seems to have decreased with an increase in sintering temperature.
When test temperatures are carefully examined, stress-strain curves in any of the sintered bodies showed strong temperature dependence as shown in Fig. 7. This was caused by the grain boundary diffusion controlled creep specific to sintered Ag nanoparticles starting at temperatures lower than the empirical rule for creep deformation in metals (0.4Tm).8) As test temperature increases, the grain boundaries formed by sintering become viscous because of the creep being the grain boundary diffusion controlled. Figure 13 shows SEM micrographs of the specimen sintered at 423 K subjected to 4% tensile strain at 413 K. When deformation was applied to sintered Ag nanoparticles at the test temperature of 413 K, viscous grain boundary deformation was observed as shown in Fig. 13. The behavior of such viscous deformation of grain boundary had been observed in the past researches by the author et al.8) The ability of absorbing strain energy at fatigue crack tips increases by the grain boundary where fatigue crack propagation progresses becoming viscous with an increase in temperature. Therefore, power exponent C2 of fatigue crack propagation law and fatigue crack propagation rate in sintered Ag nanoparticles seemed to have decreased with an increase in test temperature.

As mentioned above, although a qualitative relationship was observed between temperature dependence of fatigue crack propagation behavior and static mechanical properties, there are no static properties found yet that can quantitatively explain fatigue crack propagation behavior. This may be due to the pore-containing microstructure of the sintered Ag nanoparticle and the influence of this microstructure on the fatigue crack propagation behavior. Thus, micro-scale FEM models were created with reproduction of the internal structures of individual sintered bodies to analyze the relationship between deformation behavior in the damaged area near fatigue crack tip and microstructure. Figure 14 shows micro-scale FEM models with the reproduced internal structure of each of the sintered bodies. These models were created by providing element divisions to 3D solid models which were made in the manner of connecting together cross-sectional images of each specimen captured every 20 nm interval by FIB-SEM (Focused ion beam-scanning electron microscope). The element type was 10-node tetrahedral elements. The model scale was about 600,000 nodes for each sintered body. In the FEM model shown in Fig. 6, the displacement in the axial direction at the element 20 µm ahead of a crack tip at the time when an average ΔWin (0.4 MJ/m3) emerges in this study is computed and the computed displacement was given to the micro-scale FEM models. The plastic constitutive equation was Chaboche model and the material constants were determined by inverse analysis so as to reproduce the stress-strain curves shown in Fig. 7.

Figures 15 and 16 show the contour figures of equivalent stress and equivalent inelastic strain obtained in each condition. Stress on the low temperature side and strain on the high temperature side were dominant over inelastic strain energy. In the specimen sintered at 423 K, it was found that stress and strain are concentrated and the concentrations are interlinked with each other in the neck regions abundantly present across the entire area of the model due to the porous microstructure of the specimen. As described above, brittle grain boundaries formed by sintering exist in the neck region, along which fatigue cracks propagate. In the specimen sintered at 423 K, the strain concentrations that are interlinked with each other accelerate fatigue crack propagation in the damaged area, which gains brittle fatigue crack propagation. As a result, power exponent C2 is considered to have become extremely large at the 298 K test temperature. However, when the test temperature was elevated to 413 K, the brittle grain boundaries became viscous, allowing the strains concentrated in the neck region to be absorbed in the grain boundaries — which seems to be the cause of substantial decreases in the power exponent C2 and the fatigue crack propagation rate in the specimen sintered at 423 K. For the reason, in the 413 K test temperature, the fatigue crack propagation rate in the specimen sintered at 423 K became close to the characteristics of the specimen sintered at 473 K. On the other hand, in the specimen sintered at 473 K, pores decreased with sintering progression and the local strain concentrations were fewer than those in the specimen sintered at 423 K with fewer interlinks of strain concentrations; exponent C2 and fatigue crack propagation rate were lower compared to the specimen sintered at 423 K, causing the fatigue crack propagation behavior to become more ductile.

5. Conclusions
-
1)
In sintered Ag nanoparticles, Paris law type fatigue crack propagation law between the fatigue crack propagation rate and the inelastic strain energy density range was found to hold at each test temperature.
-
2)
In the specimen sintered at 423 K, the power exponent of the fatigue crack propagation law was large; the fatigue crack propagation rate was fast; and extremely brittle behavior was exhibited. On the other hand, when sintering temperature was raised to 473 K, the power exponent and fatigue crack propagation rate decreased and fatigue crack propagation behavior became more ductile.
-
3)
The interlinking of the stress and strain concentrations existing in the numerous neck regions in the damaged area in addition to brittle characteristics of grain boundaries accelerated the fatigue crack propagation rate, which caused the brittle fatigue crack propagation behavior of the specimen sintered at 423 K.
-
4)
In the specimen sintered at 473 K, as pores decreased with sintering progression, local strain concentrations were fewer compared to the specimen sintered at 423 K — which seems the cause of fatigue crack propagation behavior becoming more ductile.
-
5)
With increasing test temperature, the grain boundaries became viscous and the power exponent in the fatigue crack propagation law and fatigue crack propagation rate decreased at any sintering temperature. As the viscous characteristics of the grain boundaries reduced the effect of strain concentration in the neck region, the decrease in fatigue crack propagation rate with increasing test temperature in the specimen sintered at 423 K was significant and the characteristics became close to those of the specimen sintered at 473 K.
Acknowledgments
This research was supported by the Japan Society for the Promotion of Science (JSPS) KAKENHI (Grant No. JP17K06843).
REFERENCES
- 1) R. Singh: J. Microel. Rel. 46 (2006) 713–730.
- 2) J.B. Casady and R.W. Johnson: J. Sol. St. Elec. 39 (1996) 1409–1422.
- 3) M. Ostling, R. Ghandi and C.M. Zetterling: Proc. of 23rd ISPSD & IC’s, (2011) 10–15.
- 4) J.G. Bai, J. Yin, Z. Zhang, G.Q. Lu and J.D. van Wyk: IEEE Trans. Adv. Packag. 30 (2007) 506–510.
- 5) T. Wang, X. Chen, G.Q. Lu and G.Y. Lei: J. Electron. Mater. 36 (2007) 1333–1340.
- 6) R. Kisiel and Z. Szczepanski: J. Microel. Rel. 49 (2009) 627–629.
- 7) F. Le Henaff, S. Azzoparidi, J.Y. Deletage, E. Woirgard, S. Bontemps and J. Joguet: J. Microel. Rel. 52 (2012) 2321–2325.
- 8) R. Shioda, Y. Kariya, N. Mizumura and K. Sasaki: J. Smart Processing. 5 (2016) 259–265.
- 9) Y. Kariya, H. Yamaguchi, M. Itako, N. Mizumura and K. Sasaki: J. Smart Processing. 2 (2013) 160–165.
- 10) R. Shioda, Y. Kariya, N. Mizumura and K. Sasaki: J. Electron. Mater. 46 (2017) 1155–1162.
- 11) Y. Akada, H. Tatsumi, T. Yamaguchi, A. Hirose, T. Morita and E. Ide: J. Mat. Trans. 49 (2008) 1537–1545.
- 12) H. Alarifi, A. Hu, M. Yavuz and Y.N. Zhou: J. Elec. Mater. 40 (2011) 1394–1402.
- 13) J.H. Lau, S.H. Pan and C. Chang: J. Elec. Pack. 124 (2002) 212–220.
- 14) R. Darveaux: Proc. of 50th Electronic Components & Technology Conference, (2000) pp. 1048–1058.
- 15) E.A. Brandes: Smithells Metals Reference Book, six ed., (Butterworths, England, 1983) p. 15-3.
- 16) C. Kanchanomai, Y. Miyashita and Y. Mutoh: J. Electron. Mater. 31 (2002) 142–151.
- 17) J. Zhao, Y. Mutoh, Y. Miyashita and L. Wang: J. Eng. Fract. Mech. 70 (2003) 2187–2197.
- 18) M. Okazaki and T. Koizumi: J. Metall. Mat. Trans. A 14 (1983) 1641–1648.
- 19) M. Taniguchi and Y. Kariya: J. Mater Trans. 57 (2016) 853–859.
- 20) J.W. Hutchinson: J. Mech. Phys. Solids 16 (1968) 13–31.
- 21) J.R. Rice and G.F. Rosengren: J. Mech. Phys. Solids 16 (1968) 1–12.
- 22) S. Cheng, J.A. Spencer and W.W. Milligan: J. Acta Mater. 51 (2003) 4505–4518.
- 23) E.O. Hall: Proc. Phys. Soc. London. B 64 (1951) 747–753.
- 24) N.J. Petch: J. Iron Steel Inst. 174 (1953) 25–28.
- 25) M.F. Ashby: J. Acta Mater. 22 (1974) 275–289.