Abstract
The room-temperature fracture toughness of ZrC-added Mo–Si–B alloys prepared using an arc-melting technique was investigated. The constituent phases of the heat-treated alloys were mainly molybdenum solid solution (Moss), Mo5SiB2 (T2), and ZrC, with a small amount of Mo2B in a few alloys. Four-point bending tests with a Chevron-notch were performed, and the average fracture-toughness values ranged from 12.4 to 20.3 MPa(m)1/2 depending on alloy composition. Here, the effects of the volume fractions of the constituent phases and the continuity of Moss on the fracture toughness are discussed. The fracture toughness improved with an increase in the volume fractions of the Moss and ZrC phases. Alloys with a higher Moss continuity exhibited higher fracture toughness, for example, the fracture toughness of 64.5Mo–3.2Si–6.5B–12.9Zr–12.9C (mol.%) was 19 MPa(m)1/2; the alloy contained a >95%-continuous Moss phase, even though it also contained 16 vol.% T2 and 23 vol.% ZrC.
1. Introduction
The development of ultrahigh-temperature materials (UHTMs) beyond Ni-based superalloys is essential for use in high-pressure turbine blades in gas turbines and jet engines to improve their energy efficiency.1,2) Mo–Si–B-based alloys have been developed for more than two decades because of their high melting points and good high-temperature strength3–8) provided by strengthening silicide phases9) such as Mo3Si, Mo5Si3,10,11) and Mo5SiB2, known as T2.12,13) Multiphase Mo–Si–B ternary alloys have the components of the molybdenum solid solution (Moss)–T2–Mo3Si or T2–Mo3Si–Mo5Si3 ternary phase region14,15) since good room-temperature fracture toughness is provided by the ductile Moss phase in the former region16–21) and good oxidation resistance is provided by the B-doped silicide phases in the later region.22–26) Recently, there has been great interest in the Moss–T2–M5Si3 (M = Mo or Ti) three-phase region, which can be extended by the addition of a fourth element1,27) such as W28,29) or Ti,30–34) to combine good high-temperature strength, room-temperature fracture toughness, and oxidation resistance. However, despite the fact that the silicides are key phases for high-temperature strengthening and oxidation resistance, they impair the room-temperature fracture toughness of the alloys; the room-temperature fracture-toughness values of Mo3Si, Mo5Si3, T2, and Ti5Si3 are reported to be 2–4,35) 2–2.5,36) 1.5–3.5,37,38) and 2.1–3.239,40) MPa(m)1/2, respectively. This trade-off relationship has discouraged their structural applications. In order to overcome this drawback, it is critical to effectively enhance ductile-phase toughening41) by Moss in alloy design.
Quite recently, our research group reported an improvement in the fracture toughness of Mo–Si–B alloys by adding TiC42–47) and ZrC48) without impairing the high-temperature strength. Furthermore, by the addition of the lightweight carbides, the density was reduced to a value comparable to that of Ni-based SX superalloys.49) However, the toughening mechanism due to the brittle TiC and ZrC phases despite their brittle nature has not been clarified yet. The room-temperature fracture toughness of Mo–Si–B-based alloys was reviewed by Lemberg and Ritchie.50) Subsequently, Kruzic et al.19,20) claimed that the volume fraction of Moss and its continuity were critical factors to achieve high fracture toughness. Moriyama et al.47) pointed out that the volume fraction of not only Moss but also TiC plays an important role in the toughening of TiC-added Mo–Si–B alloys. However, while the relationship between the volume fractions of the constituent phases and the room-temperature fracture toughness was studied for ZrC-added Mo–Si–B alloys in our previous study,48) the toughness values were not interpreted simply through the volume fractions of the Moss and ZrC phases. The toughening mechanism provided by the brittle ZrC, where the fracture toughness of the single phase was reported to be 1.051) or ∼4.052) MPa(m)1/2, is still unclear. Similarly, the fracture-toughness values of Mo–ZrC alloys reported by Suzuki et al.53,54) were also not interpreted from the standpoint of the volume fractions of Moss and ZrC, even though they consisted of only the two Moss and ZrC phases. The alloys having the nominal compositions of Mo–16, 30, and 40 mol.% ZrC had the fracture-toughness values of 13, 15, and 14 MPa(m)1/2, respectively. Direct comparison of the fracture-toughness values of the ZrC-added Mo–Si–B alloys with those of the Mo–ZrC alloys should be avoided since the evaluation methods are different; however, it is clear that the brittle ZrC phase helped in toughening the alloys.
Therefore, in this study, the relationship between the microstructure and the room-temperature fracture toughness was systematically investigated for a series of ZrC-added Mo–Si–B alloys with nine different compositions. In addition to the effect of the volume fractions of the constituent phases, as addressed in our previous study,47,48) the Moss continuity in the microstructure is evaluated by percolation analysis, and its importance is discussed for the improvement of the fracture toughness in Mo–Si–B-based alloys. Moreover, the effects of the toughening factors in ZrC-added Mo–Si–B alloys on the room-temperature fracture toughness are quantitatively discussed.
2. Experimental Procedure
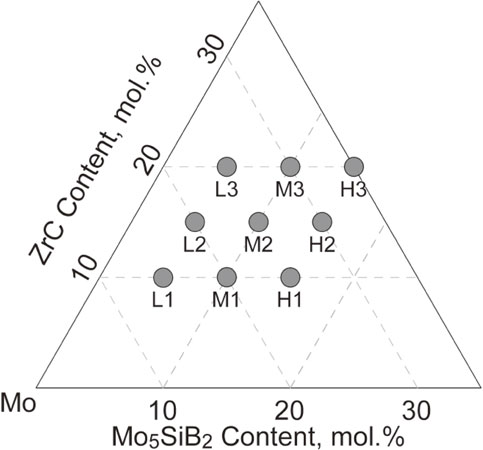
Nine ZrC-added Mo–Si–B alloys with the nominal compositions shown in Table 1 were prepared using a conventional arc-melting technique in an Ar atmosphere. The nominal compositions were controlled so that the ratios of Si/B and Zr/C were kept at 0.5 and 1, respectively. The compositions plotted on the Mo–Mo5SiB2–ZrC pseudo-ternary compositional diagram are shown in Fig. 1. Here, ZrC-added Mo–Si–B alloys containing low amounts of Si and B are referred to as Series L, while alloys containing medium and high amounts of Si and B are referred to as Series M and H, respectively. Moreover, alloys containing low, medium, and high amounts of Zr and C are referred to as Series 1, 2, and 3, respectively. Thus, Alloy L1 has low Si, B, Zr, and C concentrations, while Alloy H3 has high concentrations of these elements. Note that Alloys L1, L2, L3, M1, M2, H1, and H2 are the same as Alloys 1, 2, 3, 4, 5, 6, and 7 reported in our previous study.48) Button ingots that were ∼90 g in weight and ∼45 mm in diameter were cast using pure Mo, Si, B, and ZrC of 99.99, 99.9999, 99.5, and 95 mass% purity. The ingots were heat-treated at 1800°C for 24 h in an Ar atmosphere for homogenization. The chemical compositions of the heat-treated alloys, also listed in Table 1, were determined using inductively-coupled plasma-atomic emission spectroscopy (ICP-AES).
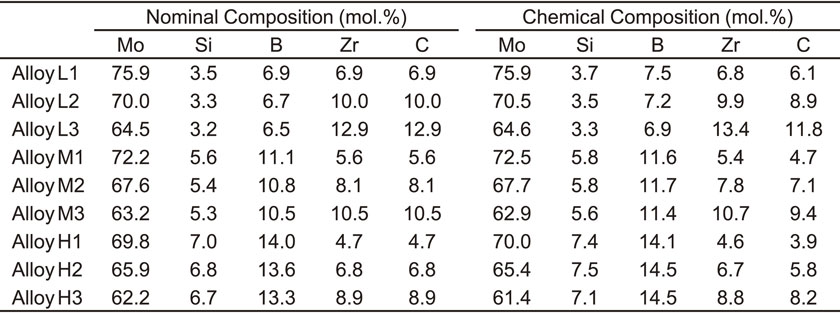
Table 1
Nominal and chemical compositions of the ZrC-added Mo–Si–B alloys used in this study.
Microstructure observations and phase identification were carried out using X-ray diffractometry (XRD), scanning electron microscopy (SEM) in both secondary electron (SE) and backscattered electron (BSE) modes, and SEM with energy-dispersive X-ray spectrometry (EDS). Moreover, the microstructures of the heat-treated alloys were characterized by electron backscatter diffraction (EBSD)-orientation imaging microscopy (OIM) over a 500 µm × 500 µm area in 0.5 µm steps around the central region of the ingots. The EBSD-OIM images were binarized and further analyzed using the open software program ImageJ.
To estimate the room-temperature fracture-toughness values using four-point bending tests, the elastic parameters of the heat-treated alloys were measured at room temperature using the electromagnetic acoustic resonance (EMAR) method,55,56) with specimens of about 4 × 4 × 5 mm3 in size. The density of the alloys, as measured by the Archimedes’ principle, was used for the EMAR analysis.
The Chevron-notched four-point bending specimens had final dimensions of 1.5 ± 0.05 mm (w) × 2.0 ± 0.05 mm (h) × 25 mm (l) after polishing with sandpapers to #400. Chevron notches were machined by electro-discharge machining with a brass wire of 0.1 mm in diameter. The shape of the Chevron notch is described elsewhere as Test-2.47) Four-point bending tests were conducted three times for each alloy at room temperature with a crosshead speed of 0.3 µm·s−1 (strain rate of 1.5 × 10⁻⁴ s−1) using an Instron 5982. The fracture toughness, KQ, was evaluated based on the Irwin’s similarity relationship,47) KQ = (GE′)1/2, where G is the strain-energy release rate calculated by dividing the area of the load-displacement curve U by the projected notch area A, and E′ is the plane-strain Young’s modulus calculated by dividing the Young’s modulus E by (1 − ν2), where ν is the Poisson’s ratio.
3. Results
3.1 Microstructure of as-cast alloys
Figure 2 shows the microstructures of as-cast Alloys L1, L2, L3, M3, and H3, observed using SEM in BSE mode. The constituent phases, labeled in the figures, were identified in the same way as in our previous study,48) that is, from XRD profiles, compositional contrasts of the BSE images, and elemental concentrations semi-qualitatively obtained by EDS. The Zr and C contents in the alloys increased from Alloy L1 to L3 at almost the same amount of Si and B. Coarse dendritic Moss was observed as the primary phase in Alloy L1 because of the relatively higher Mo content. In contrast, dendritic ZrC was observed as the primary phase in Alloy L2 and L3 as a result of the higher Zr and C contents. In these alloys, the Moss+ZrC eutectic was observed, regardless of the Zr and C contents. Therefore, it was found that Zr and C addition to the Mo–Si–B alloys enhanced the preferable formation of the Moss+ZrC eutectic and the formation of primary ZrC in addition to that of Moss+ZrC at higher Zr and C contents.

Alloys L3, M3, and H3 (which had the highest amounts of Zr and C in their respective series) are listed in the order of increasing Si and B contents. Primary ZrC was observed in all the alloys. The volume fractions of Mo2B, T2, and/or Mo3Si increased with increasing Si and B contents, whereas the volume fraction of Moss decreased. Although the microstructures of other alloys are omitted in this paper, the formation of the Moss+ZrC eutectic was confirmed in all the alloys employed in our study.
3.2 Microstructure of heat-treated alloys
Figure 3 shows the microstructures of the heat-treated Alloys L1, L2, L3, M3, and H3, as observed by SEM in BSE mode. Mo2B and/or Mo3Si in the as-cast alloys transformed into Moss and T2 by the heat treatment. As a result, some of the Mo2B and all of the Mo3Si disappeared in the Series-L alloys, which then consisted of four phases: Moss, T2, ZrC, and Mo2B. Meanwhile, all of the Mo2B and Mo3Si disappeared in the Series-M and -H alloys, which thus consisted of three phases, Moss, T2, and ZrC.
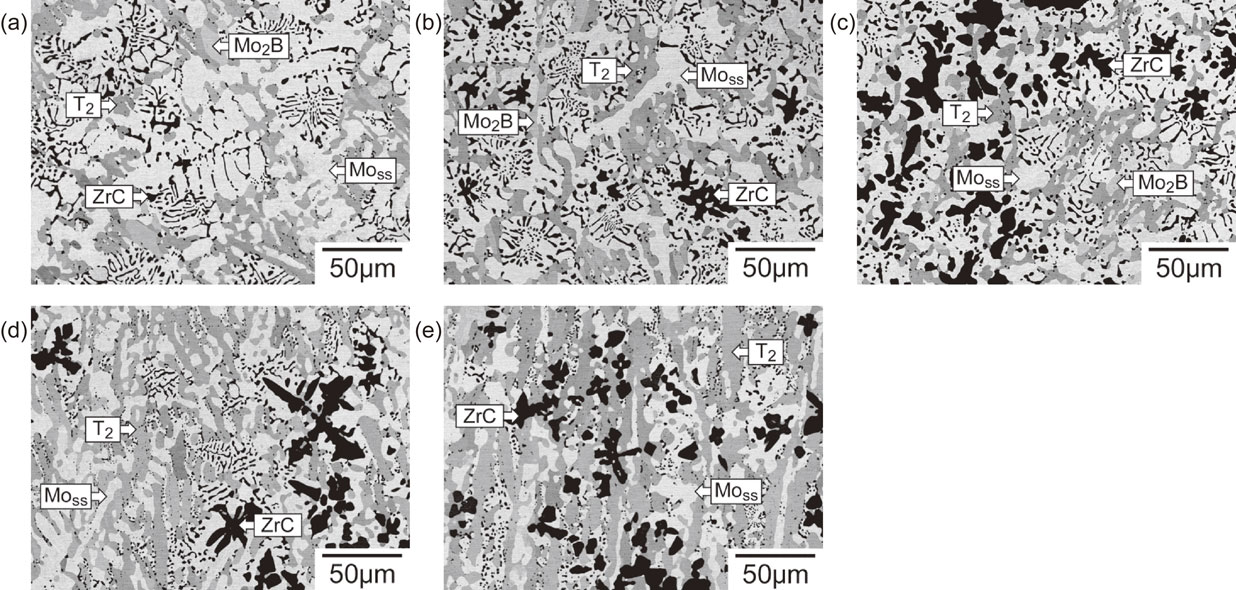
In the Series-L alloys, Moss became coarser and interconnected. ZrC in the primary phase and in the Moss+ZrC eutectic areas hardly changed and appeared to maintain the same size and morphology. Accordingly, the microstructures of the Series-L alloys included continuous Moss and dispersed ZrC, T2, and Mo2B. In Alloy M3 (with higher Si and B contents than those in the Series-L alloys), the coarsening, and thereby, the connection of T2 often appeared to accompany the decomposition of Mo3Si and Mo2B; as a result, the elongation of the T2 phase regions was evident. Moss did not connect as much as in the Series-L alloys, and Moss dispersions were frequently observed. Therefore, the microstructure of Alloy M3 consisted of semi-continuous Moss, semi-continuous T2, and dispersed ZrC. In Alloy H3, the volume fraction of T2 increased further. Compared with Alloy M3, T2 in Alloy H3 was considerably coarser and connected, while Moss was separated by the regions of T2. Therefore, the microstructure of Alloy H3 consisted of continuous T2 and dispersed Moss and ZrC.
Table 2 lists the volume fractions of the constituent phases obtained from EBSD-OIM, the densities obtained by the Archimedes’ principle, and the elastic parameters obtained using the EMAR method. The volume fractions were slightly different from those presented in our previous study.48) Because of the low microstructure homogeneity, the measured area was made wider (500 µm × 500 µm) in this study. This accounts for the volume fraction differences from our previous study. As mentioned above, the Series-L alloys consisted of four phases, although the volume fraction of Mo2B was less than 5%. The volume fraction of T2 was 15–18%, 36–38%, and 46–50% for the Series-L, -M, and -H alloys. The T2 volume fraction was similar for all the alloys within each individual series (L, M and H, respectively), and it clearly increased with the Si and B contents. Similarly, the volume fraction of ZrC increased with the Zr and C contents. The increase in the T2 and/or ZrC volume fractions led to an increase in the Young’s and shear moduli, but a decrease in the density and the Poisson’s ratio.

Table 2
Volume fractions of the constituent phases, density, and elastic parameters of the ZrC-added Mo–Si–B alloys heat-treated at 1800°C for 24 h.
Figure 4 shows the room-temperature fracture-toughness values of the heat-treated alloys measured by the four-point bending tests using the Chevron-notched specimens and calculated using the Irwin’s similarity relationship. The average fracture-toughness values were 18–20, 16–17, and 12–14 MPa(m)1/2 for the Series-L, -M, and -H alloys, respectively. The fracture toughness decreased from the Series L to H but was similar within the same alloy series. In other words, the room-temperature fracture toughness of ZrC-added Mo–Si–B alloys is strongly dependent on the T2 volume fraction and less dependent on the ZrC volume fraction.

Figure 5 shows representative transgranular cleavage surfaces of Moss, T2, ZrC, and the region around the Moss/ZrC interfaces, as observed by SEM in both the SE and BSE modes at the same locations. The Moss phase showed intensive river patterns on its cleavage surfaces, indicating that it underwent plastic deformation during crack propagation, and consequently worked to toughen the alloys through the ductile-phase toughening mechanism.41) The T2 phase showed smooth cleavage surfaces, implying that cracks propagated easily in the T2 phase. Hence, it is clear that the T2 phase did not help increasing in the fracture toughness of the alloys. Although ZrC is a ceramic phase, river patterns were also observed on its cleavage surfaces. Moreover, river patterns crossing through the Moss and ZrC interfaces were often observed, as marked by the white triangles in Figs. 5(g) and (h). Therefore, it is strongly suggested that ZrC plays a role in toughening the ZrC-added Mo–Si–B alloys, similar to TiC in TiC-added Mo–Si–B alloys.47)

4. Discussion
4.1 Effect of the volume fractions of constituent phases on the room-temperature fracture toughness
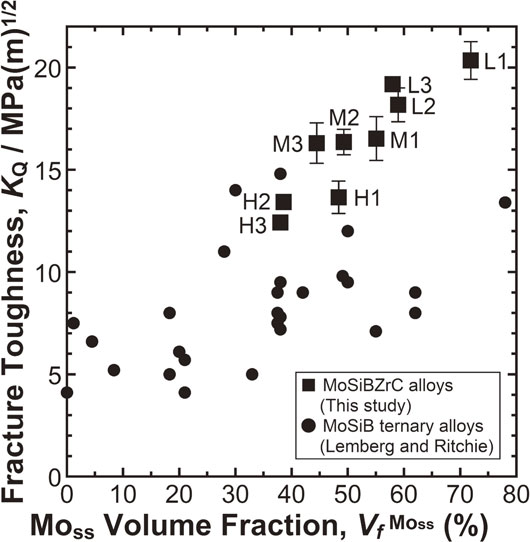
Lemberg and Ritchie50) pointed out that one of the important factors for toughening Mo–Si–B-based alloys is the volume fraction of the ductile Moss phase. Thus, the fracture-toughness values of the ZrC-added Mo–Si–B alloys obtained in the present study were plotted as a function of the Moss volume fraction, as shown in Fig. 6. For comparison, the values for the Mo–Si–B ternary alloys reviewed by Lemberg and Ritchie50) were also plotted. As shown in Fig. 6, the fracture-toughness values and Moss volume fractions of this study were roughly correlated. However, some alloys had almost the same fracture-toughness value, even though their Moss volume fractions were different. For example, Alloys M1 and M3 had a fracture toughness of ∼16 MPa(m)1/2 with Moss volume fractions of 55 and 45 vol%, respectively. These results suggested that the room-temperature fracture-toughness values of the ZrC-added Mo–Si–B alloys were correlated not only with the volume fraction of Moss but also with other parameters.
To consider the contribution of each constituent phase to the fracture toughness from the viewpoint of volume fraction, the regression analysis for fracture toughness applied in our previous study48) was repeated in a more systematic manner:
| \begin{equation}
F_{1} = aV_{f}^{\text{Moss}}
\end{equation}
| (1) |
| \begin{equation}
F_{2} = aV_{f}^{\text{Moss}} + bV_{f}^{\text{T2}} + cV_{f}^{\text{ZrC}} + dV_{f}^{\text{Mo2B}}
\end{equation}
| (2) |
where
a,
b,
c, and
d are constants (MPa(m)
1/2), and
$V_{f}^{X}$ is the volume fraction (vol%) of
X = Mo
ss, T
2, ZrC, or Mo
2B. The fracture toughness
F1 is purely a function of Mo
ss, while
F2 considers all constituent phases. The coefficients
a,
b,
c, and
d were obtained by minimizing the sum of the differences between the fracture toughness
KQ and
F1 or
F2 for all examined alloys. That is,
$\mathop \sum \nolimits_{i}^{N}|K_{\text{Q},i} - F_{\text{1 or 2},i}|$, where
N is the total number of alloys,
i is the alloy (L1 to H3), and
F1,i or
F2,i is calculated from the volume fractions of the constituent phases in alloy
i. Thus,
F1 and
F2 indicate the fracture toughness as a function of the volume fraction of the constituent phases. This leads to the equations below:
| \begin{equation}
F_{1} = 0.308V_{f}^{\text{Moss}}
\end{equation}
| (3) |
| \begin{equation}
F_{2} = 0.258V_{f}^{\text{Moss}} + 0.0290V_{f}^{\text{T2}} + 0.161V_{f}^{\text{ZrC}} + 0V_{f}^{\text{Mo2B}}
\end{equation}
| (4) |
Note that in
eq. (4),
d is 0 as the contribution of Mo
2B to the fracture toughness was considered to be negligible, although it was present in three alloys at a low volume fraction.
The relationships between KQ and F1 and F2 are shown in Fig. 7. It can be seen that F2 has better regression linearity with KQ than does F1. Therefore, it is apparent that F2 represents the contribution of the volume fractions of the constituent phases to the fracture toughness. The coefficients of the Moss and ZrC volume fractions are one order of magnitude larger than that of the T2 volume fraction, suggesting that not only Moss but also ZrC contributed to toughening. Furthermore, the cleavage surfaces of ZrC exhibited river patterns, whereas they were hardly observed on the cleavage surfaces of T2 (Fig. 5). The fractography of ZrC and T2 was also in good agreement with the magnitudes of the coefficients.

Although the fracture toughness of single-phase ZrC was reported to be 1.051) or ∼4.052) MPa(m)1/2 and that of single-phase T2 was 1.5–3.537,38) MPa(m)1/2, ZrC in the Mo–Si–B–Zr–C system is likely to be more effective in improving the fracture toughness than T2, as discussed above. It is suggested that the fracture toughness of ZrC is improved by its combination with Mo–Si–B alloy. According to the Mo–Zr–C ternary phase diagram,57,58) (Zr, Mo)Cx equilibrates with Moss in the C-poor region, that is, C/(Zr + Mo) < 1 (mol.%/mol.%). Thus, ZrC in the Mo–Si–B–Zr–C system would be within the C-poor region containing Mo. For TiC-added Mo–Si–B alloys, Uemura et al.46) carried out a careful EPMA analysis of the composition of (Ti, Mo)Cx equilibrating with Moss, T2, and (Mo, Ti)2C and reported a composition of 31.0 mol.% Ti, 23.5 mol.% Mo, and 45.5 mol.% C, yielding C/(Ti + Mo) = 0.83 (mol.%/mol.%) under the same heat-treatment conditions as used in the present study. Therefore, it is considered that off-stoichiometric ZrC plays an effective role in toughening the alloys.
4.2 Effect of Moss continuity on room-temperature fracture toughness
Schneibel et al.16) reported that a Mo–Si–B alloy produced by careful powder processing has a fracture toughness of 14.8 MPa(m)1/2, even though it only had about 38 vol% Moss. In their report, it was pointed out that continuous Moss played an important role in increasing the fracture toughness. Based on this suggestion, in the present study, the compositional dependence of the Moss continuity was evaluated, and the effect of Moss continuity on the fracture toughness is discussed. Moreover, the continuity of other phases was also evaluated, and the microstructural morphology of the ZrC-added Mo–Si–B alloys was characterized.
EBSD-OIM and image analyses using ImageJ were performed for the continuity analysis of Moss and the other phases. Figure 8(a) shows a phase map of Alloy L3 obtained with the EBSD-OIM method, revealing clear contrast compared with the SEM-BSE image (Fig. 8(b)). First, Moss was classified as a ductile phase, and the other phases as brittle phases. The phase maps were then binarized to display ductile Moss (white) and brittle (black) phases (Fig. 8(c)). A continuous ductile or brittle phase was defined as a cluster, and the continuity of ductile Moss (or brittle phases) was characterized by the ductile- (brittle-) phase cluster distribution. The area of each cluster was measured in the image analysis. Regarding the ductile phase, the area fraction of each ductile-phase cluster was defined by the continuity degree, C, that is, $C_{j}^{\text{ductile}} = (A_{j}^{\text{ductile}}/A_{\text{e}}^{\text{ductile}}) \times 100$ (%), where j (= 1, 2, …, n) is the number of clusters, Cj is the continuity of cluster j, $A_{j}^{\text{ductile}}$ is the area of the ductile phase cluster j, and $A_{\text{e}}^{\text{ductile}}$ is the entire area of the ductile phase. If $C_{1}^{\text{ductile}} = 100$%, this means that the ductile phase is perfectly continuous. In contrast, as $C_{j}^{\text{ductile}}$ approaches 0%, the ductile phase becomes discontinuous and finely dispersed. A similar continuity degree $C_{k}^{\text{brittle}}$ was defined for the brittle phases.

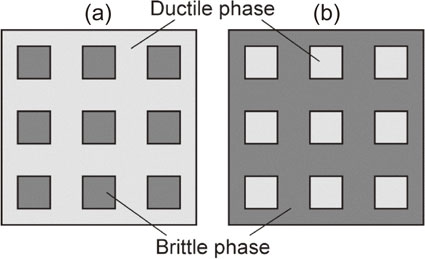
The obtained $C_{j}^{\text{ductile}}$ and $C_{k}^{\text{brittle}}$ distributions are shown in Fig. 9. Note that only the top 10 clusters (j and k = 1 to 10) having high continuity are shown in the figures. From Figs. 9(a) and (b), the Series-L alloys are seen to have a ductile phase cluster with >95% continuity and many brittle clusters with <10% continuity, regardless of the ZrC volume fraction. In other words, these alloys mainly consisted of an almost fully continuous ductile Moss phase and discontinuous brittle phases. From these results, the Series-L alloys are categorized as brittle-phase-dispersed (BPD) ductile-phase-matrix (DPM) alloys; the associated microstructural model is shown schematically in Fig. 10(a) as Model 1. The relationship between the ductile and brittle phase clusters is reversed in the Series-H alloys (Figs. 9(e) and (f)). Accordingly, these alloys are categorized as ductile-phase-dispersed (DPD) brittle-phase-matrix (BPM) alloys, as shown in Fig. 10(b) as Model 2.

The Series-M alloys (Figs. 9(c) and (d)) contained one or two ductile and brittle clusters with >20% continuity. Alloy M1 contained a >60%-continuous ductile cluster and two >15%-continuous brittle clusters, while Alloys M2 and M3 contained two >20%-continuous ductile clusters and a >45%-continuous brittle cluster. It is considered that the Series-M alloys have the features of both the BPD-DPM and DPD-BPM alloys, and thus, the microstructural model is considered as a mixture of Models 1 and 2. There is a possibility that both the ductile and brittle phases are connected in three dimensions, but the present study and analysis are limited to two dimensions. Therefore, from the experimental results (Fig. 4) and microstructural modeling, it is convincing that the DPM alloys (Model 1) showed higher fracture-toughness values than the BPM alloys (Model 2). This suggests that ductile-phase toughening41) by Moss worked effectively for alloys with a higher Moss continuity, such as the Series-L alloys.
According to microstructure observations of the as-cast alloys, an increase in the Si and B contents leads to an increase in the volume fractions of T2, Mo2B, and Mo3Si. Consequently, the discontinuity of the Moss phase remains even after heat treatment. Hence, the increase in the Si and B contents changes the microstructure from DPM (Model 1) to BPM (Model 2) and has a negative effect on the fracture toughness. However, with Zr and C addition, an increase in the ZrC volume fraction did not significantly change the microstructural models within the same alloy series, and thus, the fracture-toughness values were almost the same within a given series. Considering the difference in the crystallization morphologies of T2 and ZrC, ZrC was crystallized as a Moss+ZrC eutectic in the Moss matrix and/or as primary ZrC surrounded by Moss. Because of the crystallization morphology during solidification, an increase in the ZrC volume fraction did not lower the Moss continuity, and consequently, the fracture toughness of the ZrC-added Mo–Si–B alloys was maintained even though the ZrC volume fraction increased. Therefore, the results of the Moss continuity analysis confirmed that ZrC has a different effect from T2 on the Moss continuity, that is, ZrC maintains the continuity of Moss.
4.3 Toughening factors of ZrC-added Mo–Si–B alloys
According to Sections 4.1 and 4.2, the toughening factors for the ZrC-added Mo–Si–B alloys are the volume fractions of Moss and ZrC, and the continuity of Moss. In this section, the correlation between these three factors is quantitatively discussed. Equation (4) in Section 4.1 indicates that the fracture toughness of the ZrC-added Mo–Si–B alloys increases to 25.8 when the volume fraction of Moss is 100% ($V_{f}^{\text{Moss}} = 100$). The room-temperature fracture toughness of pure Mo has been reported to be 24.2 MPa(m)1/2,59) indicating good agreement with that of Moss assumed from the regression analysis in this study. Therefore, the increase in Moss volume fraction in ZrC-added Mo–Si–B alloys is expected to increase the fracture-toughness value of the alloys up to the value for pure Mo.
Schneibel et al.16) reported the fracture-toughness values calculated using the Irwin’s similarity relationship for Mo–12Si–8.5B alloys prepared by ingot and powder metallurgy, which are described in Table 3 as Mo–12Si–8.5B (IM) and Mo–12Si–8.5B (PM), respectively. Alloy H3 in this study has 38 vol% Moss, which is the same as that of the Mo–12Si–8.5B alloy. The volume fractions of all the constituent phases and the fracture toughness of Alloy H3 are shown in Table 3 again to discuss the effect of the ZrC volume fraction. Mo–12Si–8.5B (IM) has been reported to have discontinuous ductile Moss and a brittle silicide matrix composed of Mo3Si and T2.16) Similarly, as mentioned in Section 4.2, Alloy H3 has discontinuous ductile Moss and a continuous brittle phase matrix. Thus, Alloy H3 can be considered as an alloy where 15 vol% of the silicides in Mo–12Si–8.5B (IM) is replaced with ZrC. The fracture-toughness values of Mo3Si and T2 are reported to be 2–435) and 1.5–3.537,38) MPa(m)1/2, respectively. Moreover, the fracture toughness of a Mo3Si and T2 composite has been reported to be 3.3 MPa(m)1/2 by Schneibel et al.16,60) (Table 3). Therefore, Mo3Si and T2 have almost the same fracture toughness, irrespective of a single phase or composite, and thus, the composite effect of Mo3Si and T2 would be negligible. On the other hand, the fracture toughness of Alloy H3 increased 2.9 MPa(m)1/2 from Mo–12Si–8.5B (IM) by replacing 15 vol% of the silicides with ZrC. It is apparent that the volume fraction of off-stoichiometric and Mo-containing ZrC must be taken into account for toughening. The mechanical properties of the ZrC phase should be studied in future work.

Finally, the importance of the continuity of Moss is qualitatively discussed in section 4.2. Comparing Alloy L3, which has the lowest Moss volume fraction in the ductile-phase matrix (DPM) alloys, and Alloy H1, which has the highest Moss volume fraction in the brittle-phase matrix (BPM) alloys, the difference in the fracture toughness between these alloys was 5.6 MPa(m)1/2. Thus, the effect of Moss continuity was estimated to increase the toughness by 5–6 MPa(m)1/2. However, the effect of the continuous Moss matrix was not strictly discussed in this study due to the difference in the volume fractions of the constituent phases and the composition of the alloys. Thus, the effect of a continuous Moss matrix was also discussed for comparison with the Mo–12Si–8.5B alloys reported by Schneibel et al.16) The volume fraction of the constituent phases in Mo–12Si–8.5B (PM) is not reported in the literature, but it would be the same as that of Mo–12Si–8.5B (IM). Besides, Mo–12Si–8.5B (PM) was reported to have a continuous Moss matrix, and it was actually shown to be almost fully continuous. Considering the results of the IM and PM Mo–12Si–8.5B alloys, at 38 vol% Moss volume fraction, the difference in the fracture toughness between the Mo–12Si–8.5B alloys was 5.3 MPa(m)1/2, showing good agreement with the difference between the DPM and BPM alloys in this study. Therefore, according to the present and previous studies, the effect of a continuous Moss matrix on fracture toughness was considered to increase the toughness by 5–6 MPa(m)1/2.
Therefore, the volume fraction of Moss was effective to increase the fracture toughness of ZrC-added Mo–Si–B alloys, as mentioned in a previous study.48) In addition, the replacement of the silicides with the off-stoichiometric ZrC and the improvement of Moss continuity by the microstructure morphology of the Moss+ZrC eutectic were also effective in this alloy system. Hence, it can be concluded that the high toughness of the ZrC-added Mo–Si–B alloys results from the synergistic effect of the toughening of ZrC, the higher Moss volume fraction, and its continuity.
5. Conclusions
The relationship between microstructure and room-temperature fracture toughness was systematically investigated for a series of ZrC-added Mo–Si–B alloys. The fracture-toughness values were evaluated by four-point bending tests and the Irwin’s similarity relationship; the average values for the heat-treated alloys were in the range 12.4 to 20.3 MPa(m)1/2. The fracture toughness improved with an increase in the volume fractions of the molybdenum solid solution (Moss) and ZrC phases, whereas it degraded with an increase in the volume fraction of the Mo5SiB2 (T2) phase. Fracture surface observations confirmed that not only Moss but also ZrC showed river patterns. This result suggested that ZrC worked to facilitate the toughening of the alloys, which was probably a result of the toughening of the ZrC phase itself due to the off-stoichiometric and solute Mo effects. Moreover, Moss continuity analysis demonstrated that alloys with higher Moss continuity had higher fracture toughness. This suggested that ductile-phase toughening41) by Moss worked effectively for the alloys with higher Moss continuity. The Moss continuity was significantly lowered by an increase in the T2 volume fraction but was not lowered markedly by an increase in the ZrC volume fraction. Therefore, it was considered that the relatively high toughness of the ZrC-added Mo–Si–B alloys results from the synergistic effect of the toughening of ZrC, the higher Moss volume fraction, and its continuity.
Acknowledgments
This work was supported by the Advanced Low Carbon Technology Research and Development Problem (ALCA) of the Japan Science and Technology Agency (JST).
REFERENCES
- 1) D.M. Dimiduk and J.H. Perepezko: MRS Bull. 28 (2003) 639–645.
- 2) J.H. Perepezko: Science 326 (2009) 1068–1069.
- 3) J.H. Schneibel, C.T. Liu, D.S. Easton and C.A. Carmichael: Mater. Sci. Eng. A 261 (1999) 78–83.
- 4) T.G. Nieh, J.G. Wang and C.T. Liu: Intermetallics 9 (2001) 73–79.
- 5) J.H. Schneibel: Intermetallics 11 (2003) 625–632.
- 6) K. Yoshimi, S. Nakatani, N. Nomura and S. Hanada: Intermetallics 11 (2003) 787–794.
- 7) A.P. Alur, N. Chollacoop and K.S. Kumar: Acta Mater. 52 (2004) 5571–5587.
- 8) P. Jain and K.S. Kumar: Acta Mater. 58 (2010) 2124–2142.
- 9) R. Mitra: Int. Mater. Rev. 51 (2006) 13–64.
- 10) M.K. Meyer, M.J. Kramer and M. Akinc: Intermetallics 4 (1996) 273–281.
- 11) K. Yoshimi, M.H. Yoo, A.A. Wereszczak, S.M. Borowicz, E.P. George and R.H. Zee: Scr. Mater. 45 (2001) 1321–1326.
- 12) K. Ito, K. Ihara, K. Tanaka, M. Fujikura and M. Yamaguchi: Intermetallics 9 (2001) 591–602.
- 13) T. Hayashi, K. Ito, K. Ihara, M. Fujikura and M. Yamaguchi: Intermetallics 12 (2004) 699–704.
- 14) S. Kim and J.H. Perepezko: J. Phase Equilibria Diffus. 27 (2006) 605–613.
- 15) S.-H. Ha, K. Yoshimi, K. Maruyama, R. Tu and T. Goto: Mater. Sci. Eng. A 552 (2012) 179–188.
- 16) J.H. Schneibel, M.J. Kramer, Ö. Ünal and R.N. Wright: Intermetallics 9 (2001) 25–31.
- 17) J.H. Schneibel, M.J. Kramer and D.S. Easton: Scr. Mater. 46 (2002) 217–221.
- 18) H. Choe, J.H. Schneibel and R.O. Ritchie: Metall. Mater. Trans. A 34 (2003) 225–239.
- 19) J.J. Kruzic, J.H. Schneibel and R.O. Ritchie: Scr. Mater. 50 (2004) 459–464.
- 20) J.J. Kruzic, J.H. Schneibel and R.O. Ritchie: Metall. Mater. Trans. A 36 (2005) 2393–2402.
- 21) J.H. Schneibel, R.O. Ritchie, J.J. Kruzic and P.F. Tortorelli: Metall. Mater. Trans. A 36 (2005) 525–531.
- 22) M.K. Meyer and M. Akinc: J. Am. Ceram. Soc. 79 (1996) 938–944.
- 23) M.K. Meyer and M. Akinc: J. Am. Ceram. Soc. 79 (1996) 2763–2766.
- 24) M.K. Meyer, A.J. Thom and M. Akinc: Intermetallics 7 (1999) 153–162.
- 25) M. Akinc, M.K. Meyer, M.J. Kramer, A.J. Thom, J.J. Huebsch and B. Cook: Mater. Sci. Eng. A 261 (1999) 16–23.
- 26) K. Yoshimi, S. Nakatani, T. Suda, S. Hanada and H. Habazaki: Intermetallics 10 (2002) 407–414.
- 27) R. Sakidja, J.H. Perepezko, S. Kim and N. Sekido: Acta Mater. 56 (2008) 5223–5244.
- 28) P.K. Ray, Y.Y. Ye, M. Akinc and M.J. Kramer: J. Alloys Compd. 537 (2012) 65–70.
- 29) T. Karahan, G. Ouyang, P.K. Ray, M.J. Kramer and M. Akinc: Intermetallics 87 (2017) 38–44.
- 30) R. Sakidja and J.H. Perepezko: J. Nucl. Mater. 366 (2007) 407–416.
- 31) Y. Yang, H. Bei, S. Chen, E.P. George, J. Tiley and Y.A. Chang: Acta Mater. 58 (2010) 541–548.
- 32) M.A. Azim, S. Burk, B. Gorr, H.-J. Christ, D. Schliephake, M. Heilmaier, R. Bornemann and P.H. Bolívar: Oxid. Met. 80 (2013) 231–242.
- 33) D. Schliephake, M. Azim, K.V. Klinski-Wetzel, B. Gorr, H.-J. Christ, H. Bei, E.P. George and M. Heilmaier: Metall. Mater. Trans. A 45 (2014) 1102–1111.
- 34) M.A. Azim, D. Schliephake, C. Hochmuth, B. Gorr, H.-J. Christ, U. Glatzel and M. Heilmaier: JOM 67 (2015) 2621–2628.
- 35) I. Rosales and J.H. Schneibel: Intermetallics 8 (2000) 885–889.
- 36) F. Chu, D.J. Thoma, K. McClellan, P. Peralta and Y. He: Intermetallics 7 (1999) 611–620.
- 37) K. Ihara, K. Ito, K. Tanaka and M. Yamaguchi: Mater. Sci. Eng. A 329–331 (2002) 222–227.
- 38) L. Zhang, K. Pan and J. Lin: Intermetallics 38 (2013) 49–54.
- 39) R. Rosenkranz, G. Frommeyer and W. Smarsly: Mater. Sci. Eng. A 152 (1992) 288–294.
- 40) R. Mitra: Metall. Mater. Trans. A 29 (1998) 1629–1641.
- 41) M.F. Ashby, F.J. Blunt and M. Bannister: Acta Metall. 37 (1989) 1847–1857.
- 42) S. Miyamoto, K. Yoshimi, S.-H. Ha, T. Kaneko, J. Nakamura, T. Sato, K. Maruyama, R. Tu and T. Goto: Metall. Mater. Trans. A 45 (2014) 1112–1123.
- 43) K. Yoshimi, J. Nakamura, D. Kanekon, S. Yamamoto, K. Maruyama, H. Katsui and T. Goto: JOM 66 (2014) 1930–1938.
- 44) J. Nakamura, D. Kanekon and K. Yoshimi: Mater. Lett. 180 (2016) 340–343.
- 45) S. Yamamoto, K. Yoshimi, J. Kim and K. Yokoyama: J. Jpn. Inst. Met. Mater. 80 (2016) 51–59.
- 46) S. Uemura, T. Yamamuro, J.W. Kim, Y. Morizono, S. Tsurekawa and K. Yoshimi: J. Jpn. Inst. Met. Mater. 80 (2016) 529–538.
- 47) T. Moriyama, K. Yoshimi, M. Zhao, T. Masnou, T. Yokoyama, J. Nakamura, H. Katsui and T. Goto: Intermetallics 84 (2017) 92–102.
- 48) S. Nakayama and K. Yoshimi: J. Jpn. Inst. Met. Mater. 80 (2016) 92–101.
- 49) A. Sato, A.-C. Yeh, T. Kobayashi, T. Yokokawa, H. Harada, T. Murakumo and J.X. Zhang: Energy Mater. Mater. Sci. Eng. Energy Syst. 2 (2007) 19–25.
- 50) J.A. Lemberg and R.O. Ritchie: Adv. Mater. 24 (2012) 3445–3480.
- 51) S.E. Landwehr, G.E. Hilmas, W.G. Fahrenholtz, I.G. Talmy and S.G. DiPietro: Mater. Sci. Eng. A 497 (2008) 79–86.
- 52) E. Min-Haga and W.D. Scott: J. Mater. Sci. 23 (1988) 2865–2870.
- 53) T. Suzuki, N. Nomura, K. Yoshimi and S. Hanada: J. Jpn. Inst. Met. Mater. 64 (2000) 1082–1088.
- 54) T. Suzuki, H. Matsumoto, N. Nomura and S. Hanada: Materia Japan 41 (2002) 150–153.
- 55) I. Ohno: J. Phys. Earth 24 (1976) 355–379.
- 56) M. Zhao, K. Yoshimi, K. Maruyama and K. Yubuta: Acta Mater. 64 (2014) 382–390.
- 57) T.C. Wallace, C.P. Gutierrez and P.L. Stone: J. Phys. Chem. 67 (1963) 796–801.
- 58) T.F. Fedorov, Yu.B. Kuz’ma and L.V. Gorshkova: Sov. Powder Metall. Met. Ceram. 4 (1965) 229–233.
- 59) D. Sturm, M. Heilmaier, J.H. Schneibel, P. Jéhanno, B. Skrotzki and H. Saage: Mater. Sci. Eng. A 463 (2007) 107–114.
- 60) J.H. Schneibel and H.T. Lin: Proceedings 14th Annual Conference on Fossil Energy Materials, (Oak Ridge National Laboratory, 2000) pp. 24–26.