First-Principles Study of BCC/FCC Phase Transition Promoted by Interstitial Carbon in Iron
2018 Volume 59 Issue 6 Pages 870-875

Details
2018 Volume 59 Issue 6 Pages 870-875
We report the effect of carbon on the phase transition between body centered cubic (BCC) and face centered cubic (FCC) in iron along Bain pathway, taking into account magnetic configurations, using density functional theory in combination with the generalized solid-state nudged elastic band method. We found that, for pure iron system, the energy barrier of 13.22 kJ·mol−1 is needed for the BCC-to-FCC process happens, while 2.41 kJ·mol−1 is needed for the reverse process (FCC-to-BCC). In the presence of carbon at the octahedral interstitial site of iron BCC/FCC lattice, the energy barrier of 4.53 kJ·mol−1 is needed for the transition from FCC to BCC while the 12.25 kJ·mol−1 is needed for a transition from BCC to FCC along the Bain path. Thus, carbon promotes the transition from BCC to FCC while it prevents the phase transition in opposite direction, from FCC to BCC. This is due to the local stress field formed in the vicinity of carbon atom which pushes the iron atoms aligning with carbon along [001] direction away.
Materials design, which could simultaneously demonstrate multiple promising properties like high strength, good ductility and fracture toughness, has been a long-standing demand for industrial applications. Carbon steel, which usually consists of ferrite and cementite phases at room temperature, is one of the most popular engineering structural materials. The distribution and diffusion of carbon in iron can control the formation and kinetics of many processes in steels such as carbide precipitation, martensite ageing, and ferrite transformation1–3) which are of major importance for the steel industry. Traditionally, for normal steel, as the carbon content increases, the hardness of the steel also increases while the ductility decreases and vice versa. This is like a trade-off between the strength and ductility. Since the mechanical properties of materials depend on microstructure,4) to obtain both strength and ductility properties, one considers controlling the microstructure via grain refinement, precipitation control, and so on. One of the innovative methods is to use heterogeneous steel such as dual-phase (DP) steel which consists of ferrite and a dispersed hard martensitic second phase in the form of islands.5) Depending on the carbon content and the morphology of the microstructure, DP steel can exhibit a number of advantageous properties compared to other steels, for example, excellent resistance to fatigue crack propagation at growth rates close to fatigue threshold. In the development of DP steel, martensitic transformation, where austenite transforms to martensite under quenching, plays a crucial role in tuning the mechanical properties of the material. In spite of the significant progress in recent years, due to the complexity of the phase transformation in iron-based alloys, the understandings about the transformation dynamics of DP steel, the effect of carbon solute on the thermodynamics and kinetics of phase transformations and the formation of carbide in DP steel under various conditions are still unclear.
Previously, great amount of efforts was devoted to the study of martensitic transformation in iron/steel. Various phase-field modeling in combination with ab initio parameterization showed that the mechanism of martensitic transformation is mainly contributed by the magnetic degree of freedom due to the strongly correlated magnetic ordering and lattice deformation.6–8) Recent first-principles calculations by Zhang et al.9) indicated that the austenite → ferrite reconstruction can be realized through a specific Metastable Intermediate Structure (MIS) which appears near the boundary of ferrite at high carbon concentration (about 6.667 mass%). In that study, due to the use of small supercells, no effect of low concentration of carbon on the structural transformations was discussed. Furthermore, the special quasi-random structures (SQS) approach was employed for describing the paramagnetic structure of austenite and hence, the detail of magnetic configurations for austenite at atomic level is not clear.
In this study, we shall elucidate the effects of carbon interstitial impurity at low concentration on the energy barriers for a BCC/FCC phase transition as well as discuss the interaction mechanism of carbon and iron at atomic level which leads to these effects. This is an important content of martensitic transformation in iron–carbon alloys, in which the FCC phase are thermodynamically stable at high temperatures and transforms into tetragonal distorted BCC phase at low temperatures.
In order to transform the crystal lattice between BCC and FCC, numerous ways have been suggested such as Bain transformation,10) involving tetragonal deformation along [001] direction, Kurdjumov–Sachs11) and Nishiyama–Wassermann12,13) transformations which consist of two shear deformations. In these transformations, to find the minimum energy path and energy barrier, it is required to know the configurational space of the lattice deformation for total energy calculations. Among the transformation schemes mentioned, Bain path which describes a continuous deformation from BCC to FCC is usually used14–16) because of its simplicity and it also retains at each step the highest possible crystal symmetry. The schematic representation of a Bain transformation path is depicted in Fig. 1. The ideal scenario is that a body centered tetragonal (BCT) cell (formed by the large unfilled circles) can be derived from a FCC lattice. This BCT then can be changed to BCC by compressing along [001] direction. An occupation of impurity on octahedral site, shown as a small circle in Fig. 1, is inherited between BCC and FCC lattices.
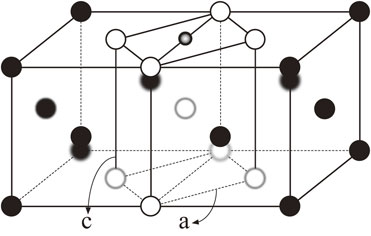
Schematic representation of the Bain transformation path. Iron atoms are displayed in large circles (filled and unfilled), while the small circle (with gradient filled) denotes carbon atom located at the octahedral site.
In this work, a 4 × 4 × 4 supercell model with 128 iron atoms and 1 carbon atom placed at interstitial site of iron lattice was considered. Thus, the atomic percentage of the present Fe–C alloy is reduced as 0.167 mass%. This supercell is adequate for first-principles calculations because it is large enough to avoid carbon–carbon interaction in neighbor cells while the computation cost is reasonable for modern computer resource.17) First-principles calculations were performed using the spin-polarized version of the Vienna ab initio Simulation Package (VASP).18,19) The Perdew–Burke–Ernzerhof (PBE) version of the generalized gradient approximation (GGA) was used to describe the exchange-correlation.20) The interaction between the core and valence electrons was treated by the projector augmented wave (PAW) method.21,22) The valence electron configurations of iron (8 electrons in 3d and 4s orbitals) and carbon (4 electrons in 2s and 2p orbitals) were represented in a plane wave basis set with a kinetic energy cutoff of 801.090 × 10⁻¹⁹ J (500 eV). The Brillouin zone was sampled using a (4 × 4 × 4) Monkhorst–Pack23) grid for bulk iron with and without carbon impurity. For structural optimization, the first-order Methfessel–Paxon24) smearing method with a thermal smearing parameter of 0.320 × 10⁻¹⁹ J (0.2 eV) was used for integration over k-space, while for static calculations the tetrahedron method with Blöchl corrections was carried out. All structures were optimized until the Hellman–Feynman force exerted on an atom is less than 0.016 × 10⁻¹⁰ N (0.01 eV/nm).
In order to determine the minimum energy path (MEP) and the energy barriers of the Bain transformation, the climbing image nudged elastic band (CI-NEB)25,26) was used. In this method, the minimum energy path between optimized initial state (IS, e.g. BCC structure) and final state (FS, e.g. FCC structure) was obtained. In the search for the transition state (TS), the initial and final states were kept fixed while other intermediate structures (so called “image” or “replica”) were allowed to relax using force-based optimizers27) along the “elastic band” until the force exerted on an image is less than 0.16 × 10⁻¹⁰ N (0.1 eV/nm). The energy barrier is then obtained using the following expression:
| \begin{equation*} \text{E}_{\text{a}} = \text{E}_{\text{TS}} - \text{E}_{\text{IS}} \end{equation*} |
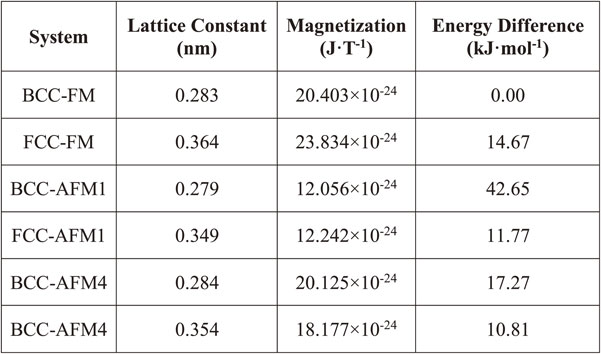
Before carrying out the electronic structures calculations and the MEP search, optimized lattice parameters and magnetic properties of FCC and BCC iron lattices were calculated. For ferromagnetic (FM) state, there is only one configuration for electron spins so the calculation was straightforward. However, there are many possible configurations for anti-ferromagnetic (AFM) state, then it is necessary to specify the most stable configuration for AFM state. In this work, five AFM spin configurations are considered, as shown in Fig. 2. Among them, the AFM1 configuration is usually used in first-principles calculations because of its simplicity and small unit-cell requirement. In order to examine the stability of different AFM configurations, the total energies as functions of lattice constants were calculated and fitted to the Birch–Murnaghan equation of state.29,30) The results are shown in Fig. 3 and listed in Table 1. We can see that; the ground state of BCC structure is ferromagnetic (BCC-FM) while the anti-ferromagnetic state AFM4 is more stable for FCC lattice (FCC-AFM4). The lattice constant of 0.283 nm (atomic volume: 0.114 × 10⁻²⁶ m3) and magnetic moment of 20.403 × 10⁻²⁴ J·T−1 per atom were found for BCC-FM. And in the case of FCC-AFM4, the values are 0.354 nm (atomic volume: 0.111 × 10⁻²⁶ m3) and magnetic moment of 18.177 × 10⁻²⁴ J·T−1 per atom, respectively. The results are consistent with experimental data and other theoretical works,31–35) where the experimental atomic volumes for BCC and FCC iron are 0.118 × 10⁻²⁶ m3 and 0.114 × 10⁻²⁶ m3, respectively. It is important to note that for the common AFM configuration, AFM1, the atomic volume is about 0.106 × 10⁻²⁶ m3, which is much smaller than the experimental value as compared to the AFM4 configuration. Hence, the FM and AFM4 spin states will be mainly focused during the phase transformation simulations. For the case of AFM1 spin state, the calculation is conducted for comparison with other works only.

Anti-ferromagnetic (AFM) configurations of BCC and FCC structures. The filled and unfilled circles represent atoms with different spin directions.

Equilibrium lattice constants of BCC and FCC structures with different anti-ferromagnetic (AFM) configurations. The lattice constants were estimated by fitting volumes and energies to the Birch-Murnaghan equation of state.
Because the BCC and FCC stable structures have different magnetic properties as shown in Table 1, therefore, in the BCC/FCC transformation process, both structural and magnetic transition occur. The magnetic state of the intermediate structures in SS-NEB calculation are not known clearly and can either follow the FM state of BCC or the AFM state of FCC. In order to find the transformation path and energy barrier for BCC/FCC transition, two cases were considered: (1) BCC-FM to FCC-FM; and (2) BCC-AFM to FCC-AFM (AFM1 and AFM4).
The variation of the total energy along the Bain path for the two cases mentioned above are depicted in Fig. 4. The BCC-FM structure is chosen as the reference for energy comparison. For FM state, FCC structure is unstable and directly transforms to BCC structure without any energy barrier. This is in good agreement with the results of previous ab initio calculations.9,36) Similarly, for the case of AFM1 state, no energy barrier is found for the BCC-AFM1 → FCC-AFM1 transition. We can see that the two transformation curves intersect at a c/a ratio of 1.37. As stated by Okatov et al.,36) after examining the non-collinear magnetic configurations for describing a continuous transition between FM and AFM states, the intersection point can be considered as the transition state where the spin flips occur. The energy barrier is estimated to be about 14.09 kJ·mol−1 for BCC-FM → FCC-AFM1 transition and about 2.32 kJ·mol−1 for FCC-AFM1 → BCC-FM transition, which agrees well with the energy barriers reported by other works.9,36,37) For the case of AFM4 state, energy barrier of 4.15 kJ·mol−1 is found for the BCC-AFM4 → FCC-AFM4 transition. This phase transition curve crosses the BCC-FM → FCC-FM curve at a c/a ratio of 1.34. The energy barrier is found to be about 13.22 kJ·mol−1 for BCC-FM → FCC-AFM4 transition and about 2.41 kJ·mol−1 for FCC-AFM4 → BCC-FM transition. Hence, it is clear that the BCC/FCC transition is significantly affected by the magnetic ordering in iron lattice, which is consistent with the conclusions of Razumov et al.6–8)

Variation of energy along the Bain transformation path with respect to c/a ratio for the Ferromagnetic (FM) and Anti-ferromagnetic (AFM) states. The reference energy is taken from BCC Fe 4 × 4 × 4 supercell. Two vertical dash lines mark the c/a ratios corresponding to BCC and FCC structures.
In BCC lattice, there are two high-symmetry sites to host interstitial impurity, which are octahedral (O) and tetrahedral (T) sites. In the case of carbon, the dissolution energies for residing at O-site and T-site are 1.277 × 10⁻¹⁹ J (0.797 eV) and 2.679 × 10⁻¹⁹ J (1.672 eV), respectively. Hence, in BCC iron, carbon is energetically favorable to occupy O-site. By locating the carbon on the O-site in the supercell of the structures above then fully optimizing, the optimized parameters for those structures are listed in Table 2. Here, we used lattice parameters of corresponding body center tetragonal (BCT) structure for consistent use of c/a ratio. It is necessary to mention that the carbon is placed at the O-site so that the Fe–C–Fe bond aligns along c lattice vector ([001] direction). From Table 2 we can see that, due to the interaction of carbon with surrounding iron atoms, the original shape of BCC and FCC structures does not retain. There are significant changes in the c/a ratio in those structures. For instance, in BCC-FM, the c/a ratio increases from 1 to 1.02 (∼2%) while in FCC-AFM, the c/a ratio changes from 1.41 to 1.53 (∼9%).

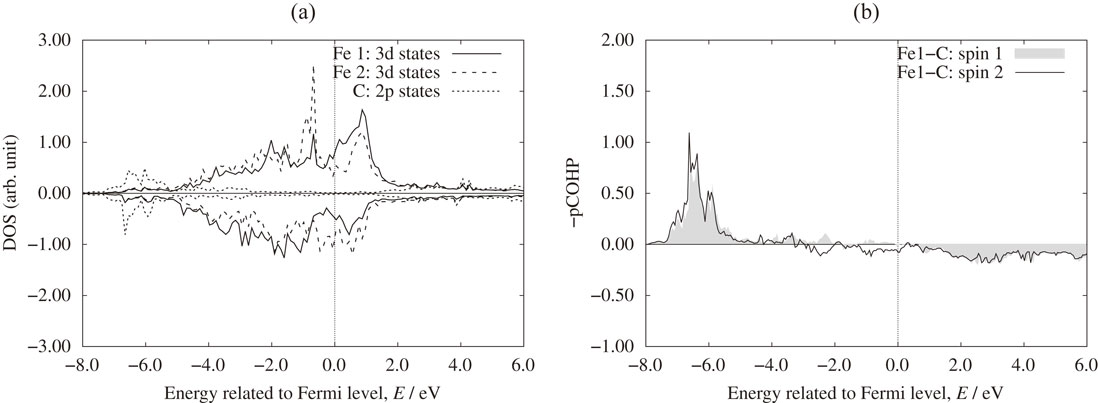
Figure 5 shows the optimized position of iron atoms around carbon atom for BCC-FM and FCC-AFM structures before and after structural optimization. Here we denote Fe1 for iron atoms align with carbon along [001] direction (first nearest neighbor - 1NN) and Fe2 are other atoms at octahedron vertexes (second nearest neighbor - 2NN). Different Fe–C bond lengths before (in parentheses) and after structural relaxation are revealed. We can see that, Fe1–C bonds are significantly elongated to around 0.178 ÷ 0.191 nm (depending on the magnetic state of the host structure) due to the repulsion of carbon. Roughly, these values are more or less equal to the total radii of iron and carbon (0.127 and 0.077 nm for iron and carbon, respectively38)). To examine the interaction of carbon with the surrounding iron atoms, the Hellman-Feynman forces acting on iron atoms before optimization were calculated and illustrated as arrows in Fig. 5. We note that, for the case of BCC structure, there are strong repulsive forces between Fe1 atoms and carbon. Quantitatively, the atomic forces on Fe1 are about 326.845 × 10⁻¹⁰ N and 68.894 × 10⁻¹⁰ N for the cases of BCC and FCC, respectively. Thus, carbon dissolution at the O-site in BCC lattice creates an anisotropic stress field that promotes the tetragonal distortion, making the BCC structure unstable and driving the system toward a phase transformation to a BCT lattice. Indeed, the presence of carbon in iron leads to the decrease of the energy difference between the FCC-FM and the BCC-FM as well as the FCC-AFM and the BCC FM structures (5.44 kJ·mol−1 and 3.14 kJ·mol−1, respectively). This is qualitatively consistent with other theoretical work using phase-field modeling.8) In Figs. 6(a) and 7(a), the partial density of states (DOS) of carbon p orbital and the d orbital of 1NN and 2NN irons at the equilibrium distance of Fe–C bonds are shown for BCC-FM and FCC-AFM. There appears significant hybridization electronic states of iron and carbon in the range from −11.215 × 10⁻¹⁹ to −8.011 × 10⁻¹⁹ J (−7.0 to −5.0 eV). By examining the projected Crystal Orbital Hamilton Populations (pCOHP) using Lobster program39–41) (shown in Fig. 6(b) and 7(b)), we found that the hybridized states are covalent bonding states of irons and carbon. This is the reason for the stability of carbon in BCT structure of iron.

Initial and optimized structures of C and surrounding Fe atoms in (a) BCC-FM and (b) FCC-AFM (AFM4) systems. Small sphere indicates C atom, while large spheres indicate Fe atoms. Atomic force vectors acting on atoms are described by arrows. Equilibrium Fe–C bond distances are shown (the values in parentheses are bond lengths in unrelaxed systems).

(a) Partial density of states and (b) Projected Crystal Orbital Hamilton Populations (COHP) of Fe and C in BCC-FM system. Projected COHP indicates the bonding and anti-bonding characteristics in the system (negative value means bonding and vice versa).
(a) Partial density of states and (b) Projected Crystal Orbital Hamilton Populations (COHP) of Fe and C in FCC-AFM (AFM4) system. Projected COHP indicates the bonding and anti-bonding characteristics in the system (negative value means bonding and vice-versa).
The presence of carbon leads to the deformation of all BCC and FCC structures. Consequently, the BCC/FCC transition following Bain mechanism is in fact corresponding to the transformation of BCT structures with different c/a ratios. Similar to the case of pure iron system, in Fe–C system, we also took into account two limiting cases to find the energy barrier for BCC/FCC phase transition. Figure 8 presents the variation of energy along the Bain path for FM and AFM4 states. We can see that the two transformation curves intersect at a c/a ratio of 1.37. Approximately, the energy barriers estimated from the intersection point are about 12.25 kJ·mol−1 and 4.53 kJ·mol−1 for BCC → FCC and FCC → BCC transitions, respectively. Hence, the presence of carbon at O-site of BCC iron enhances the phase transition from BCC to FCC, while prevents the transformation in the opposite direction. As mentioned previously, the presence of carbon drives the structural stability toward the BCT structure, and as a result, it affects the BCC/FCC phase transformation.

Variation of energy along the Bain transformation path with respect to c/a ratio for the Ferromagnetic (FM) and Anti-ferromagnetic (AFM4) states. The reference energy is taken from the optimized BCC Fe–C 4 × 4 × 4 structure with C located at the octahedral site. Two vertical dash lines mark the c/a ratios corresponding to BCC and FCC structures.
By using first-principles calculations and the generalized solid-state nudged elastic band method, we investigated the phase transition between BCC and FCC structure following the Bain path. We found that, for pure iron system, an energy barrier of 13.22 kJ·mol−1 is needed for the BCC-to-FCC transition process, while 2.41 kJ·mol−1 is needed for the opposite process (FCC-to-BCC). When carbon is present in the iron and resides at the octahedral interstitial site of iron BCC/FCC lattice, an energy barrier of 12.25 kJ·mol−1 is needed for a transition from BCC to FCC and 4.53 kJ·mol−1 is needed for the transition from FCC to BCC, along the Bain path. Hence, the presence of carbon in iron prevents the transformation from FCC to BCC but enhances the reverse transformation (BCC to FCC). This is because the local stress field formed around carbon atom which pushes the iron atoms aligning with carbon along [001] away to maintain the Fe–C equilibrium distance (about 0.178 nm and 0.191 nm for FM and AFM states, respectively).
This work is supported by the Building of Consortia for the Development of Human Resources in Science and Technology project, implemented by the Ministry of Education, Culture, Sports, Science and Technology (MEXT) of Japan. The authors are thankful to Prof. Masaaki Sugiyama and Prof. Tomoyuki Kakeshita of Osaka University for their valuable comments.