Abstract
In a highly CaCO3 filled compression molded short glass fiber polyester GFRP-BMC composite with high solidification texture angle of 71 ± ∼7 deg with respect to specimen length, Charpy impact strength, auc at both low −79°C (194 K) and high 70°C (343 K) temperatures were apparently increased 69 and 32%, respectively over that at RT (293 K). This result was highly unexpected. Test temperatures were beyond presently accepted extreme operating temperature range of commercial air flight of −62°C (211 K) to 53°C (326 K). As expected, optical observation of specimens showed number and size of surface cracks on tensile side increased, i.e. brittleness increased with decreasing temperature. In the 194 K samples, number of parallel cracks spanning most or all of specimen thickness increased exponentially with increasing auc with asymptote maxing out at about auc = 16 to 18 kJ m−2 absorbing increased fracture energy. SEM observation of fracture surfaces showed increased bare fiber exposed length from the 194 K sample indicating brittleness. There was smoother fracture surface in the 343 K sample indicating ductility compared to that of 293 K sample. The high 55 mass% of CaCO3 powder filler appears to play a role of increasing the auc of the composite at both low and high temperatures. Two strengthening mechanisms proposed are: 1) difference in coefficient of thermal expansion (CTE) between polymer matrix and CaCO3 nanoparticles creating residual compressive stresses with temperature change during either cooling or heating; and 2) crossing thermal transitions in the polymers during cooling and heating to enhance these residual stresses.
1. Introduction and Background
Since the mid-20th century there has been a momentous shift from traditional materials of iron, aluminum and steel to lightweight materials such as glass fiber reinforced polymer (GFRP) bulk and sheet molding compound (BMC and SMC) composites. Presently, according to Markets and Markets, the worldwide BMC and SMC market is projected to grow from US$ 2.36 billion in 2015 to $3.26 billion in 2020 (base year: 2014 US$dollars).1) For BMCs, compression molding has been widely utilized for producing small to very large components.
Compression molded GFRP-BMCs are 3-phase systems consisting of polymer, fiber and ∼30 to 55 mass% filler,2,3) usually CaCO3. Glass fiber reinforcement usually ranges from 5 to 30 mass% while glass fiber length ranges from about 3.2 to 12.7 mm (1/8 to 1/2 in).2,3) Formulations are optimized for precise dimensional control, flame resistance, high dielectric strength, corrosion and stain resistance, and color stability. BMCs are used for aerospace, automotive parts, housing for electrical wiring, and corrosion-resistant needs, hence mechanical property improvement is essential for durability and use life.
Extreme temperatures of climate change on Earth have been a serious problem, being expected to rise 4 to 5°C by 21004,5) with larger magnitudes of extreme events expected.6,7) Surface temperatures over the United States have been reported to have increased 0.8°C since the beginning of the 20th century, mostly occurring after 1980.8,9) The lower density air causes the airfoiled wing to produce less lift leading to weight restrictions or need for longer runways. On the other hand, cold temperatures can lead to reduced visibility, icing and higher propensity for brittle cracking. Climate change resulting in more frequent extreme weather events means increasingly unstable air and need for stronger materials. Coupled with that, bird-strike, volcanic rock, or hailstone pose serious problems especially at extreme temperatures.
Recently, improvements in mechanical properties of engineered materials at both low and high temperatures over that at room temperature have been attained.10) Adhesive carbon nanotube double-sided tape exhibited up to six-fold increase in adhesive strength in the temperature range of −196°C (77 K) to 1000°C (1273 K).10)
For polymers and their composites on the other hand, typically brittleness is increased at low temperatures and ductility at high temperatures, both decreasing mechanical properties. However, counter to the common behavior, we found in a highly filled short glass fiber GFRP-BMC composite, Charpy impact strength, auc at both low −79°C (194 K) and high 70°C (343 K) temperatures, were increased 69 and 32%, respectively over that at RT (293 K). These are outside the extreme operating temperature range of commercial airplane flight of −62°C (211 K) to 53°C (326 K).11)
This unexpected result has not been previously reported for the common, widely used GFRP-BMC composite. However, the high 55 mass% of CaCO3 powder filler appears to play a role of increasing the auc at both low and high temperatures. Two mechanisms we propose are: 1) difference in coefficient of thermal expansion (CTE) between polymer matrix and CaCO3 nanoparticles creating residual compressive stresses with temperature change whether cooling or heating; and 2) crossing thermal transitions in the polymers during cooling or heating enhancing residual stresses.
Polyester matrix CTE is reported to be 55 to 100 × 10−6/K12) while CaCO3 being a hard material has much lower CTE than polymers.13) Moreover, styrene-butadiene is reported to have a Tg at 208 K;14) while polyester resin is reported to transition to an increased thermal expansion coefficient between 333 and 343 K.15) CTE mismatch coupled with polymer transitions probably generate enhanced compressive residual stresses over that of polymer and glass fibers alone. Dragoi et al. reports particles in close proximity can be beneficial for thermal residual stresses to reach a maximum.16) Therefore, a stronger composite is designed.
Traditionally, to test for impact strength of transport vehicles damage by a hemispherical impactor is initiated as a point force on the center of a square or rectangular specimen ∼70 to 150 mm2 by slow point force,17–19) drop tower, or projectile.20,21) For low energy tests, impact is often followed by non-destructive testing (NDT) with an ultrasonic transducer to detect cracks undetectable to the eye which can reduce strength significantly.
Compression after impact (CAI) testing is often conducted after point impact in aerospace materials such as quasiisotropic CFRP for safety design22) and is generally implemented to evaluate against accidents such as bird strike, volcanic rock and hailstone,23) and beyond our atmosphere, space debris and micrometeriods.
On the other hand, the Charpy impact test utilizes a drop-weight pendulum with smaller samples and evaluates the impact absorption characteristics and relative impact toughness of materials often used in quality control applications employed as an inexpensive and fast way to estimate reaction to higher velocity impact. We do not claim the Charpy test to be a substitute for point impact followed by compression after impact (CAI). However, we believe Charpy impact method could possibly be used as an inexpensive preliminary evaluation to screen candidate materials to later test with indentation or projectile followed by CAI. Hence, Charpy may give a rough or better estimation of which materials and what temperatures a projectile such as bird strike, volcanic rock, hailstone, micrometeriod, or space derbis will cause the most damage. Tests are carried out calibrating for air friction and effect of air temperature and humidity on the swing and pivot of the pendulum. Therefore, we evaluate impact strength of GFRP-BMC samples at extreme 194 K and 343 K compared to 293 K.
2. Materials and Methods
2.1 Fabrication of GFRP-BMC composite
GFRP-BMC panels 304.8 × 304.8 mm (12 × 12 in) and 2 mm thick24) were provided by Premix, Inc., North Kingsville, Ohio (now Citadel) with components: 13.75 mass% propylene glycol maleate polyester resin (33 mass% styrene solution), 12.75 mass% styrene butadiene copolymer (70 mass% solution in vinyl toluene), 11 mass% commercial E-glass fibers, 55 mass% calcium carbonate filler (CaCO3), 3 mass% aluminum silicate filler (AlO)2SiO3, 0.5 mass% magnesium hydroxide Mg(OH)2, and the balance proprietary. Nominal fiber length was 6 mm. The components were mixed in a double-arm sigma blade mixer for 20 min. at room temperature prior to molding at 5.5–6.9 MPa (800–1000 psi) in a matched metal die compression mold at 422°K (149°C). A single charge mass of paste was placed in the center of the mold, compressed and cure time was 2 minutes.23) Volume fractions, Vf of glass fiber, CaCO3 filler, and remaining polymer mixture were calculated to be 0.080, 0.377, and 0.543, respectively.
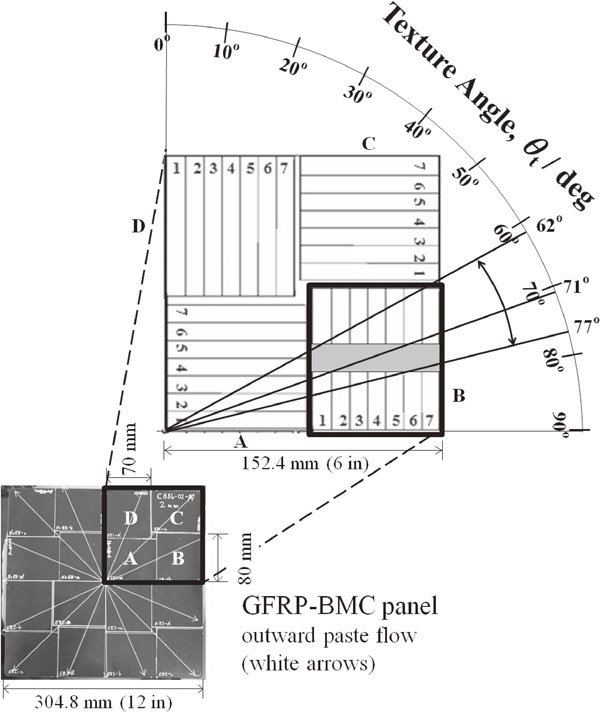
When the mold plunger compresses the charge and the GFRP-BMC paste is solidified, mold flow direction is outward from center (white arrows) in the 304.8 × 304.8 mm panel as shown in bottom of Fig. 1. The material is orthotropic, where material properties in three perpendicular axes: axial, circumferential and radial are different, similar to wood. For simplicity, isotropy is assumed across the axial 2 mm thickness and in the circumferential direction, therefore the panel was sectioned into four main quadrants (Fig. 1, bottom). To obtain texture angles, θt with respect to specimen lengths, the main quadrants were further sectioned into sub-quadrants (Fig. 1, top: A, B, C and D). Specimens were cut in accordance with ASTM D 6110-02 (2002) for anisotropic panels which calls for specimens in both lengthwise and crosswise directions.25) Figure 1 shows each sub-quadrant therefore has solidification texture angle θt (deg) and range between outward mold flow and longitudinal direction of testing sample of: θt = 17.5 ± ∼17.5 deg for section-D; 45 ± ∼45 deg (0 to 90 random) for section-A;24) 45 ± ∼10 deg for section-C; the largest possible angle in this configuration being 71 ± ∼7 deg for section-B. Note sections A, C and D were not tested. Due to circular coordinates, angle range is 62 to 77 deg taken in gray shaded impact zone with center specimen (number ‘4’) at 71 deg. Since the 71 ± ∼7 deg samples were highest in the panel and SEM/EDX observation revealed glass fibers had highest density and highest aligned orientation (due to GFs being pushed perpendicular to the outward flow of paste, therefore parallel to specimen length) they were investigated for impact strength at low and high temperatures.
To evaluate dynamic fracture toughness, Charpy impact values for the GFRP-BMC samples at 194 K, 293 K (RT), and 343 K were measured using the apparatus illustrated in Fig. 2. Unnotched Charpy impact samples were cut with a diamond cutter (MC-201, MARUTO) to dimensions 80 × 10 × 2 mm conforming to JIS K 7077-1991 testing standard.26,27)
Low temperature tests (194 K) were carried out by: Step 1: Wrapping samples in tin foil. Step 2: Immersion in slurry bath of dry ice (CO2(s)) and ethanol (CH3CH2OH) for ∼1 to 2 min. Dry ice sublimes at 194 K (−79°C) at 1 atm, however, actual bath temperatures were measured at −95°C (178 K) ± 5°C. Step 3: Immediately inserting and testing sample in Charpy impact tester with tin foil wrapping remaining around sample. During the 1 to 2 seconds between carefully removing samples from the slurry and testing, samples were assumed to warm up to about 194 K.
High temperature tests (343 K) were carried out by: Step 1: Using two hot air guns with rolled up tin foil ducts directing airflow to thermocouple at impact tester sample area of holder for sufficient amount of time obtaining temperature near 343 K. Step 2: Placing specimen in impact tester with thermocouple at center closing “chamber” of tin foil duct. Step 3: Reaching equilibrium thermocouple reading at 343 K ± 3 K after about 1 to 3 minutes. Step 4: The thermocouple and tin foil “chamber” are carefully and quickly removed. Step 5: The sample is immediately impacted.
Room temperature tests (273 K) were also carried out as control condition.
Only samples in cold condition were wrapped in tin foil. Confirmational testing showed presence or absence of tin foil wrapping appeared to have negligible effect on impact values.
A standard impact fracture energy measurement system (Shimadzu Corp. No. 51735) was employed according to JIS K 7077-199126,27) to obtain impact fracture energy, E (kJ) calculated in eq. (1)
| \begin{align}
E&=WR[(\cos\beta-\cos\alpha)\\
&\quad-(\cos\alpha'-\cos\alpha)(\alpha+\beta)/(\alpha-\alpha')]
\end{align}
| (1) |
where,
W is hammer mass (
W = 0.86 kg);
R is length of hammer weight point from pivot center (
R = 0.21 m); β is finish angle (maximum angle after impact of specimen, Radians); α is start angle before impact (α = 2.3 Radians) or 132°, and α′ is angle of a blank test without a specimen (used for calibration done three times taking the average). Here, β is always less than α′. The hammer impacts the sample across its entire width with a hemispherical tip approximately 1.5 mm in diameter. The smaller the angle β the stronger the specimen. When the Charpy impact test impact velocity,
v hitting the sample is calculated as:
28)
| \begin{equation}
v=[2gR(1-\cos\alpha)]^{0.5}
\end{equation}
| (2) |
where
g is gravitational constant (9.8 m s
−2), then
v of the hammer hitting the specimen is ∼1.74 m s
−1 (∼3.89 mi/hr). The surface area,
A of the impactor hitting the sample is small so
KE/
A is large.
Charpy impact value, auc, (kJ/m2) is calculated by the following equation:26,27)
| \begin{equation}
a_{\text{uc}}=E/(bt)
\end{equation}
| (3) |
where
b and
t are sample width and thickness (mm), respectively. The distance between supporting points was 40 mm. Evaluating the fracture probability (
Pf) has been a quick and convenient method of quantitatively analyzing experimental values relating to fracture, often used in industry to determine manufacturing reliability in quality control.
Pf is expressed by the following equation which is a generalized form of the median rank method:
29)
| \begin{equation}
P_{\text{f}}=(I-0.3)/(N_{\text{s}}+0.4)
\end{equation}
| (4) |
where
Ns and
I are total number of samples and the ascending strength order of each sample, respectively.
2.3 Scanning electron microscopy (SEM)
A Jeol JSM-35CF scanning electron microscope (SEM) was used to observe Pt sputtered fracture surfaces of the compression-molded BMC samples.
3. Results
3.1 Effect of temperature on Charpy impact value
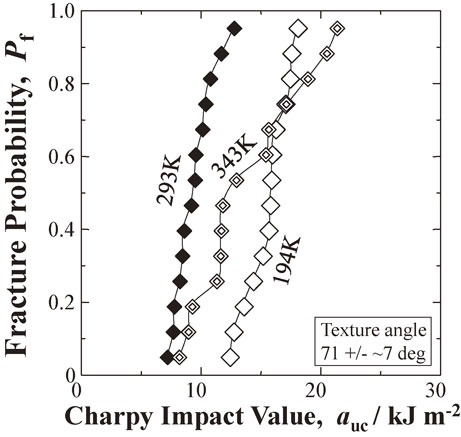
Experimental results in Fig. 3 show unexpectedly both decreasing (194 K) and increasing (343 K) the test temperature apparently improves Charpy impact value, auc (kJ m−1) over RT (293 K) at all statistical fracture probabilities (Pf) of the high solidification texture angle 71 ± ∼7 deg BMC-GFRP compression molded samples.
Table 1 lists the auc as a function of temperature for low-, median- and high-fracture probability, Pf from the plot in Fig. 3. At low Pf = 0.049 of weakest samples in the data sets, often an indicator of reliability, cooling the samples to 194 K increased the Charpy impact value, auc 73% over RT (293 K) from 7.20 to 12.44 kJ m−2; while heating the samples to 343 K increased the auc (at low-Pf = 0.049) 13% over RT from 7.20 to 8.19 kJ m−2.
At median-Pf = 0.50, cooling the samples to 194 K increased the auc 69% over RT from 9.36 to 15.86 kJ m−2; while heating the samples to 343 K increased the auc 32% over RT from 9.36 to 12.39 kJ m−2.
Moreover, at high-Pf = 0.95, cooling the samples to 194 K increased the auc 42% over RT from 12.79 to 18.11 kJ m−2; while heating the samples to 343 K increased the auc 67% over RT from 12.79 to 21.38 kJ m−2. Hence auc was improved at both the cold and hot temperatures over that of RT.
3.2 Comparing auc of cold and hot samples
Figure 3 shows at Pf < 0.60 cooling the samples to 194 K yielded higher auc than the hot 343 K; while at Pf > 0.80 the hot 343 K samples had higher auc than the cold (194 K). From 0.60 < Pf < 0.80 the cold and hot samples had approximately equal auc. Nevertheless, Fig. 3 shows at all Pf, all auc for cold and hot samples were higher than those at 293 K.
4. Discussion
4.1 Weibull analysis: 2-parameter
The 2-parameter Weibull coefficient (n) is one of the standard parameters to compare with other structural materials30–32) and is often used in quality control (QC). When auc is the measured Charpy impact value and is a constant, the fracture probability (Pf) as a function of risk of rupture (auc/ao) is expressed by the following equation:30–32)
| \begin{equation}
P_{\text{f}}=1-\exp[-(a_{\text{uc}}/a_{\text{o}})^{n}]
\end{equation}
| (5) |
The linear relationship can be obtained by the following equation:
| \begin{equation}
\ln[-{\ln}(1-P_{\text{f}})]=n\ln a_{\text{uc}}-n\ln a_{\text{o}}
\end{equation}
| (6) |
Figure 4 shows 2-parameter Weibull plots for the three data sets. Although increasing the temperature from 293 to 343 K reduces the Weibull modulus (slope), n from 6.61 to 3.57; decreasing to 194 K raises n 46% from 6.61 to 9.66.
4.2 Estimating low impact value, auc at Pf = 1.0 × 10⁻⁵ for safety design
To obtain a statistically low impact value for safety design, the low auc value at Pf = 1.0 × 10⁻⁵ is assumed to be attained from the adaptable relationship of the 3-parameter Weibull equation iterating to the highest correlation coefficient (F) for the lowest as value at Pf = 0 (as).30–33) The Pf depends on the risk of rupture ([eas − as]/aIII)30–33) is:
| \begin{equation}
P_{\text{f}}=1-\exp[-([^{\text{e}}a_{\text{s}}-a_{\text{s}}]/a_{\text{III}})^{m}]
\end{equation}
| (7) |
Rearranging into the linear logarithmic form:
| \begin{equation}
\ln[-{\ln}(1-P_{\text{f}})]=m\ln(^{\text{e}}a_{\text{s}}-a_{\text{s}})-m\ln a_{\text{III}}
\end{equation}
| (8) |
The values of
aIII and
m are determined by the least-squares best fit method. The
m value is estimated by the slope of the relationship when
eas =
as. Hence, to obtain the
auc at extremely low-
Pf of 1 × 10
−5 eq. (8) is rearranged:
| \begin{equation}
\ln(^{\text{e}}a_{\text{s}}-a_{\text{s}})=[\ln[-{\ln}(1-P_{\text{f}})]+m\ln a_{\text{III}}]/m
\end{equation}
| (9) |
| \begin{equation}
a_{\text{uc}}=\exp([\ln[-{\ln}(1-P_{\text{f}})]+m\ln a_{\text{III}}]/m)+a_{\text{s}}
\end{equation}
| (10) |
shows the
auc at
Pf = 1 × 10
−5 are 4.97, 6.68 and 7.30 kJ m
−2 for the 194, 273 and 343 K sample sets respectively, increasing with temperature.
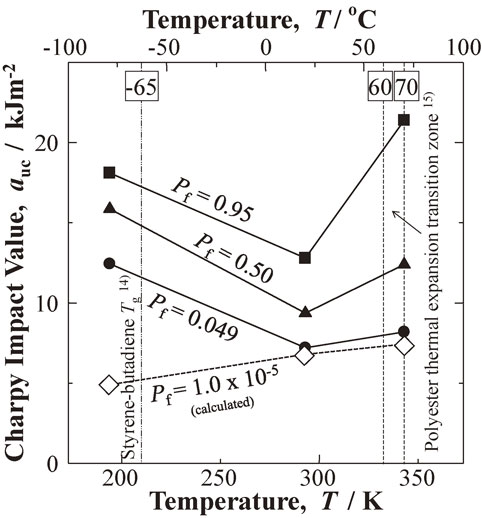
4.3 Effect of transition temperatures raising impact value of BMC for both cold and hot temperatures
Counter to intuition, the experimental results in Fig. 5 show that transition temperatures raise the auc of the BMC as improvements at low-, medial- and high-Pf (0.049, 0.50 and 0.95) under both the cryogenic and hot temperatures (vertical dotted lines). Figure 6 illustrates the typical fracture mechanisms of GFRP-BMC samples at 194, 293 and 343 K showing typical number of cracks (white lines) on tensile surface side from impact. As expected as experimental test temperature is increased, number of observed cracks on tensile side is decreased.
4.3.1 Strengthening mechanisms from nanoparticle CaCO3 filler
Two strengthening mechanisms are proposed. Firstly, the auc enhancements appear to be due to coefficient of thermal expansion (CTE) difference between polymer matrix and CaCO3 nanoparticles generating residual compressive stresses during cooling, or heating. Polyester matrix CTE is reported to be 55 to 100 × 10−6/K12) while CaCO3 being a hard material has much lower CTE than polymers.13) Secondly, thermal transitions exist in the polymers. Styrene-butadiene is reported to have a Tg at 208 K;14) while polyester resin is reported to transition to an increased thermal expansion coefficient between 333 and 343 K.15) With the ultra-high surface area of CaCO3 particles during heating or cooling of the finished samples, CTE mismatch coupled with polymer transitions probably generate enhanced compressive residual stresses over that of polymer and glass fibers alone.
4.3.2 Increase of auc at low temperature of 194 K
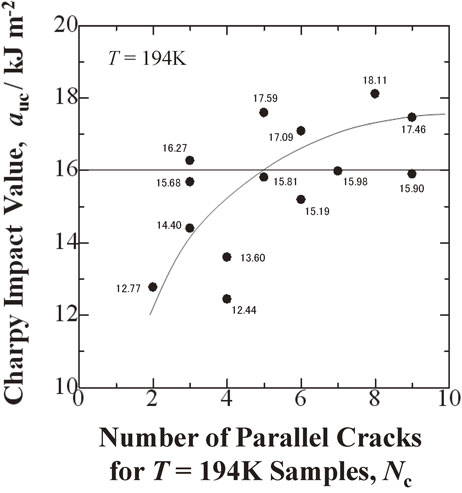
When the temperature of the styrene-butadiene component is cooled to 194 K below Tg reported as about 208 K (−65°C)29) it transitions from rubber-like to a hard and brittle state explaining the rise in impact values over those at 273 K. This is illustrated in Fig. 5 left dotted line. In the 194 K samples between 2 to 9 cracks parallel to and nearly spanning the width of tensile surface side were observed. The hardness spreads out the impact energy, hence cracks are dispersed collectively at a higher surface area absorbing more energy raising the impact values. Figure 7 shows Charpy impact value, auc appears to be roughly related to number of observable large cracks, Nc on tensile side indicating impact energy absorption. Nc increases exponentially with increasing auc the asymptote maxing out at 16.0 < auc < 18.0 kJ m−2 with number of cracks Nc = 9.
Figure 8 shows an approximate linear logarithmic relation for low temperature data in Fig. 7:
| \begin{equation}
\log_{10}a_{\text{uc}}=0.0135N_{\text{c}}+1.12
\end{equation}
| (11) |
as a simple predictive model for number of cracks expected,
Nc as a function of impact toughness,
auc. The model predicts the impact fracture will occur easily without secondary cracks below log
10 auc = 1.12 or (
auc = 13.18 kJ m
−2) so caution is recommended during processing.
4.3.3 Increase of auc at high temperature of 343 K
For high temperatures, Tg of the polyester component of the GFRP-BMC is reported by the manufacturer to be about 453 K (180°C) (above the compression mold temperature of about 422 K, 149°C) as a broad transition Tan Delta peak. The 422 K is above the high 343 K testing temperature and is not considered to influence the BMC at 343 K.
Therefore, to explain the high impact values at 343 K, Figure 9 shows a pseudo second-order transition; i.e. a glass transition is reported to exist for polyester resin15) as a rise in thermal expansion between 333 and 343 K (60 to 70°C)15) also indicated by right two dotted lines in Fig. 5. There exists two linear regions: from 298 to 333 K (lower slope) and from 343 to 383 K (higher slope).15) When the experimental temperature is raised above 333 K, the increase in thermal expansion probably generates compressive forces within the polymer component, on the glass fiber and CaCO3 filler particle surfaces increasing auc.

Normally at the glass transition, the Gibbs free energy, G for cooperative movement of chains would be exceeded and entropy, S increased by expanded structure changing the polymer from a hard and brittle glassy state to a viscous rubbery state. This would make the polymer more soft and flexible: polymer chains would slide past each other more easily the material behaving as an extremely viscous liquid. However, the addition of plasticizer whose small molecules are lodged between and within the polymer chains may bond the network structure at critical range between 333 and 343 K. This may occur when free volume exceeds a certain value by heat expansion. The spaces between chains probably increase above a critical level giving the plasticizer room to connect the chains more efficiently at the Tg from 333 to 343 K making a strong network 3-D structure. A model of delocalized atoms34) appears to quantify this free volume as “fluctuation volume” ΔVe which occurs from thermal displacements of particles from their equilibrium locations:34,35)
| \begin{equation}
\Delta V_{\text{e}}=N_{\text{e}}\Delta v_{\text{e}}
\end{equation}
| (12) |
where
Ne is number of delocalized atoms, and Δ
ve is displacement of active atoms from their equilibrium positions. It follows the mobility of delocalized atoms is expressed by the fraction of fluctuation volume for amorphous systems:
34)
| \begin{equation}
f=\Delta V_{\text{e}}/V
\end{equation}
| (13) |
As
f increases by thermal expansion from increasing temperature it becomes
fg at the glass transition which is reported to be about 0.025 for polymers.
34) When this is reached the plasticizer probably forms bridges allowing expanded tighter structure with the added benefit of increased ductility raising the
auc at 343 K.
While Fig. 6 shows the 293 K samples had few to many confined cracks most not spanning tensile surface, samples at 343 K had no or very slight surface cracks. Hence, impact values are increased at 343 K by increasing toughness with no or little cracking on tensile side.
Since 343 K is on the upper end of the thermal expansion band in Fig. 9 it may also explain the high variance in auc from 8.10 to 21.38 kJ m−2.
4.4 SEM of fracture surfaces
Figures 10(a)–(c) show SEM photos of fracture surfaces of the 194, 293 and 343 K samples, respectively, all at Pf = 0.465. Pf = 0.465 is a value closest to the statistical mean (Pf = 0.500) in the 14 sample data sets hence, their fracture mechanisms are regarded as representative.
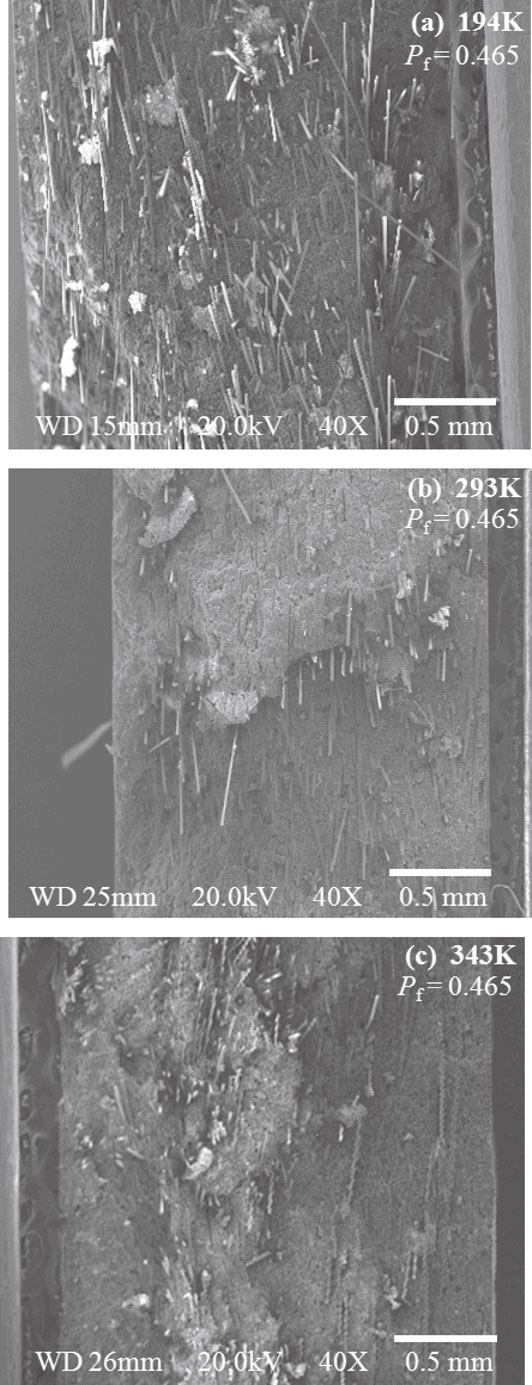
The 194 K sample of Fig. 10(a) shows increased bare fiber protrusion lengths relative to samples at 293 and 343 K probably from increased cracks near main crack exposing the fiber lengths. On the other hand, the 343 K sample (c) shows a smoother surface than the lower temperature 293 and 194 K samples indicating increased ductility of the polymer matrix at the higher temperature with few or no cracks near the main crack with less fiber lengths exposed. These fracture mechanisms apparently contribute to the rise in auc of the BMC-GFRP at both low (194 K) and high (343 K) temperatures. These fracture mechanisms agree with the surface crack observations in Fig. 6 and apparently contribute to the rise in auc of the BMC-GFRP at both low (194 K) and high (343 K) temperatures.
5. Conclusions
Charpy impact tests were carried out on a highly-filled compression molded polyester glass fiber reinforced bulk molding compound (GFRP-BMC) with samples taken from highest solidification texture flow angle from orthotropic mother panel (θt of 71 ± ∼7 deg).
-
(1)
Results unexpectedly showed Charpy impact values (auc) were increased over that at RT (293 K) when tested at both low 194 K and high 343 K temperatures, beyond the extreme operating temperature range of air flight of 211 K (−62°C) and 323 K (50°C).
-
(2)
At the cold test temperature of 194 K at statistical low-, medial- and high-fracture probabilities Pf = 0.049, 0.50 and 0.95, auc were increased 73%, 69% and 42%, respectively. Moreover, at the hot test temperature of 343 K at low-, medial- and high-Pf = 0.049, 0.50 and 0.95, auc were increased over that at RT 13%, 32% and 67%, respectively. Namely, at both the low 194 K and high 343 K temperatures, auc was increased at all fracture probabilities, Pf over that at 293 K.
-
(3)
The high 55 mass% of CaCO3 powder filler appeared to play a role of increasing the auc at both low and high temperatures. Two strengthening mechanisms are proposed. Firstly, the auc enhancements appear to be due to coefficient of thermal expansion (CTE) difference between polymer matrix and CaCO3 nanoparticles generating residual compressive stresses during cooling, or heating. Secondly, thermal transitions in the polymers are crossed at both the low and high test temperatures further creating residual stresses. With the ultra-high surface area of CaCO3 particles during heating or cooling of the finished samples, CTE mismatch coupled with polymer transitions probably generate enhanced compressive residual stresses over that of polymer and glass fibers alone.
-
(4)
The improvement of auc at 194 K was apparently due to cooling below the Tg of styrene-butadiene component reported as 208 K. Improvement at the high temperature 343 K was due to transition to increased thermal expansion coefficient of polyester resin component (reported between 333 and 343 K) creating internal compressive forces.
-
(5)
Optical observation of specimens showed number and size of surface cracks on tensile side increased, i.e. brittleness increased with decreasing temperature.
-
(6)
In the 194 K samples, number of parallel cracks spanning most or all of specimen thickness increased exponentially with increasing auc with asymptote maxing out at about auc = 16 to 18 kJ m−2 absorbing increased fracture energy.
-
(7)
SEM observation showed increased bare fiber exposed length from the 194 K sample and smoother fracture surface in the 343 K sample compared to that of 293 K sample.
-
(8)
We unexpectedly found in a highly filled short glass fiber GFRP-BMC composite, impact strength at both low and high temperatures, beyond the extreme operating temperature range of air flight were increased significantly over that at RT. This was a new finding for the common, widely used composite of GFRP-BMC.
Acknowledgements
This work was partly supported by the JSPS (Japan Society for the Promotion of Science) Core-to-Core Program, A. Advanced Research Networks, “International research core on smart layered materials and structures for energy saving”. The authors extend their sincere gratitude to Shigehito Inui, Takumi Okada and Juanha Quan for their great assistance with SEM and temperature testing. Citadel, Inc., is gratefully acknowledged for fabricating the GFRP-BMC panels.
REFERENCES
- 1) Markets and Markets (2015). Available at: http://www.marketsandmarkets.com/Market-Reports/sheet-bulk-molding-compound-market-186191200.html, (accessed 8 June 2016). Code: CH 4081.
- 2) M. Faudree, A. Hiltner, E. Baer and J. Collister: J. Compos. Mater. 22 (1988) 1170–1195.
- 3) M. Faudree and Y. Nishi: Mater. Trans. 51 (2010) 2304–2310.
- 4) D.L. Hartmann, A.M.G.K. Tank, M. Rusticucci, L.V. Alexander, S. Brönnimann, Y. Charabi, F.J. Dentener, E.J. Dlugokencky, D.R. Easterling, A. Kaplan, B.J. Soden, P.W. Thorne, M. Wild and P.M. Zhai: Climate Change 2013: The Physical Science Basis, ed. by T.F. Stocker et al., (Cambridge University Press, 2014) pp. 159–254.
- 5) R. Moss, J. Edmonds and K. Hibbard: Nature 463 (2010) 747–756.
- 6) E.M. Fischer, U. Beyerle and R. Knutti: Nat. Clim. Chang. 3 (2013) 1033–1038.
- 7) D.R. Easterling, G.A. Meehl, C. Parmesan, S.A. Changnon, T.R. Karl and L.O. Mearns: Science 289 (2000) 2068–2074.
- 8) J. Walsh et al.: Climate Change Impacts in the United States: The Third National Climate Assessment, ed. by J.M. Melillo, T.C. Richmond and G.W. Yohe, (U.S. Global Change Research Program, 2014) pp. 19–67. doi:10.7930/J0KW5CXT.
- 9) Global Climate Change Impacts in the United States, ed. by T. Karl, J.M. Milello and T. Peterson, (Cambridge University Press, 2009) p. 188.
- 10) M. Xu, F. Du, S. Ganguli, A. Roy and L. Dai: Nat. Commun. 7 (2016) 1–8.
- 11) E. Coffel: Weather Clim. Soc. 7 (2015) 94–102.
- 12) ASM Engineered Materials Reference Book, 2nd ed., ed. by M. Bauccio, (ASM International, Materials Park, Ohio, 1994).
- 13) T.S. Kulkarni and A.K. Jain: IOSR J. Eng. 2 (2012) 32–37.
- 14) A.K. Van der Vegt: From Polymers to Plastics, (Delft University Press, Netherlands, 2005).
- 15) L.C. Sengupta and W.A. Spurgeon: Thermal expansion measurements of polymer matrix composites and syntactics. Report MTL-TR 92-27, (Unclassified. US Army Laboratory Command, Materials Technology Laboratory, Waterton Massachusetts, 4.1992) pp. 1–11.
- 16) D. Dragoi, E. Ustundag, B. Clausen and M. Bourke: Scr. Mater. 45 (2001) 245–252.
- 17) Y. Nishi, N. Tsuchikura, S. Namba, T. Yamamoto and M.C. Faudree: Mater. Trans. 53 (2012) 1288–1294.
- 18) T. Okada, M.C. Faudree, N. Tsuchikura and Y. Nishi: Mater. Trans. 57 (2016) 305–311.
- 19) American Society for Testing and Materials: ASTM D 6264-98, (1998).
- 20) K. Imielińska, L. Guillaumat, R. Wojtyra and M. Castaings: Compos. Part B 39 (2008) 1034–1041.
- 21) A.S. Vaidya, U.K. Vaidya and N. Uddin: Mater. Sci. Eng. A 472 (2008) 52.
- 22) M. Aktaş, R. Karakuzu and Y. Arman: Compos. Struct. 89 (2009) 77.
- 23) V. Kostopoulos, A. Baltopoulos, A. Vavouliotis and A. Paipetis: Compos. Sci. Technol. 70 (2010) 553.
- 24) M.C. Faudree, Y. Nishi and M. Gruskiewicz: Mater. Trans. 53 (2012) 1412–1419.
- 25) American Society for Testing and Materials: ASTM D 6110-02, (2002).
- 26) Japanese Industrial Standards Committee: JIS K 7077, (1991).
- 27) Y. Nishi, K. Inoue and M. Salvia: Mater. Trans. 47 (2006) 2846–2851.
- 28) J. Splett, H. Iyer, C. Wang and C. McCowan: National Institute of Standards and Technology (NIST) Recommended Practice Guide, Computing Uncertainty for Charpy Impact Test Machine Test Results; Special publication 960-18, (US Department of Commerce, Boulder, Colorado, 2008) pp. 27–29.
- 29) T. Nishida and E. Yasuda: Evaluation of Dynamic Properties of Ceramics (Ceramics no rikigaku tokusei hyouka), (Nikkan Kogaku Shimbun Sha, Tokyo, 1986) p. 50.
- 30) W. Weibull: Ingeniörs Vetenskaps Aka Akademien, nr. 151, (Generalstabens Litografiska Anstalts Förlag, Stockholm, 1939) p. 1214.
- 31) Y. Nishi and M. Salvia: Mater. Trans. 47 (2006) 2846–2851.
- 32) J.B. Quinn and G.D. Quinn: Dent. Mater. 26 (2010) 135–147.
- 33) Y. Nishi, H. Kobayashi and M. Salvia: Mater. Trans. 48 (2007) 1924–1927.
- 34) D.S. Sanditov: J. Exp. Theor. Phys. 115 (2012) 112–124.
- 35) D.S. Sanditov and M.I. Ojovan: Physica B 523 (2017) 96–113.