Abstract
The stability of cuboidal γ′ precipitates under heavy irradiation was studied for newly developed Ni-based Oxide Dispersion-Strengthened (ODS) superalloys, to explore the suitability of these as core structural materials in Very High-temperature Reactors (VHTR) or Gas-cooled Fast Reactors (GFR). Ion irradiation was applied at a dose level of 100 dpa at 873 K, 1073 K and 1273 K. Under these conditions, γ′ precipitates retained their cuboidal shape at 873 K, were deformed somewhat at 1073 K (as predicted by the Nelson-Hudson-Mazey (NHM) model), and were massively deformed and agglomerated at 1273 K. This deformation-agglomeration process is attributed to cascade collision, whereby the increased Gibbs free energy of the disordered phase induces a change in element distribution inside the irradiated area. Ordered, cuboidal γ′ precipitates were reproduced from the disordered state after cooling and the cessation of ion irradiation.
1. Introduction
Some Ni-based alloys which are superior to Fe-based alloys in terms of high-temperature creep strength are potential candidates for use as core materials in Very High-Temperature Reactor (VHTR) or Gas-cooled Fast Reactor (GFR) nuclear reactors, because their operating temperatures extend to 1273 K under typical VHTR and GFR conditions of 100 dpa.1) Currently, Ni-based alloys are expected to use as internal core component materials.2) However, the low radiation-resistance of Ni-based alloys has limited their use in core components of nuclear reactors. For example, irradiation-generated volume expansion- and grain-boundary embrittlement-driven void swelling, resulting from helium atoms created through the transmutation of Ni, is seen in Hastelloy® X, which is used in current High-Temperature Test Reactors (HTTR).3,4) Reduction of strength and grain-boundary embrittlement were also observed in Nimonic® PE16 irradiated in the mid-to-high temperature range of 800–1000 K, where spherical γ′ precipitates have previously dissolved and re-precipitated at 698 K along the sink-sites of this alloy, which in this case were grain boundaries or dislocations.5–8)
To overcome these challenging properties of the Ni-based alloys, we have developed Ni-based Oxide Dispersion-Strengthened (ODS) superalloys, and proven the resistance of these materials to cavity development and accumulation along grain boundaries, a property which results from their high dispersion of fine oxide particles.9,10) These oxide particles, dispersed at a concentration of 1022–1023/m3, can effectively absorb the helium atoms and are uniquely suited to restrain void swelling and grain-boundary embrittlement resulting from irradiation, and thus to inhibit the development of defects due to irradiation.9–11) Compared with the other precipitates such as carbides for the typical strengthening particles in the steels, they grow up and are no longer effective for embrittlement resistance at the high-temperature required for GFR. Confirming that the γ′ precipitates are the major contributor to high-temperature strength. In the previous study, the thermal stability of γ′ precipitate is maintained up to 1273 K,12,13) but response of γ′ precipitates to irradiation was little investigated. In the present study, we examined the stability of the cuboidal γ′ precipitates in a new Ni-based ODS superalloy, produced as a modification of Ni-based superalloy used in gas turbines and jet engines.
This Ni-based ODS superalloy contains cuboidal shape γ′ precipitates with coherent interfaces against Ni-based matrix. The volume fraction of γ′ precipitates is almost 75%, compared with Nimonic® PE 16 that contains only 25% spherical shape of γ′ precipitates with incoherent interfaces. As such, this study, we aim to clarify the stability of coherent cuboidal type of γ′ precipitates in Ni-based ODS superalloy under heavy ion irradiation for use in core materials of VHTR or GFR nuclear reactors.
2. Experimental Procedure
A sample of Ni-based ODS superalloy with a cuboidal γ′ precipitate substructure (MS4) was produced by modifying the commercial superalloy CMSX10®. The pre-alloyed powder and Y2O3 powder were mechanically alloyed (MAed) by attrition type of ball mill at 190 rpm in He/4%H2 gas atmosphere for 48 hours, with subsequent consolidation of the MS4 products by hot extrusion at 1473 K. Table 1 shows the chemical composition of the sample, where ‘Ex. O’ means excess oxygen, which can be calculated by subtracting oxygen coupled with yttrium from the total oxygen.14) This oxygen enable formation of the fine Y–Zr or Y–Hf complex oxide particles. A 50 mm × 10 mm × 2 mm section was cut from the hot extruded bar and subjected to zone annealing (ZA) at 1523 K with a coil-moving speed of 0.8 mm/min, to give a sample composed of large columnar grains. The γ′ precipitates in this sample were found to be non-uniform in distribution, and the samples were therefore further solution treated at 1563 K for 3 hours, and then air-cooled, followed by ageing at 1323 K for 4 hours, and finally air-cooled. This yielded a material (MS4) having a uniform distribution of cuboidal γ′ precipitates. Such heat-treatment temperatures were selected accordingly with the PANDAT™ software that was developed on the basis of the CALPHAD (CALculation of PHAse Diagram) approach.15)

After these steps, the sample of MS4 was cut into small pieces, and the surfaces of these were polished to a mirror-like luster. Ionic irradiation was carried out at the Dual-Beam Facility for Energy Science and Technology (DuET) facility at Kyoto University. The samples were irradiated with Fe3+ ions of 6.4 MeV to simulate the primary knock-on atom (PKA), as it is very difficult to reproduce the actual neutron-driven irradiation process which occurs in the reactor. The effects of Fe ions doping and thus composition change on the γ′ precipitates in Ni-based ODS superalloy is confirmed not to be dominant.9,10) Irradiation temperatures and time were controlled at 873 K, 1073 K and 1273 K and 10 hours. Ionic beam-currents were measured by using a Faraday cup placed in front of the sample chamber. Total displacement damage was estimated by SRIM 2011.16) Ion-irradiated specimens have a damage gradient from the irradiation surface to the inside of the material, and maximum damage was 100 dpa at approximately 1450 nm from the cross-section of the irradiated surface. The irradiation conditions are shown in Table 2.14) Thin films were cut from the cross-section of the irradiation surface using a focused-ion-beam (FIB; JEOL JIB-4600F/HKD), and inspected for microstructural damaged by transmission electron microscopy, high-angle annular dark-field imaging and scanning transmission electron microscopy (STEM). These images were taken by JEOL JEM-2010 and an aberration-corrected FEI Titan3 G2 60–300 microscope, operated at 200 and 300 kV, respectively. Energy-dispersive characterization (EDS) via quantitative plane analytical method at 10–20 points was performed in STEM mode at 300 keV and at a resolution of 70 pm to obtain elemental-mapping data. The beam-damage induced by the FIB was removed by low-energy Ar ion milling (1.0 kV) and subsequent polishing (0.3 kV). The average size of γ′ precipitates in the resulting material was estimated from their area by using the free image processing software ImageJ, assuming that the γ′ precipitates keeps cuboidal in shape.

3. Results
Figure 1 shows STEM-EDS mapping of Cr, Co, Ta, and Al, to determine shape and diffraction patterns of γ′ precipitates in the area irradiated at 873 K, 1073 K, and 1273 K.14) The Ta and Al were selected as dominant constituting element for γ′ precipitates, and Cr and Co as dominant constituting element for γ matrix, and therefore have the greatest effect on phase-transformation. The irradiated area is labeled “Irr.,” and the unirradiated is labeled “Unirr.” (and was instead thermally annealed for 10 hours); accordingly, comparison of these differently treated areas enables the effect of irradiation to be determined.

Under irradiation, the γ′ precipitate was found to expand and maintain its shape at 873 K, but collapse at 1073 K. At 1273 K, the cuboidal shape of γ′ precipitates was not observed, and Al, a main constituent element of the γ′ precipitates, was distributed throughout the irradiated area, while the distribution of matrix element Cr was attenuated. The arrows in the diffraction pattern show the order of the lattice reflection, which can be clearly observed at all of the irradiation temperatures.
The results of the EDS quantitative analysis to estimate the composition of the irradiated area at 1273 K are shown in Fig. 2.14) The element concentration in γ and γ′ precipitates were averaged over 10 points at the γ and γ′ precipitates in the unirradiated area, and the value of 1273 K irr was the average of 20 points in the irradiated area. It can be seen that the composition of the irradiated area is almost equal to the total amount of γ′ precipitates. Thus, the results of the diffraction pattern and the EDS quantitative analyses indicate that, at 1273 K, the whole of the irradiated area is transformed into γ′ precipitates.

Figure 3 shows the size of γ′ precipitates, as determined by analysis of equivalent circular at the irradiated and unirradiated areas, and by comparison to the average size of the γ′ precipitates after sample preparation (296 nm).14) Regarding the thermal stability of γ′ precipitates in the unirradiated area, the average size of γ′ precipitates does not change much at 873 K, but increases at 1073 K and 1273 K; the observed increase in growth rate with increasing temperature is likely due to Ostwald ripening. In the irradiated area, the γ′ precipitates grow to 526 nm at 873 K, and to 577 nm at 1073 K. The size of γ′ precipitates at 1273 K is not shown in the graph because the shape of γ′ precipitates is at this temperature is highly variable, meaning than an average precipitate size cannot be determined.
4. Discussion
It can be seen that the growth of the γ′ precipitates is accelerated by irradiation. The relationship between the growth rate and the sizes of the γ′ precipitates can be estimated by applying the Nelson, Hudson, and Mazey (NHM) model,17) which has been used to predict the growth rate and sizes of spherical γ′ precipitates in Nimonic® PE16. Based on the NHM model, the growth rate of the γ′ precipitates is expressed as follows in eq. (1):
| \begin{equation}
\frac{dr}{dt} = -\psi K + \frac{D + D^{'}}{r} \left[ \frac{3C}{4\pi p} - nr^{3} \right]
\end{equation}
| (1) |
where
r,
t, ψ,
K,
D,
D′,
p,
n are the average radius of γ′ precipitates [m], time [sec], the dissolve parameter of γ′ precipitates [m], the damage rate [dpa/sec], the diffusion constant [m
2/sec], the diffusion constant by collision [m
2/sec], the concentration of solution atom in γ′ precipitates and the number density of the γ′ precipitates [/m
3], respectively. The solute atoms are Al and Ta.
C is calculated according to
eq. (2):
| \begin{equation}
C = \frac{4}{3}\pi pnr^{3} + c
\end{equation}
| (2) |
where
c is the concentration of solute atoms in the matrix.
Equation (2) is the boundary condition when the number of all solute atoms in the material should be the sum of
p and
c.
The first term in eq. (1), r, is a measure of the rate of the disordering dissolution of the γ′ precipitates an outflow of solute atoms from the γ′ precipitates into the matrix which results from cascade damage and depends on the concentration gradients in this area.
ψ in eq. (1) is the dissolving parameter of γ′ precipitate, which can be estimated the product of shell thickness (l) and fraction (f).17) Cascade damage results in the loss of solute atoms in a shell of thickness l at the precipitate surface by diffusion to the matrix. In this case, the parameter l will be the cascade size — i.e., 10 nm in the case of heavy-ion irradiation.18) If we assume that only a fraction f of solute atoms actually become dissolved, the second term in eq. (1) represents the growth of γ′ precipitates which occurs by back-diffusion of solute atoms into the matrix.
Figure 4 shows NHM modeled growth rate data for γ′ precipitates of a certain radius, estimated by using the parameters of the present conditions (listed in Table 3) and the actual values measured at each temperature (as per Fig. 1) are also plotted by solid square and circle. In this calculation, experimental data were used for K and n. D and D′ are calculated at each temperature by using Ref. 17), and ψ is an order of 10−8 [m].

Table 3 The parameters of the γ′ precipitates growth-rate equation at 873, 1073 and 1273 K.
The calculated data in Fig. 4 show that, in samples which are irradiated for an infinite time at each temperature, the radii of γ′ precipitates converges at the radius where the growth rate of the γ′ precipitates is zero i.e., the estimated radii are 185 nm, 215 nm, 235 nm at 873 K, 1073 K, and 1273 K, respectively. In comparison, the experimental data give γ′ precipitates’ radii as 263 nm, 280 nm, and infinite at 873 K, 1073 K, and 1273 K, respectively. Thus, it can be seen that these values estimated by the NHM model are close to the results of the experiments at 873 K and 1073 K.
The volume fraction of γ′ precipitates in the study material (MS4) is 70%, while the volume fraction of γ′ precipitates in Nimonic® PE16 (the reference material for the NHM model) is 10.8%.19) In addition, the interfacial coherency between the matrix and the γ′ precipitates in MS4 is approximately 0.5%, while the interface of the matrix and γ′ precipitates in Nimonic® PE16 is fully incoherent interface. Although the sample conditions for the calculation and experiment are different, the similarity of calculated and experimental data at 873 K and 1073 K suggests that primary factor governing the extent of disordering dissolution and back-diffusion of the solute atoms is the stability of γ′ precipitates, and that the volume fraction and interfacial coherency of the γ′ precipitates are of secondary importance.
At 1273 K, the experimental result deviates from the value calculated by the NHM model, which may be because γ′ precipitates discontinuously increase in size at this higher temperature.
It is considered that the disordering of the ordered γ′ precipitates by cascade collision at 1273 K results in Gibbs free energy increase for the γ′ precipitates Fig. 5(a) and (b) depict the Gibbs free energy of the γ (matrix) and γ′ precipitates in terms of Al concentration, as Al was the main constituent of the γ′ precipitates before and after irradiation. Gibbs free energy was calculated by using PANDAT™ software. Assuming that the Gibbs free energy of γ′ precipitates increases via disordering by, for example, 2000 J, the Gibbs free energy also increases by 2000 J due to irradiation. From tie-line analyses, Al concentration ratios in γ (matrix) and γ′ precipitates can be estimated, as shown in Figs. 5(c) and (d). Accordingly, it can be seen that with increasing temperature, the relative Al concentration in the γ matrix approaches that of γ′ precipitates. These data could explain the uniform Al distribution observed in the irradiated area at 1273 K.

Figures 6(a) and (b) show the Gibbs free energies for γ′ precipitates and γ matrix in terms of Cr concentration, and (c) and (d) show the relative Cr concentration in γ (matrix) and γ′ precipitates estimated by the calculation. Cr was selected as the representative element of the γ matrix and it replaces the Al or Ta.20) It was found that Cr concentration in γ matrix decreases to that seen in γ′ phase. From the Gibbs free energy analysis, similar tendency were shown in terms of Ta for representative γ′ precipitate element and in Co and W for representative γ matrix elements.
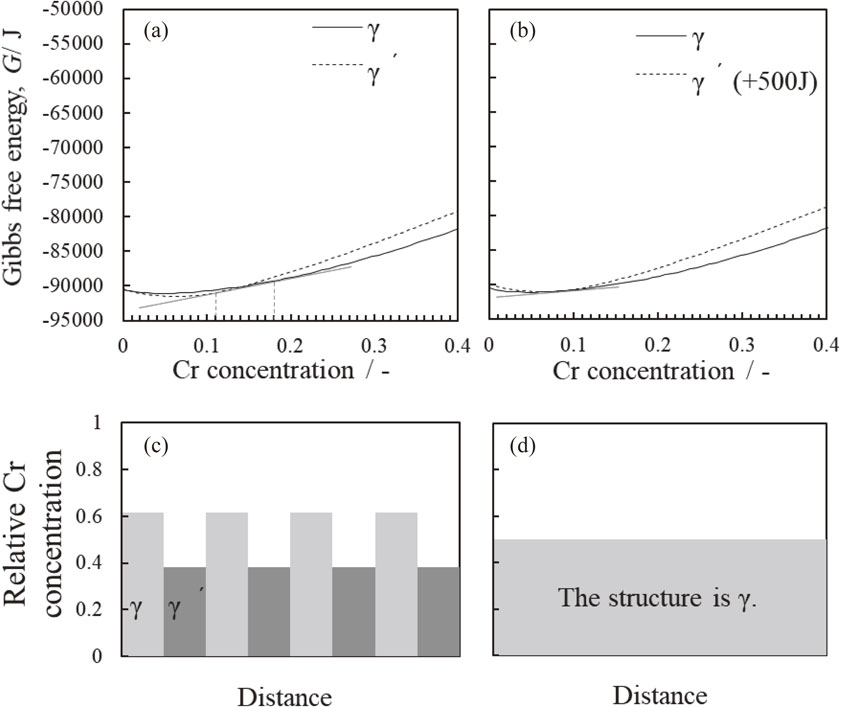
Figure 7 shows the changes of Al and Cr concentration ratios in response to Gibbs free energy changes induced by cascade collisions at 873 K, 1073 K, and 1273 K. For higher temperature irradiation of 1273 K, Al (Cr) concentrations in γ′ precipitates and γ matrix have a similar level of lower energy increase, although the exact Gibbs free energy increase due to irradiation is currently unknown. Results of Fig. 1 showing that Al is enriched and Cr is depleted in the area irradiated at 1273 K could be explained by supposing that Gibbs free energy of the γ′ precipitates increases by some degree due to an ordered-to-disordered transformation induced by the cascade collision. Cr and Co levels in the γ matrix were depleted in the irradiated area, which may be due the lower sublimation pressure of these elements enabling their selective removal from the surface during irradiation.21,22)

The results summarized in Fig. 8 show the morphology change of the γ′ precipitates subsequent to ionic irradiation at 1273 K. Before irradiation, the γ′ precipitates had a L12 ordered structure comprising Ni3(Al, Ta) and one cascade collision leads to a disordering of this structure, and a resultant increase in the Gibbs free energy of γ′ precipitates. Under irradiation, Al (Ta) and Cr (Co) elements are redistributed so as to maintain their equilibrium chemical potential at γ′/γ interface. As a result of this redistribution process, the irradiated area is enriched in γ′ precipitate constituent elements such as Al and Ta, and depleted of γ matrix elements Cr and Co.
5. Conclusion
The behavior of γ′ precipitates in a new Ni-based ODS superalloy under heavy irradiation at mid-to-high-temperatures was studied. A summary of the results is as follows:
-
(1)
The γ′ precipitates form and increase in size, maintaining their near cuboidal shape at 873 K and 1073 K. The size increase of γ′ precipitates is successfully explained by the NHM model as representing re-equilibration of collision-induced disordering dissolution with back-diffusion-induced re-ordered precipitation.
-
(2)
The irradiated area became wholly composed of γ′ precipitates after irradiation at 1273 K, an observation which may be explained by considering three phenomena. First, the elemental composition of the irradiated area is homogeneous because the rise in Gibbs free energy is concomitant with disordering of the γ′ precipitates. Second, the irradiated area becomes wholly composed of γ′ precipitates, so as to maintain the equilibrium chemical potential at γ′/γ interface. Third, the crystal structure is stabilized as L12 ordered γ′ precipitates throughout the entire irradiated area because of the disordered-to-ordered transformation which occurs during the decrease in sample temperature.
REFERENCES
- 1) R.J.M. Konings, T.R. Allen, R.E. Stoller and S. Yamanaka: Comprehensive Nuclear Materials, Vol. 4, (Elsevier, Amsterdam, 2012) pp. 241–271.
- 2) J.-K. Lee and M. Naganuma: Proc. 30th Int. Conf. Expos. on Advanced Ceramics & Composites, (Ceramics in Nuclear and Alternative Energy Applications, 2006) pp. 55–63.
- 3) W.K. Appleby, D.W. Sandusky and U.E. Wolff: J. Nucl. Mater. 43 (1972) 213–218.
- 4) A. Hishinuma, Y. Katano and K. Shiraishi: J. Nucl. Sci. Technol. 15 (1978) 288–295.
- 5) D.S. Gelles: J. Nucl. Mater. 83 (1979) 200–207.
- 6) W.J.S. Yang: J. Nucl. Mater. 108–109 (1982) 339–346.
- 7) S. Dumbill, R.M. Boothby and T.M. Williams: Mater. Sci. Technol. 7 (1991) 385–390.
- 8) R.M. Boothby: J. Nucl. Mater. 230 (1996) 148–157.
- 9) A. Konno, N.H. Oono, S. Ukai, S. Kondo, O. Hashitomi and A. Kimura: Mater. Trans. 58 (2017) 1636–1639.
- 10) N. Oono, S. Ukai, S. Kondo, O. Hashitomi and A. Kimura: J. Nucl. Mater. 465 (2015) 835–839.
- 11) K. Yutani, H. Kishimoto, R. Kasada and A. Kimura: J. Nucl. Mater. 367–370 (2007) 423–427.
- 12) Y. Yano, T. Tanno, H. Oka, S. Ohtsuka, T. Inoue, S. Kato, T. Furukawa, T. Uwaba, T. Kaito, S. Ukai, N. Oono, A. Kimura, S. Hayashi and T. Torimaru: J. Nucl. Mater. 487 (2017) 229–237.
- 13) M.V. Nathal: Metall. Trans. A 18 (1987) 1961–1970.
- 14) A. Konno, N.H. Oono, S. Ukai, S. Kondo, O. Hashitomi and A. Kimura: Japan Society for the Promotion of Science, Heat Resistant Metallic Materials 123 committee 59(1) (2018) pp. 143–151, in Japanese.
- 15) S.-L. Chen, S. Daniel, F. Zhang, Y.A. Chang, X.-Y. Yan, F.-Y. Xie, R. Schmid-Fetzer and W.A. Oates: Calphad 26 (2002) 175–188.
- 16) J.F. Ziegler, J.P. Biersack and U. Littmark: The Stopping and Range of Ions in Solids, (Pergamon, New York, 1985).
- 17) R.S. Nelson, J.A. Hudson and D.J. Mazey: J. Nucl. Mater. 44 (1972) 318–330.
- 18) P. Chou and N.M. Ghoniem: J. Nucl. Mater. 137 (1985) 63–72.
- 19) H. Pottebohm, G. Neite and E. Nembach: Mater. Sci. Eng. 60 (1983) 189–194.
- 20) C.T. Sims, N.S. Stoloff and W.C. Hagel: Superalloys II, (A Wiley-Interscience Publication, Hoboken, 1987) pp. 104–133.
- 21) A. Itoh: Vac. Ind. 4 (1957) 321–333 (in Japanese).
- 22) J.A. Dean: Lange’s Handbook of Chemistry, (McGRAW-HILL, INC., Makati, 1999) pp. 1199–1202.


