Abstract
The aim of this study was to examine the effect of accumulated equivalent plastic strain on the ductile fracture criterion. Spheroidized medium-carbon steel JIS-S55C was adopted as the test material. An investigation into the ductile crack initiation behavior of round-bar tensile specimens with/without circumferential notches was carried out. Tensile prestrain was applied by cold drawing. The stress triaxiality and accumulated equivalent plastic strain were calculated by the finite element method (FEM). The ductile fracture limit of tensile prestrained steel was expressed as a function of the stress triaxiality and accumulated equivalent plastic strain. The validity of the ductile fracture limit was confirmed by the prediction of chevron crack generation in multipass drawing.
This Paper was Originally Published in Japanese in J. JSTP 60 (2019) 39–44.
1. Introduction
In order to predict ductile fracture during bulk forming, it is necessary to formulate ductile fracture criterion by mathematical expressions. In cases of cold forging or cold drawing, the ductile fracture criterion of steel materials is generally predicted by integral-type ductile fracture criterion, such as Oyane1) and Cockcroft and Latham,2) etc. The material constants in these equations are evaluated by using an upsetting test3) with cylindrical test specimens or notched cylindrical test specimens.
According to the prediction of ductile fracture using integral-type ductile fracture criterion, a damage variable is calculated by integrating the stress at the evaluation points with respect to strain to judge whether ductile fracture occurs at the evaluation point. It has been reported that chevron cracks generated on the inside of materials during extrusion can be predicted by this approach based on the measured results of the damage variable by a tensile test using the specimen with an annular notch, i.e., using the damage variable obtained by performing an annular notch tensile test and from Cockcroft and Latham’s criterion.4)
However, it has been also reported that even for the same material, the damage variable changes with the stress state;5,6) therefore, this method is not always applicable to all processing methods.
We focused on the stress triaxiality-type ductile fracture criterion7,8) based on Rice and Tracy’s model.9) The stress triaxiality-type ductile fracture criterion can be expressed by stress triaxiality, which is calculated by dividing the mean stress value σm by the equivalent stress σeq, and the equivalent plastic strain εeq. In order to consider applicability of the stress triaxiality-type ductile fracture criterion, the cold upsetting test was performed. As a result, prediction of the surface crack initiation during cold forging by the stress triaxiality-type ductile fracture criterion was effective at a low stress triaxiality (from 0.4 to 0.9).10,11) In addition, in order to confirm the versatility of the ductile fracture criterion of the stress triaxiality-type, chevron cracks have been used to predict during cold drawing. In actual multipass drawing, multiple processing steps are required before the final shape is formed. Therefore, it is necessary to grasp the effect of accumulative strain on ductile fracture limit involving the multipass cold drawing.
Yoshinari et al. reported12) that the ductile fracture limit can be systematized with regard to the accumulative strain volume, covering a range of the stress triaxiality over 0.9. However, in this study, the effect of accumulative strain on ductile fracture limit of the stress triaxiality-type at low triaxiality was unclear.
Therefore, this study aimed to examine the effect of accumulated strain on the ductile fracture at low stress triaxiality and to predict the chevron cracks in multipass drawing.
2. Effect of Accumulative Strain under Ductile Fracture Criterion
2.1 Material
Samples of JIS-S55C of medium carbon steel typically used for cold forging were used as the specimens. The chemical composition of these steel specimens is shown in Table 1. For the steel specimens, steel bars 55 mm in diameter were produced by hot rolling billets, which were subjected to uniform heating of 1013 K × 36.0 ks, followed by spherical annealing with gradual cooling.

Table 1 Chemical composition of test pieces (mass%).
The Vickers hardness of the spherical annealed material was measured. The number of measured points was nine in the cross-section (four points were in the surface part, four points were in the W/4 part, and one point was at the center), and the applied load was 500 gf. The average value of the hardness measured from these nine points was defined as the hardness of the test material. The microstructure of the test material was observed using an optical microscope and a scanning electron microscope (SEM). Before microstructural analysis, the cross-section of the material along the longitudinal direction was polished and etched in a Nital solution (nitric acid:ethanol ratio = 3:97). The microstructures and Vickers hardness of the specimen steel are shown in Fig. 1. The microstructure was a mixed structure of ferrite, perlite and spherical cementite.
2.2 Test conditions
In order to consider various kinds of accumulative strain amounts, the multipass drawing was performed.
The accumulative strain was defined from finite element method analysis as the strain amount at the central portion of the specimens after cold drawing. The obtained accumulative strain amounts of test numbers, 1, 2, and 3 were 0, 0.07, and 0.15, respectively. The drawing was conducted using a draw bench device (FUJIOKA-KOSAKUSHO Co., Ltd.). After heat treatment, the test specimens were treated, pickled, and bonderized. The die angle of the hole dies used was established as 2θ = 14°, which is typically used for wire drawing. Die shapes and the drawing conditions are shown in Fig. 2 and Table 2, respectively.

Table 2 Conditions of cold drawing experiments in the laboratory.
Sampling positions and shapes of test specimen are shown in Fig. 3. As shown in Fig. 3(a), the test specimens were machined from test specimens after cold drawing so that the axis direction of the test pieces from the drawing center coincides with that of the drawing materials. The R in the figure means the radius of notches. For example, R3 shows the notch with a radius of 3 mm. Note that the tensile test using R5 notched round bar tensile test specimens was coincided only under the accumulative strain of 0.
The tensile test was conducted out by using a 250-kN tensile testing machine (Zwick) until fracture was reached with a constant speed at a tensile speed of 3.0 mm/min at room temperature.
2.3 Conditions of finite element analysis
The cold drawing axisymmetric analysis was performed by using finite element code Marc version 2014 (MSC software) in order to obtain individual components of stress and strain. The length of the analysis model is three times longer than that of the analysis model’s diameter, since the effect of both ends is negligible.13)
The mesh size at the evaluation points was 0.5 mm. The friction coefficient was determined as μ = 0.08, which corresponded to the drawing force between the analysis result and experimental result.
The axisymmetric tensile test analysis was conducted by using finite element code (Marc, version 2014; MSC Software) with the mesh size at the evaluation points of 0.05 mm. The true stress-strain curve of materials was obtained through a tensile test with smooth tensile test specimens, which were sampled from the test specimen after cold drawing. Young’s modules and Poisson’s ratio were considered to be 206 GPa and 0.3, respectively. The actual data were used as long as uniform deformation was maintained, and the deformation after the uniform deformation was extrapolated using an approximated function by a first order function. Figure 4 shows the true stress-strain curve used in the FE analyses. As an example, the FE analysis models of cold drawing and R3 notched round bar tensile test are shown in Fig. 5.

The central portion of the test specimen of the cold drawing at which chevron cracks were initiated was defined as the evaluation point of stress and strain. The central portion of the tensile test specimen at which a ductile fracture is initiated was defined as the evaluation point.
2.4 Definition of the ductile fracture limit
An investigation into the ductile crack initiation behavior was performed, as described in previous reports.10,11) In order to provide an arbitrarily equivalent plastic strain lower than the fracture strain, the tensile test was conducted out at room temperature. Subsequently, the test specimen was cooled under liquid nitrogen, and the tensile load was applied to it again to force fracture. The fracture surface under liquid nitrogen shows brittle fracture faces; therefore, the ductile crack length was measured with high precision.
The ductile fracture surface in the central portion of the test specimen was observed by a SEM. A dimple field corresponds to ductile cracks. As in the previous reports,10,11) the ductile fracture limit was the equivalent plastic strain and stress triaxiality when a 200 µm ductile crack initiated. The equivalent plastic strain and stress triaxiality thereof were calculated by FE analysis.
2.5 Ductile fracture limit
The ductile fracture surface of accumulative strain of 0.07 is shown in Fig. 6. The ductile cracks occurred from the central portion of the test specimen. The final equivalent plastic strain is the sum total of the equivalent plastic strain calculated by FE analysis during the cold drawing and tensile test.
As an example, the degree of the relationship for the tensile test of the R3 notched round bar under the accumulative strain of 0.07 is shown in Fig. 7. The relationship of the load-displacement response between the experiments and the FE analysis were almost perfect in all the cases.
The relationship between the equivalent plastic strain from FE analysis and ductile crack length obtained is shown in Fig. 8. The ductile crack length increases when the equivalent plastic strain increased. The criterion that the ductile crack length reaches 200 µm was determined based on this relationship.
The result when the ductile crack length reached 200 µm are plotted as the relationship between the plastic strain and stress triaxiality, as shown in Fig. 9. The equivalent plastic strain at the ductile fracture initiation in Fig. 9 includes those of the accumulative strain endowed in the cold drawing.
Shimanuki et al. reported14) that the relationship at ductile crack initiation between the stress triaxiality and equivalent plastic strain can be approximated exponentially.
In this study, the curves were also approximated using exponential functions that constitute the ductile fracture limit. The ductile fracture limit when a 200 µm ductile crack initiated is shown in Fig. 9. The ductile fracture limit of the specimens in this study can be expressed by the following formula;
| \begin{equation}
\varepsilon_{\text{f}} = 3.3 \exp(-2.4 \sigma_{\text{m}}/\sigma_{\text{eq}})
\end{equation}
| (1) |
The ductile fracture limit was estimated by the relationship between stress triaxiality and the equivalent plastic strain. The fracture limit strain decreases when the equivalent plastic strain increases.
3. Validation of Ductile Fracture Limit in Multipass Cold Drawing
3.1 Multipass cold drawing
It emerged that the ductile fracture limit can be systematized with regard to the accumulative strain volume. In order to confirm the versatility of the ductile fracture criterion of the stress triaxiality-type, prediction of the chevron crack was performed. The multipass cold drawing was conducted using a draw bench. The conditions of the multipass cold drawing are shown in Table 3.

Table 3 Conditions of cold drawing experiments in the laboratory.
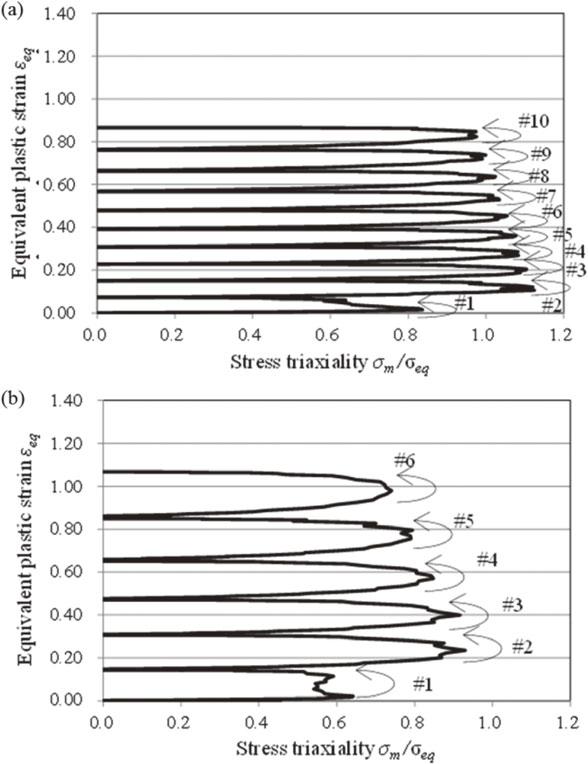
Figure 10 shows the relationship between stress triaxiality and the equivalent plastic strain in the central portion of the cold drawing test specimen. Pattern 1 shows that a smaller reduction of area results in a greater mean value with high stress triaxiality.
3.2 Ductile crack length during cold drawing
The chevron cracks occurred at the thirteenth path (from ϕ18 to ϕ17) for pattern 1 and at the seventh path (from ϕ18 to ϕ16) for pattern 2. Figure 11 shows the chevron crack generation at the twelfth path (one path before the fracture) for pattern 1. The generation intervals of the chevron cracks were 12 mm for pattern 1 and 14 mm for pattern 2.
As shown in Fig. 12, the chevron cracks in the multipass cold drawing were initiated with micro-cracks vertical to the drawing direction from the central portion of the cold drawing specimen, followed by cracks evolving in the shearing direction.15)
The tensile test specimen shown in Fig. 3(b) was sampled at the position shown in Fig. 12(a), where the axial direction of the tensile test specimen coincides with the axial direction of cold drawing specimen.
The length of the parallel section of 40 mm was sufficient to measure the crack length. After the test specimen was cooled under liquid nitrogen, and the tensile load was applied to force fracture. The fracture surface under liquid nitrogen showed brittle fracture faces. As a result, the ductile crack length was measured with high precision. Thus, the ductile crack length was measured via the photographs of the fracture surface by the SEM.
Figure 13 shows the ductile fracture surface of the cold drawing test specimen. The fracture surfaces in the notched round bar tensile test and cold drawing test specimen were a dimple fracture surface.
Figure 14 shows the relationship between the path number and ductile crack length. The path number when the ductile crack length reaches 200 µm was the fourth path in pattern 1 (εeq 0.31) and the fourth path in pattern 2 (εeq 0.47).
Figure 15 shows the predicted results of the ductile cracks (200 µm) during the multipass cold drawing. For each pattern, ductile cracks of 200 µm occur when the stress and strain during multipass cold drawing exceeded the ductile fracture limit. The solid lines indicate the paths at which the ductile cracks of 200 µm occurred. It was predicted that the ductile fracture of 200 µm would occur at the fourth path in pattern 1 and at the 4th path in pattern 2.
Compared with the actual results, the predicted results were consistent with the former. Therefore, the validity of the ductile fracture limit was confirmed by the prediction of chevron crack generation in the multipass drawing.
For the light-weight design of car parts, hollow forming technology is activity developed. However, cracks on the inner surface of the hollow parts are a concern. Ductile fracture prediction of hollow parts is required hereafter, as it may help to change the deformation mode of hollow parts.
4. Conclusions
In this study, in order to predict the stress triaxiality-type ductile limit of chevron crack generation in the multipass drawing, the notched round bar tensile test of accumulative strained material was performed, and the main findings of this study are as follows:
-
(1)
The curves of the ductile fracture limit depend on the steel with regard to the accumulative strain volume. The fracture limit strain decreases when the stress triaxiality increases.
-
(2)
The number of paths when chevron cracks were generated during the drawing coincided with that of the path at which the predicted ductile fracture occurred. As a result, the validity of the ductile fracture limit was confirmed by the prediction of chevron crack generation in the multipass drawing.
REFERENCES
- 1) M. Oyane: Jpn. Soc. Mech. Eng. 75(639) (1972) 596–601.
- 2) M.G. Cockcroft and D.J. Latham: J. Inst. Met. 96 (1968) 33–36.
- 3) Subgroup; Materials: J. JSTP 22(241) (1981) 39–144.
- 4) T. Ishikawa: J. JSTP 53 (2012) 790–794.
- 5) Y. Yoshida: 303rd symposium. J. JSTP, (2013) pp. 61–67.
- 6) T. Ishiguro, E. Abe, K. Ueno, N. Yukawa, M. Fujiwara, H. Yoshida and T. Ishikawa: J. JSTP 54 (2013) 993–997.
- 7) A. Otsuka, T. Miyata, T. Sakurai and H. Iida: J. Soc. Mater. Sci. Jpn. 34 (1985) 622–626.
- 8) H. Shimanuki, H. Furuya, T. Inoue, Y. Hagiwara and M. Toyoda: Soc. Nav. Archi. Jpn. 1999(186) (1999) 475–483.
- 9) J.R. Rice and D.M. Tracey: J. Mech. Phys. Solids 17 (1969) 201–217.
- 10) A. Shiga, J. Ookubo, K. Tamura, N. Matsui, Y. Neishi and M. Higashida: J. JSTP 53 (2012) 150–154.
- 11) T. Yamashita, Y. Neishi, A. Shiga and Y. Noguchi: J. JSTP 58 (2017) 617–623.
- 12) H. Yoshinari, K. Enami, M. Kan and S. Kaneda: J. Soc. Mat. Sci. Jpn. 54 (2005) 296–301.
- 13) Y. Neishi, R. Watanabe, M. Haruhata and T. Kuboki: J. JSTP 43 (2002) 401–405.
- 14) H. Shimanuki, H. Furuya, T. Inoue, Y. Hagiwara and M. Toyoda: Q. J. Jpn. Weld. Soc. 22 (2004) 515–523.
- 15) K. Komori: J. JSTP 57 (2016) 105–108.