Abstract
Utilizing γ/α transformation allows for a wider range of structure control for Al2O3-forming FeCrAl alloys considered as a candidate for the advanced fast reactor fuel cladding. In this research, nickel addition was explored as a method for creating γ-austenite at 1000°C and retaining α-ferrite at room temperature through computing phase diagram by FactSage and implementing HT-XRD & EPMA experiments. In addition, Al2O3 scale formation by oxidation test was implemented at 1000°C. Those results indicated that structure control by the γ/α transformation is realized with appropriate aluminum and nickel addition, keeping continuous Al2O3 scale formation.
1. Introduction
The severe accident of Fukushima Daiichi nuclear power plant in March 11, 2011 has given rise to the core melting and hydrogen explosion. It should be noticed that the source of huge amount of heat inducing core melting and hydrogen gas production are associated with an oxidation reaction of Zircaloy clad with hot steam by Zr + H2O = ZrO2 + H2 + 586 kj/mol. This reaction is known to be significantly accelerated at the elevated temperature over 1200°C, providing huge amount of exothermic heat by chemical reaction. Therefore, development of oxidation resistant alloys is focused worldwide as the accident tolerant fuel (ATF) cladding. The various kinds of FeCrAl alloys are studied in US,1–5) since Al-containing alloys produce the stable alumina (Al2O3) scale to prevent direct reaction of Fe with steam. Based on the significant R&D results conducted for almost 30 years regarding 9CrODS,6–10) 12ODS11–13) and high Cr ODS13–16) for Generation IV fast reactors and an advanced fusion blanket system, we are developing Al2O3-forming oxide dispersion strengthened (ODS) FeCrAl-alloys. The primary candidate of FeCrAl-ODS alloy is Fe–12Cr–6Al–0.4Zr–0.5Ti–0.24Ex.O–0.5Y2O3 (mass%), which has been optimized from a wide range of Cr and Al contents in the Japanese MEXT project conducted in 2013–2017.17–21) Currently, this candidate alloy is being tested and evaluated to extensively implement the safety improvement of current Light Water Reactors under METI project in Japan.22,23)
However, primarily optimized FeCrAl-ODS alloy inherently makes single α-ferrite phase through all temperature ranging up to the melting point, since Cr and Al are well known to be strong ferrite former elements. The fine grains elongated along the cold-rolling direction in the process of cladding manufacturing can be destroyed and modified by only recrystallized heat treatment. The recrystallized grains containing less dislocation density are realized to be somewhat disadvantage for resistance to neutron-irradiation and α′ embrittlement. In addition, single ferrite serves restriction for the cladding manufacturing process, as only recrystallization could be relied upon as means of structural control.24,25) On the other hand, the martensite structure containing high dislocation density could overcome not only above disadvantage of irradiation resistance and α′ embrittlement but also structure control at the cladding manufacturing by making through γ to α transformation.26,27)
In order to stabilize γ-austenite at solution treatment temperature of around 1000°C for the Al2O3-forming FeCrAl-ODS alloy, the strong austenite former elements should be incorporated, because typical structure of Fe–12Cr6Al-ODS alloys are α-ferrite up to melting point. US-ORNL has developed Al2O3-forming austenitic alloys; their main composition is Fe–(20–25)Ni–(12–15)Cr–(3–4)Al in mass% by incorporating with large amount of Ni.28,29) However, the stable phase of these austenitic alloys is γ-austenite at the entire temperature raging from RT to melting point, and γ/α transformation cannot be encountered. Our intention is to make γ/α transformation during cooling, which needs α-phase at the service temperature due to better radiation resistance and prevention of irradiation-assisted stress corrosion cracking (IASCC) as well as γ-phase at solution heat treatment.
In this study, we explore appropriate phase diagram satisfying above requirement by adding austenite former element Ni into Al2O3-forming FeCrAl-ODS alloys. Thermochemical computer software FactSage was used for this purpose. Under the condition of 4.5 and 6.5 mass% Al to satisfy the Al2O3 formation, possibility of γ/α transformation was predicted as a parameter of Ni-content by computing phase diagram using FactSage software. Then, both structural control via γ/α transformation and oxidation resistance via Al2O3 formation are experimentally verified, and optimized composition for Al2O3-forming FeCrAl-ODS alloy with γ/α transformation will be proposed.
2. Alloying Design and Computed Phase Diagram
The base composition of the alloys is FeCrAl-ODS with 12 mass% Cr and 0.45 mass% Y2O3, where Cr is beneficial element to lower the Al content necessary for the Al2O3 scale formation through third element effect.30,31) However, excessive Cr addition is detrimental due to causing embrittlement by α′ precipitation. From previous results of experiments for FeCrAl alloys, Cr content was set to be 12 mass%. Y2O3 content was selected as 0.45 mass%, according to the composition of already existed FeCrAl-ODS alloys.17–21)
We have two major targets in this alloying design, which are to make the protective Al2O3 scale to prevent steam oxidation as well as possible γ/α transformation to realize capability for the microstructure control. Al content is necessary to be more than about 4 mass% to produce Al2O3 scale,32) however, excessively higher Al content inhibits the formation of γ phase as strong ferrite stabilizing element.
To realize the γ/α transformation in FeCrAl-ODS alloys, available Ni addition was studied as an austenite former element. At first, neutron capture cross section of Ni was surveyed, because it is indispensable for applying to nuclear fuel cladding. Table 1 lists neutron capture cross section of the cladding constituent elements for thermal and fast neutron.33) The neutron capture cross section of Ni is 1.8 times larger than that of Fe for thermal neutron, suggesting that application of Ni-added alloys to the LWR fuel cladding could be limited. For the fast reactor fuel application, Ni-addition to FeCrAl-ODS alloys is adequately feasible from the neutron capture cross section at the fission spectral neutron.

Table 1 Neutron capture cross section for main isotopes.
Based on above consideration, the pseudo binary phase diagrams for both composition of Fe–12Cr–4.5Al–xNi and Fe–12Cr–6.5Al–xNi were analyzed by using thermochemical computer software FactSage, which are shown in Fig. 1 for Fe–12Cr–4.5Al–xNi and Fig. 2 for Fe–12Cr–6.5Al–xNi. Regions in pale blue, pale green and pale red colors correspond to α-ferrite, dual phase of α-ferrite and γ-austenite, and single γ-austenite, respectively. These figures imply that appropriate selection of Ni-content make possible to induce the γ/α transformation during cooling after solid solution heat treatment. As shown in the list of computed phases in Fig. 1, BCC_A2 is the α-ferrite, B2BCC is NiAl intermetallic compound, BCCA2#2 is the pure Cr and FCC_A1 is the γ-austenite. The single α-ferrite region expands to higher Ni content with increasing Al addition by comparing Fig. 1 and Fig. 2. Nickel addition of 12, 18, 22 mass% was selected from Fig. 1 and Fig. 2 as shown by solid circle symbols, where phase transformations are expected during cooling from 1000°C to room temperature: α + γ to α for 12 mass% Ni, γ to α (+ γ) for 18 mass% Ni and γ to α + γ for 22 mass% Ni. In addition, intermetallic compound, B2BCC(NiAl) and Ni5Al3, are also predicted.

3. Experimental Procedure
The FeCrAl-ODS alloys with a parameter of Al and Ni contents were prepared in accordance to a standard process of fabrication except for mechanically alloying. In order to avoid the cold welding of nickel to the surface of the pots and balls during the mechanical alloying, two steps of mechanical alloying were applied. At the preliminary process, Y2O3 powder, Fe powder, Cr powder and 50 mass% Fe–50 mass% Al alloyed powder were mechanically alloyed for 48 hours at 300 rpm, where Fe–Al alloyed powder rather than pure Al powder was used to prevent Al powder adherence; then at the subsequent process Ni powder were added and mechanically alloyed at lower rotational speed of 250 rpm for 24 hours to prevent adherence of Ni powder on the surface of pot and balls. Table 2 lists the chemical composition of mechanically alloyed powders measured by X-ray fluorescence, which does not include carbon and oxygen. Target compositions are two levels of Al content: 4.5 mass% Al: LAl–LNi (4.5 mass%Al–12 mass%Ni), LAl–MNi (4.5 mass%Al–18 mass%Ni), LAl–HNi (4.5 mass%Al–22 mass%Ni) and 6.5 mass% Al: HAl–LNi (6.5 mass%Al–12 mass%Ni), HAl–MNi (6.5 mass%Al–18 mass%Ni), HAl–HNi (6.5 mass%Al–22 mass%Ni), where both contain different Ni contents (12, 18, 22 mass%). The chemical composition of the mechanically alloyed powders produced in this experiment is slightly dispersed around target.

Table 2 Chemical composition of mechanically alloyed powders measured by XRF in mass%.
The mechanically alloyed powders were consolidated by spark plasma sintering (SPS) at 1175°C for 3 hours then solution treated at 1150°C for 1 hour. After solution treatment for homogenization, furnace cooled sample and quenched sample were prepared for chemical composition measurement. Specimens for element analyses by an electron probe micro-analyzer (EPMA) were embedded into resin and grinded with SiC paper and polished with 1 µm diamond. An X-ray diffraction (XRD) samples were cut into a flat circular sheet of about 0.8 mm in thickness with 15 mm diameter. An XRD measurement was carried out using Rigaku-SmartLab with an infrared heating attachment. The specimen was set in a vacuum chamber. Cu-Kα emitted by 40 kV and 200 mA was used, and Bragg Brentano method was applied for measurement in a range of 20°–90° at 2θ with a scan speed of 0.5° per minute. 2D single image shot mode was used for the X-ray detection. Measurement was conducted at room temperature and 1000°C and during cooling from 1000°C to room temperature at different cooling rates. Fractions of the γ-phase, α-phase and each precipitate were estimated from a ratio of the measured X-ray intensities to those from the standard specimens.
For oxidation test, 6 specimens were applied as parameters of Al and Ni contents, and SP1 and SP317–21) were also included as reference materials. Chemical composition of SP1 and SP3 are listed in Table 2, where SP1 is 12CrODS alloy without Al and Ni, and SP3 is typical FeCrAl-ODS steel with 12Cr–5Al. The specimen surfaces were wet ground and polished sufficiently until using 1 µm-diamond paste and subsequently ultrasonically cleaned in ethanol. Isothermal oxidation test was carried out at 1000°C up to 49 h in an air-atmosphere muffle furnace, and the oxidation weight gains at different time of exposures were measured by a Sartorius precision electronic balance with an accuracy of 1 µg.
4. Results and Discussion
4.1 Stable α/γ phases at high and room temperatures
The element distributions in the manufactured specimens were measured by EPMA. As an example, Fig. 3 hows the results of element-mapping of specimen HAl–MNi at the furnace-cooled condition (1.5°C/min). These data confirm three phases: Fe-based matrix, Ni–Al intermetallic compound and Cr-carbide. The phase diagram computed by Factsage shown in Fig. 2 represents α-ferrite (BCC_A2), two types of intermetallic compound of NiAl (B2BCC) and Al3Ni5, and Cr rich phase (BCCA2#2) at room temperature. The two types of intermetallic compounds cannot be separately characterized by EPMA measurement. Two obvious features can be pointed out from Fig. 3; Ni–Al compound is granular shape precipitates, and Cr rich BCC phase is obviously modified to Cr-carbide by reaction with carbon contaminated during sintering process.

The results of XRD measurements for all of specimens at room temperature are shown in Fig. 4, and quantitative fraction derived from the X-ray intensity is listed in Table 3, where specimens were furnace-cooled at extremely slow cooling rate. For specimen HAl–MNi, of which element-mapping is shown in Fig. 3, Fe-based matrix is found the α-ferrite. For all of specimens, higher nickel content from 12 mass% to 22 mass% leads to more stable γ-phase in 4.5 mass%Al specimens, while Al-content increased from 4.5 mass% to 6.5 mass% stabilizes the α-ferrite. Furthermore, close examination by the XRD revealed that intermetallic compound is NiAl with B2 structure and Cr-carbide is the form of Cr7C3.

Table 3 Fraction of each phase measured by XRD at RT.
The results of XRD measurements at 1000°C are shown in Fig. 5, and are summarized in Table 4. Major phase is γ-austenite at 1000°C except for specimen HAl–LNi, which is dominated by the α-ferrite. This reason could be associated with balance between driving force for the α to γ phase transformation and pining force by oxide particles. The specimen HAl–LNi with the lowest Ni-content in higher Al-content specimens has the lowest driving force among the manufactured six specimens; thus, it is likely attributed to the retaining α-ferrite during α to γ phase transformation at temperature increasing from room temperature to 1000°C.7) This α-ferrite could not be stable, and it will be discussed in the next section.

Table 4 Fraction of each phase measured by XRD at 1000°C.
The phases measured by XRD at 1000°C and the room temperature are summarized in Fig. 6, of which data are listed in Table 4 and Table 3. There are three distinct modes in phase transformation measured by XRD; LAl–HNi is higher Ni-content and lower Al-content enough to stabilize the γ-phase at 1000°C and the room temperature. On the other hand, the HAl–LNi is stable α-ferrite throughout all temperature ranges due to high Al and low Ni composition. Between these two zones, γ-stabilizing Ni and α-stabilizing Al allows for a γ/α transformation during cooling. For specimen LAl–LNi, the γ-phase is almost only stable phase at 1000°C, and this γ-phase transforms into a α-phase during cooling thus having almost perfect γ $ \Rightarrow $ α transformation. For specimen HAl–MNi, both α and γ-phase are stable at 1000°C, leading to γ + α $ \Rightarrow $ α transformation. The γ-phase is somewhat more stable having a single γ phase at 1000°C and γ/α dual phase at room temperature, thus transformation is γ $ \Rightarrow $ γ + α in A2. Finally in HAl–HNi, both phases of γ and α are present at 1000°C.

Following two points are obviously inconsistent with the computed pseudo-binary phase diagram (Fig. 1 and Fig. 2). For 6.5 mass% Al specimens, large amount of α-ferrite was observed at 1000°C by XRD. This reason could be ascribed to pining of α/γ interface by oxide particles during heating, as described in the previous paragraph, and this point will be discussed in the next section. The other is concerned with 4.5 mass% Al specimens at room temperature. The large amount of γ-austenite predicted particularly in LAl–HNi might be associated with uncertainty of (α + γ) and γ phase boundaries in computed pseudo-binary phase diagram.
4.2 γ/α phase transformation during cooling
The γ/α phase transformation behavior is studied by using in-situ XRD measurement during cooling from 1000°C to room temperature. Specimen HAl–MNi was used in this study, and cooling rate was varied in 5, 10, 30, 50°C/min. The results are represented in Fig. 7, which is so called continuous cooling transformation (CCT) diagram. It was confirmed in the case of the lowest cooling rate of 5°C/min that the intensity of γ-peak keeps the same level at the temperature range between 1000°C to 650°C, and γ-peak intensity decreases and α-peak increases gradually between 650°C and 350°C. Finally, only single α-peak was observed below 350°C. Similar behavior was observed at 10°C/min and 30°C/min. A3 & A1 temperatures can be defined in the pseudo binary phase diagrams (Fig. 2), and Ar3 & Ar1 temperatures can be shown in Fig. 7, based on in-situ XRD results. It is deduced from these results that specimen HAl–MNi is basically consisted of single γ-phase at 1000°C, and the α-ferrite fraction of 0.21 (Fig. 6) is not equilibrium phase. Our previous study suggests that oxide particle pining force sometimes prevents α to γ phase transformation, and α-phase retains even at the austenite region. We designated this α-phase as residual α-ferrite.7) As shown in Fig. 6, this residual ferrite fraction systematically decreases in 0.93 α (HAl–LNi), 0.21 α (HAl–MNi) and 0.14 α (HAl–HNi) at 1000°C in accordance with increasing content of austenite former element Ni. The residual α-ferrite cannot be found at 1000°C in specimens LAl–LNi, LAl–MNi and LAl–HNi (Fig. 6). Based on the previous study, the residual α-ferrite formation is dominated by a balance between chemical driving force for a α to γ phase transformation at 1000°C and an oxide particle pinning force for α/γ interfaces. The chemical driving force corresponds to a free energy difference of the α and γ-phases at 1000°C, where γ-phase is more stable than α-phase at this temperature. Those were estimated by using Factsage 7.2, and results are listed in Table 5. The chemical driving forces are obviously low in HAl–LNi, and increase with increasing Ni content for HAl–MNi and HAl–HNi. Those results of the γ-phase fraction vs. chemical driving force are shown in Fig. 8, suggesting that phases are completely transformed from α to γ, when the chemical driving force approaches 100 MJ/m3. On the other hand, pinning force is affected by the oxide particle dispersion condition, and is generally known to be 5 to 10 MJ/m.3,7) Therefore, the lowest case of chemical driving force of 2.5 MJ/m3 in HAl–LNi forms the residual α-ferrite by higher pinning force than chemical driving force.

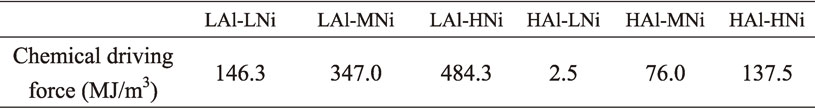
Table 5 Chemical driving force for α-γ phase transformation at 1000°C that was estimated by FactSage computer software.

The γ and α intensities at the cooling rate of 50°C/min are shown in Fig. 9. These intensities are almost same at room temperature and 1000°C, suggesting that γ to α transformation cannot be induced and almost all γ-phase retain at the cooling rate of 50°C/min. It was therefore found that the upper critical cooling rate for γ to α diffusional transformation is between 50°C/min and 30°C/min. Furthermore, quench to liquid nitrogen (−196°C) induces γ to α phase transformation, as shown in Fig. 9, where α-peak intensity obviously increases and γ-intensity decreases. This is most likely caused by the martensitic transformation, and martensite transformation starts at temperature (MS) somewhere between room temperature (25°C) and −196°C. This result is consistent with Ref. 34) and 35). These results indicate that γ-austenite is fairly stable and large driving force is necessary to induce martensitic transformation.
4.3 Oxidation resistance
Figure 10 shows the results of oxidation test up to 49 h at 1000°C under the air atmosphere, where horizontal axis means time in root of second and vertical axis means weight gain per unit area in mg cm−2. Specimens HAl–LNi, HAl–MNi and HAl–HNi containing 6.5 mass% Al undergo stable oxidation behavior, and data band of these specimens is the same level of SP3, which is the typical Al2O3-forming FeCrAl-ODS steel developed in the previous study, and excellent oxidation resistance was demonstrated even at extreme temperature up to 1400°C.17,18,20,21) The distribution map of aluminum and oxygen in the scale of the specimen HAl–LNi as a representative of this group is shown in Fig. 11. Continuous alumina scale is certainly confirmed to be formed on the outer surface of specimen HAl–LNi, because of enrichment of aluminum and oxygen. For specimens LAl–LNi, LAl–MNi and LAl–HNi containing 4.5 mass% Al, oxidation weight gains are significantly dispersed; specimen LAl–LNi with 12 mass% Ni exhibits extremely low oxidation weight gain. This level is superior to SP3. However, with increasing Ni content from 12 mass% to 18 mass% and 22 mass%, weight gain stepwise increases. Specimen SP1 without Al element takes different oxidation trend; weight gain doesn’t saturate, but increases in terms of oxidation time due to chromia (Cr2O3) scale rather than alumina (Al2O3) scale.

Assuming that oxidation progresses in a parabolic type as shown in eq. (1), parabolic rate constant kp in g cm−2 s−1, is derived,
| \begin{equation}
\Delta w =k_{p}\sqrt{t}
\end{equation}
| (1) |
where
ΔW (g cm
−2) is weight gain per unit area,
t oxidation time in sec. The
kp values derived in this analysis are listed in
Table 6, and are plotted in terms of Al-content measured by EPMA in
Fig. 12, where EPMA measurement was implemented for the water-quenched specimen from 1000°C to get information on Al matrix content at the oxidation test. Regarding HAl–LNi, HAl–MNi and HAl–HNi, Al-content (4.89 mass%) measured by EPMA in the matrix of HAl–HNi is lower than the average one (6.47 mass%) measured by XRF shown in
Table 2, although both measured by EPMA and XRF are almost consistent in the case of HAl–MNi and HAl–LNiB1. This is likely due to Al-consumption by B2BCC (NiAl) formation for higher Ni-containing specimen HAl–HNi, based on consideration of the region ⑫ (FCC and B2BCC) at 1000°C as shown in
Fig. 2. The
kp level of these specimens is similar to SP3 with 12Cr–4.5Al without Ni in full-ferrite. On the other hand, the
kp values for LAl–LNi, LAl–MNi and LAl–HNi are considerably dispersed; in particular, specimen LAl–LNi with lower Ni-content took the lowest
kp value. The
kp values for LAl–MNi and LAl–HNi increase with slightly deceasing Al-content in the matrix. Interpretation of this trend and change of Al-content in LAl–LNi, LAl–MNi and LAl–HNi is not clear. One of the possible reasons could be related to B2BCC (NiAl) formation in higher Ni-content: LAl–MNi and LAl–HNi as being similar to specimen HAl–HNi. For 4.5 mass%Al specimens, however, the pseudo binary phase diagram suggests that B2BCC is unstable at 1000°C. We think that uncertainty still exists in the computed phase diagram. Based on the experimental results shown in
Fig. 12, Al-content could be critical at around 4.5 mass%; oxidation is resisted above 4.5 mass% and accelerated below 4.5 mass%. This result coincides with Fe–Cr–Al oxide map at 1100°C reported by Mrowec
et al.,
32) where Al-content is around 4.5 mass% Al for scale boundary between Al
2O
3 and Fe
2O
3 scale.

Table 6 Parabolic rate constant kp for oxidation at 1000°C.
5. Summary
In order to develop the α/γ transformable Al2O3-forming FeCrAl-ODS steels, six kinds of alloys were produced in the parameter of Al-content (4.5 and 6.5 mass%) and Ni-content (12, 18, 22 mass%) through mechanical alloying on the basis of Fe–12Cr–0.5Y2O3. These compositions were selected from the pseudo binary phase diagram computed by FactSage software. The γ/α phase transformation during cooling after solution treatment and oxidation resistance due to Al2O3 formation at 1000°C were investigated, and following results were obtained;
-
(1)
Combination of the high Al and low Ni leads to stabilization of the α-ferrite at 1000°C, which could be resulted from the pining of γ/α boundaries by the oxide particles. In contrast, low Al and high Ni provides γ-austenite at room temperature. The low Al (0.45 mass%) & low Ni (12 mass%) or high Al (0.65 mass%) & high Ni (22 mass%) are preferable for γ to α phase transformation during cooling. AC1 and AC3 temperatures and critical cooling rate for the martensite transformation were also clarified.
-
(2)
The oxidation test in air at 1000°C revealed that 6.5 mass% Al is enough to form Al2O3 scale. Even at 4.5 mass% Al, the reduced Ni-content induces superior resistance for the oxidation via Al2O3 formation. This could be resulted from maintaining Al-content in matrix by suppressing formation of the Ni–Al intermetallic compound.
-
(3)
Based on above results, LAl–LNi (4.5 mass%Al–12 mass%Ni) and HAl–HNi (6.5 mass%Al–22 mass%Ni) are recommended as a preferable composition for α/γ transformable Al2O3-forming FeCrAl-ODS steels.
REFERENCES
- 1) S.J. Zinkle, K.A. Terrani, J.C. Gehin, L.J. Ott and L.L. Snead: J. Nucl. Mater. 448 (2014) 374–379.
- 2) K.A. Terrani, S.J. Zinkle and L.L. Snead: J. Nucl. Mater. 448 (2014) 420–435.
- 3) Y. Yamamoto, B.A. Pint, K.A. Terrani, K.G. Field, Y. Yang and L.L. Snead: J. Nucl. Mater. 467 (2015) 703–716.
- 4) K.G. Field, S.A. Briggs, K. Sridharan, R.H. Howard and Y. Yamamoto: J. Nucl. Mater. 489 (2017) 118–128.
- 5) K.A. Terrani: J. Nucl. Mater. 501 (2018) 13–30.
- 6) R. Miyata, S. Ukai, X. Wu, N. Oono, S. Hayashi, S. Ohtsuka and T. Kaito: J. Nucl. Mater. 442 (2013) S138–S141.
- 7) M. Yamamoto, S. Ukai, S. Hayashi, T. Kaito and S. Ohtsuka: J. Nucl. Mater. 417 (2011) 237–240.
- 8) S. Ukai, S. Ohtsuka, T. Kaito, H. Sakasegawa, N. Chikata and S. Hayashi: Mater. Sci. Eng. A 510–511 (2009) 115–120.
- 9) S. Ukai, S. Mizuta, M. Fujiwara, T. Okuda and T. Kobayashi: J. Nucl. Sci. Technol. 39 (2002) 778–788.
- 10) S. Ukai and M. Fujiwara: J. Nucl. Mater. 307–311 (2002) 749–757.
- 11) B. Leng, S. Ukai, Y. Sugino, S. Tang, T. Narita, S. Hayashi, F. Wang, S. Ohtsuka and T. Kaito: ISIJ Int. 51 (2011) 951–957.
- 12) T. Narita, S. Ukai, T. Kaito, S. Otsuka and T. Kobayashi: J. Nucl. Sci. Technol. 41 (2004) 1008–1012.
- 13) S. Ukai, T. Okuda, M. Fujiwara, T. Kobayashi, S. Mizuta and H. Nakashima: J. Nucl. Sci. Technol. 39 (2002) 872–879.
- 14) A. Kimura, R. Kasada, N. Iwata, H. Kishimoto, C.H. Zhang, J. Isselin, P. Dou, J.H. Lee, N. Muthukumar, T. Okuda, M. Inoue, S. Ukai, S. Ohnuki, T. Fujisawa and F. Abe: J. Nucl. Mater. 417 (2011) 176–179.
- 15) P. Dou, A. Kimura, T. Okuda, M. Inoue, S. Ukai, S. Ohnuki, T. Fujisawa and F. Abe: Acta Mater. 59 (2011) 992–1002.
- 16) J. Isselin, R. Kasada, A. Kimura, T. Okuda, M. Inoue, S. Ukai, S. Ohnuki, T. Fujiwara and F. Abe: Mater. Trans. 51 (2010) 1011–1015.
- 17) Y. Shizukawa, S. Ukai, N. Oono, S. Hayashi, S. Ohtsuka, T. Kaito, T. Torimaru and A. Kimura: Proceeding on Advanced High-Temperature Materials Technology for Sustainable and Reliable Power Engineering (123HiMAT-2015) 29, (2015) pp. 149–152.
- 18) S. Ukai, N. Oono, S. Ohtsuka, T. Kaito, K. Sakamoto, T. Torimaru, A. Kimura and S. Hayashi: The Ninth Pacific Rim International Conference on Advanced Materials and Processing (PRICM9), (2016) pp. 376–380.
- 19) Y. Yano, T. Tanno, H. Oka, S. Ohtsuka, T. Inoue, S. Kato, T. Furukawa, T. Uwaba, T. Kaito, S. Ukai, N. Oono, A. Kimura, S. Hayashi and T. Torimaru: J. Nucl. Mater. 487 (2017) 229–237.
- 20) S. Ukai, N. Oono, S. Ohtsuka, T. Kaito, K. Sakamoto, T. Torimaru, A. Kimura and S. Hayashi: Proceeding of LWR Fuel with Enhanced Safety and Performance, TOPFUEL2016, (2016).
- 21) S. Ukai, N. Oono, K. Sakamoto, T. Torimaru, T. Kaito, A. Kimura and S. Hayashi: Proceedings of ICAPP, (2017).
- 22) K. Sakamoto, M. Hirai, S. Ukai, A. Kimura, A. Yamaji, K. Kusagaya, T. Kondo and S. Yamashita: Water Reactor Fuel Performance Meeting, (2017).
- 23) S. Yamashita, F. Nagase, M. Kurata, Nozawa, S. Watanabe, K. Kirimura, K. Kakiuchi, T. Kondo, K. Sakamoto, K. Kusagaya, S. Ukai and A. Kimura: Water Reactor Fuel Performance Meeting, (2017).
- 24) S. Ukai, T. Nishida, H. Okada, T. Okuda, M. Fujiwara and K. Asabe: J. Nucl. Sci. Technol. 34 (1997) 256.
- 25) S. Ukai, S. Mizuta, T. Yoshitake, T. Okuda, S. Hagi, M. Fujiwara and T. Kobayashi: J. Nucl. Mater. 283–287 (2000) 702–706.
- 26) S. Ukai, T. Nishida, T. Okuda and T. Yoshitake: J. Nucl. Sci. Technol. 35 (1998) 294.
- 27) S. Ukai, S. Muzuta, M. Fujiwara, T. Okuda and T. Kobayashi: J. Nucl. Sci. Technol. 39 (2002) 778.
- 28) M.P. Brady, Y. Yamamoto, M.L. Santella, P.J. Maziasz, B.A. Pint, C.T. Liu and H. Bei: JOM 60 (2008) 12–18.
- 29) Y. Yamamoto, M.P. Brady, Z.P. Lu, P.J. Maziasz, C.T. Liu, B.A. Pint, K.L. More, H.M. Meyer and E.A. Payzant: Science 316 (2007) 433–436.
- 30) Y. Kitajima, S. Hayashi, T. Nishimoto, T. Narita and S. Ukai: Oxid. Met. 75 (2011) 41–56.
- 31) S. Yoneda, S. Hayashi and S. Ukai: Oxid. Met. 89 (2018) 81–97.
- 32) S. Mrowec and T. Weber: Gas Corrosion of Metals, (US Department of Commerce, National Technical Information Service, 1978) p. 447.
- 33) Nuclear Data by Japan Atomic Energy Agency: https://wwwndc.jaea.go.jp/NuC/index_J.html.
- 34) G.H. Eicherman and F.C. Hull: Trans. Am. Soc. Met. 45 (1953) 77.
- 35) H. Schumman: Arch. Eisenhuttenwes. 40 (1963) 1027.


