Abstract
A series of Mg–Ni or Mg–Cu alloys with Mg content comprised between 55 and 77 at% Mg was prepared by mechanical alloying with the aim of synthesizing Mg2Ni and Mg2Cu phases, respectively. Their morphology and structural properties were characterized by scanning electron microscopy (SEM) and X-ray Diffraction (XRD). High Pressure Differential Scanning Calorimetry (HP-DSC) was used to evaluate their hydrogenation properties. For the Mg–Ni series, 8 hours of milling were enough to synthesize the Mg2Ni alloy. The highest reversible hydrogen capacity (2.8 mass%) was obtained for 70 at% Mg sample without the need of any activation treatment. For Mg–Cu series, 83 mass% of Mg2Cu was obtained after 4 hours of milling. From the view point of alloying composition, Mg-rich samples show better crystallinity of Mg2Cu phase. Under hydrogen, the Mg2Cu powder mixtures decompose and form MgH2 hydride storing 1.56 mass% of hydrogen for 66 at% Mg. For the Mg–Ni series, Cu or Al elements (1 to 10 mass%) were added during milling. HP-DSC runs show that they destabilize the hydride phase due to alloying effects.
1. Introduction
As energy crisis and environmental pollution are becoming more and more serious, hydrogen is widely regarded as a key energy vector to promote the use of renewable energies and eventually get rid of the traditional fossil fuels. To find out efficient and safe hydrogen storage materials with low cost is a crucial issue for the utilization of hydrogen as an energy carrier.1) Magnesium has a high hydrogen absorption capacity (7.6 mass%, 109 gH/l) and is abundant in the earth’s crust.2) However, it suffers both from slow sorption kinetics below 300°C and high thermal stability of its hydride.3) There exist many methods to improve the hydrogen storage properties of Mg such as the addition of transition metals (TM) to form Mg–TM intermetallics4) or the nanostructuration by mechanical milling.5)
Mechanical alloying (MA) is a solid-state powder processing technique involving repeated welding, fracturing, and rewelding of powder particles in a high-energy ball mill. MA is considered to be more appropriate to synthesize Mg based intermetallic compounds than conventional metallurgical methods, such as melting or sintering, because of the low miscibility of Mg with several TM, the high vapor pressure of Mg and the difference between the melting points of Mg and TM.6,7) In this context, MA has been used to synthesize Mg–TM intermetallics for hydrogen storage such as Mg2Ni and Mg2Cu.
Mg2Ni intermetallic crystallizes with its own structure prototype (Ca, space group P6222, lattice parameters a = 0.52131 nm and c = 1.3261 nm). It reacts with hydrogen to form Mg2NiH4, according to the reaction:8)
| \begin{equation}
\text{Mg$_{2}$Ni} + \text{2H$_{2}$} \rightarrow \text{Mg$_{2}$NiH$_{4}$}
\end{equation}
| (1) |
The corresponding gravimetric hydrogen capacity is 3.6 mass%. The formation enthalpy of Mg
2NiH
4 (−64 kJ/mol H
2) is lower than that of MgH
2 (−75 kJ/mol H
2) and therefore, the hydride decomposition temperature is decreased by Ni addition. For these reasons and its low alloy cost, the hydrogenation properties of Mg
2Ni have been intensively studied.
9–21) For example, Zaluski
et al.20) successfully synthesized this alloy by MA and reported an absorption capacity of 3.4 mass% hydrogen at 300°C.
Mg2Cu crystallizes with its own prototype (Cb, space group in Fddd, lattice parameter a = 0.90621 nm, b = 0.52831 and c = 1.835111 nm). It disproportionates under H2 to form MgH2 and MgCu2 according to the reaction:22)
| \begin{equation}
\text{2Mg$_{2}$Cu} + \text{3H$_{2}$} \rightarrow \text{3MgH$_{2}$} + \text{MgCu$_{2}$}
\end{equation}
| (2) |
with a calculated hydrogen capacity of 2.6 mass%. The hydride formation enthalpy is −72 kJ/mol-H
2.
23–31)
The literature reports on the use of High-Pressure Differential Scanning Calorimeter (HP-DSC) to characterize hydrogen reversible absorption and desorption in Mg-based alloys such as Mg2Ni32) and Mg2Cu26) are few.
In this work, Ni and Cu were selected as alloying element to Mg with the aim to synthesize crystalline Mg2Ni or Mg2Cu phases by mechanical alloying. The influence of the milling time and Mg:TM mass ratio on the particle size, phase abundance and crystal structure is investigated. Then, the hydrogenation properties were studied by HP-DSC. In addition, as concerns the Mg–Ni system, copper (Cu) and aluminum (Al) were added during milling in order to enhance hydrogenation properties. Many researchers have tried to enhance the kinetics of Mg2Ni alloy by adding a third element.33–35) However, systematically studies on the effect of Al and Cu are lacking. Therefore, this study aims to clarify the influence of these elements on Mg2Ni hydrogenation kinetics.
2. Experimental Procedure
Pure elemental powders of Mg (99.5%, <180 µm), Ni (>99.5%, <30 µm), Cu (>99.9%, <30 µm) and Al (99.5%, <180 µm) were purchased from Kojundo Chemical Laboratory, Co. LTD., Sakado, Japan. Samples were synthesized by MA under Ar atmosphere using a shaker ball milling device (RM-05R, Seiwa Co., Hiroshima, Japan). For each experiment, the total powder mass was ca. 3 g. Ball milling was conducted in stainless steel vials under 60 Hz vibrational frequency with 30 stainless steel balls (10 mm in diameter) and the BPR (Ball to powder ratio) was 32:1. Three sample series were synthesized: Mg2Ni, Mg2Cu and Mg2Ni alloyed with Cu or Al additives. For Mg2Ni series, Mg atomic content in the initial mixture was varied from 55 to 70 at% and the milling time from 2 to 48 h. No rest period was imposed. For Mg2Cu series, Mg atomic content was varied from 57 to 77 at% and the milling was carried out continuously between 2 and 16 h. For Mg2Ni series alloyed with a third element, in addition to an initial mixture 67 at% Mg and 33 at% Ni (i.e. ideal Mg2Ni composition), Cu or Al metal powders were added within the range 1 to 10 mass%. Milling time was in this case fixed to 8 h.
A Scanning Electron Microscope (SEM/EDX) was used to record images and elemental analysis of MA powders (Model: S-800 & S-4800 field emission SEM/EDX, Hitachi/EDAX, Tokyo, Japan). Mean particle sizes were determined from a random selection of 60 particles from each SEM image using the image analysis software ‘ImageJ’ (Free software, NIH, Bethesda, MD, USA). X-Ray powder Diffraction (XRD) analysis was used for phase identification and structural analysis of MA samples (Model: Multi Flex, Rigaku, Tokyo, JAPAN). XRD diffractometer was equipped with Cu-Kα radiation and was operated at 40 mA and 40 kV. Analysis of XRD patterns was carried out by the Rietveld Method using FullProf software.36) Hydrogenation properties were measured in a HP-DSC device (Model: DSC8230HP, Rigaku, Tokyo, JAPAN) under hydrogen pressure of 1 to 5 MPa. The samples were loaded in open aluminum pans. Temperature ranged from RT to 450°C with a heating/cooling rate of 10 K/min.
3. Results and Discussions
3.1 Mg2Ni series
3.1.1 Synthesis of Ca type-Mg2Ni phase
Figure 1 shows the SEM images of Mg–Ni powder mixtures with 66 at% Mg prepared by mechanical alloying at different milling time, tm. The particle size gradually decreases from 40 ± 15 to 6 ± 2 µm when tm ranges between 2 and 24 h, respectively. However, further milling to tm = 48 h increases the particle size to 14 ± 7 µm due to agglomeration.5)

Figure 2 shows the XRD patterns of Mg–Ni powder mixtures with 66 at% Mg at different milling time as well as that of commercial Mg2Ni powder (Kojundo Chemical Laboratory, Japan, >99%, <30 µm) for comparison. For tm ≤ 4 h, strong peaks from initial reactants (Mg and Ni) remain. For tm ≥ 8 h, XRD peaks broaden and new peaks corresponding to the Mg2Ni structure are observed. These results reveal the formation of nanostructured Mg2Ni phase, which is favorable to get fast hydrogenation kinetics. Longer mechanical alloying process leads to sample oxidation identified by the presence of MgO indeed by higher temperature during longer MA. Sample contamination by stainless steel milling tools during MA has been determined by EDX. Average Fe contents are 0.35, 0.95, 9.6 and 11.3 mass% Fe for 8, 16, 24 and 48 h of milling time, respectively. Moreover, 2.5 mass% Cr was detected after 48 h of milling. These results prove that extended milling time (here >16 h) lead to significant contamination from milling tools in agreement with previous reports.37)

Figure 3 shows the influence of composition between 55 and 70 at% Mg for fixed milling time tm = 8 h. The single Mg2Ni phase was obtained at the ideal stoichiometry 66 at% Mg and at 62 at% Mg. The Mg-richer composition 70 at% Mg leads to a two phase sample Mg2Ni + Ni-fcc. This implies that this sample probably also contains amorphous Mg not detected by XRD. Figure 4 shows the Rietveld graphical output for this sample. As far as crystalline phases are concerned, it contains 81 mass% of Mg2Ni and 19 mass% of Ni but some amorphous Mg may also be present. Details of lattice parameters are collected in Table 1 and 2, which also offers crystallographic data for all samples analyzed in this study. The mechanical alloying process probably promotes the formation of metastable harder Ni-fcc. The sharpness of diffraction peaks, i.e. the phase crystallinity, increases with Mg-content.

Table 1 Rietveld analysis results for Mg2Ni and Mg2Cu series.

Table 2 Rietveld analysis results for Mg2Ni series with Cu or Al addition.
Hydrogenation in HP-DSC apparatus was carried out on Mg2Ni (ideal 66 at% Mg–Ni) samples milled for tm = 8 and 48 h by cooling from 450°C to RT under a hydrogen pressure of 1 MPa. For comparison purposes, hydrogenation of Mg2Ni commercial powder was also attempted by HP-DSC. Commercial powder was used as-received and after mechanical grinding (MG) for 8 h. Figure 5 shows the XRD patterns after HP-DSC runs. Whereas low intensity Mg2NiH4 peaks (ICDD #37-1159) are detected for the commercial sample, even after 8 h of MG, the here synthesized MA samples exhibit high-intensity hydride Mg2NiH4 peaks. MA samples activate more easily than the commercial ones under 1 MPa of hydrogen during the first HP-DSC run at 150°C. Rietveld analysis of MA samples shows the formation of Mg2NiH4 and unreacted Mg2Ni, which is similar to results from other references.32,38) Additionally, the 48 h mechanically alloyed sample contained a significantly lower hydride quantity than the 8 h one (17 mass%) because of the presence of MgO.

Figure 6 shows the XRD patterns of 8 h-MA samples for different Mg contents after HPDSC hydrogenation. The Mg-richest sample forms hydride Mg2NiH4. From the Rietveld analysis, phase amounts and lattice parameters were determined (see Table 1). The first relevant point is that the refinement indicates the co-existence of two phases: the hydride Mg2NiH4 and Mg2Ni which cannot be distinguished from the saturated solid solution Mg2NiH0.3. The most significant result is that the abundance of hydride Mg2NiH4 increases with Mg-content. In addition, Ni-richer compounds contain Ni and MgNi2 phase, as expected from the initial composition (Fig. 3). These phases do not react with hydrogen at 3 MPa.
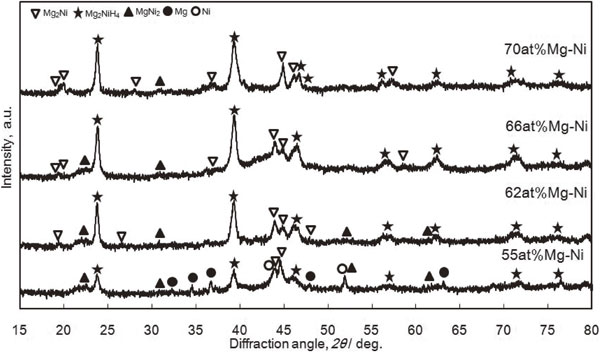
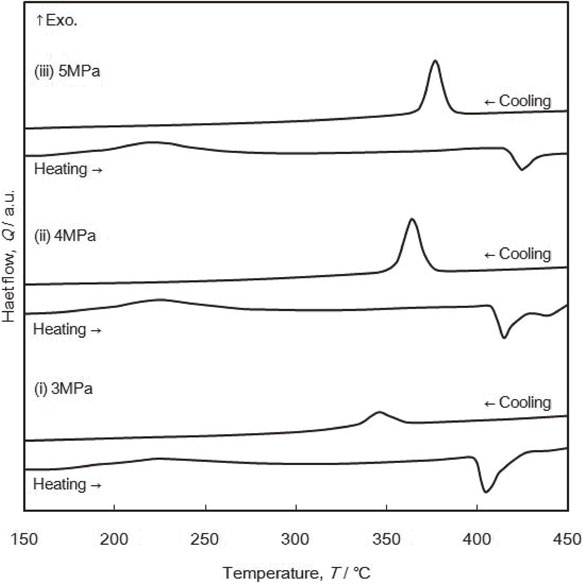
Figure 7 shows HP-DSC curves of two 8 h-MA Mg-richest samples (i.e. 70 at% Mg) from the same batch at different hydrogen pressures (1 and 3 MPa). During the first heating run, the two samples absorbed hydrogen (exothermic peak) on heating at ca. 150°C. Then, above 350°C, a large endothermic reaction associated to hydrogen desorption from Mg2NiH4 is observed. On cooling, hydrogen absorption occurs below 425°C. Peak position depends on hydrogen pressure: the higher the pressure, the higher the sorption temperatures as expected from the van’t Hoff relationship.39) With further cooling, a small exothermic peak is observed at 230°C related to the structural phase transition in Mg2NiH4 from high (cubic) to low (monoclinic) symmetry form.32,38,40–42) This transition is reversible on second heating/cooling run.

The difference in temperature between endo/exothermic sorption peaks relate to the hysteresis of hydrogen abs/desorption as well as to kinetics effects. The reversible hydrogen storage in this sample is evaluated to 2.80 mass% from integration of the high-temperature calorimetric peak and the reaction enthalpy of Mg2NiH4 formation reported in the literature.32,38,40–43) This value corresponds to 78% of the hydrogen storage capacity of Mg2NiH4.
Still concerning HP-DSC data, it is worth noting differences between hydrogen sorption peaks (400 < T < 450°C) at constant hydrogen pressure (3 MPa) during consecutive cycles of the same sample (curves ii and iii in Fig. 7). On heating, hydrogen desorption temperature decreases with cycling. Similarly, hydrogen absorption temperature decreases on cooling. Moreover, both calorimetric peaks are narrower in the second cycle compared to the first one suggesting increase of reaction kinetics on cycling.
3.2 Mg2Cu series
3.2.1 Synthesis of Cb type-Mg2Cu phase
Figure 8 shows the SEM images of Mg–Cu powder mixtures prepared by mechanical alloying at 2 ≤ tm ≤ 16 h. Within this range, the particle size decreases from 13 ± 4 down to 6 ± 2 µm. This is the same trend as for the Mg–Ni system, though no particle agglomeration is here observed.
Figure 9 shows the XRD patterns of 66 at% Mg–Cu powder mixtures at different milling times. Diffraction peaks in all diffraction patterns can be indexed with the crystal structures of unreacted elements (Mg and Cu) and the targeted Mg2Cu phase. Phase amount and lattice parameters of each sample were analyzed by the Rietveld method and results are displayed in Table 1. Mg2Cu content gradually increases with milling time from 55 mass% after 2 h to 83 mass% after 16 h. Additionally, the c lattice parameter obtained after mechanical alloying process is slightly higher compared with reference44) and increases with the milling time (Fig. 10).

Figure 11 shows the influence of composition between 57 to 77 at% Mg at tm = 8 h on XRD patterns. For the lowest Mg content, beside Mg2Cu phase peaks, broad diffraction bumps evidencing amorphous phase formation are detected. However, some peaks from initial powders are still identified. At Mg-rich compositions, sharp diffraction peaks related to Mg2Cu are identified. Phase abundance and lattice parameters were analyzed by the Rietveld method and results are gathered in Table 1. Mg2Cu phase could be synthesized in large quantities even if the Mg rich 77 at% Mg–Cu composition with the help of mechanical alloying. The larger phase amount obtained in this Mg rich sample may be explained by the presence of MgO in all the samples which reduces the amount of free Mg to form the intermetallic compound.
3.2.2 Hydrogenation properties of Mg2Cu phase
Figure 12 shows the HP-DSC curves of the 8 h-MA sample with 66 at% Mg content for hydrogen pressure $\text{P}_{\text{H}_{2}}$ comprised between 3 and 5 MPa. It is well known that Mg2Cu does not form a hydride compound but decomposes into MgH2 hydride and MgCu2.45) Thus, calorimetric peaks on DSC curves above 300°C are attributed to this disproportionation reaction on cooling (exothermic peak) and, to the reverse recomposition of Mg2Cu on heating (endothermic peak). Additionally a broad exothermic peak around 230°C is attributed to hydrogenation reaction of Mg2Cu phase. From these DSC measurements, the reversible hydrogen storage in this sample is 1.56 mass% of hydrogen, which corresponds to 60% of the theoretical value calculated from the phase amount. Increasing of $\text{P}_{\text{H}_{2}}$ leads to a shift of calorimetric peaks toward high temperatures, similar to Mg–Ni systems (Fig. 7) according to van’t Hoff relationship. The results are consistent with DSC record on binary Mg–H system27,45,46) and pressure-composition measurement on Mg–Cu–H system.26)
From the viewpoint of the hydrogenation kinetics, the synthesized Mg2Ni phase is known to have slow hydrogenation kinetics.6,47,48) This motivates the study of additional elements to improve the kinetics by promoting catalytic effects.
3.3.1 Powder characterization
Figure 13 shows the XRD measurement results for Cu or Al additional element to the Mg and Ni powder mixtures in the atomic ratio 2:1 prepared by 8 hours of MA. For the Cu series, phase crystallinity of Mg2Ni phase increases with Cu addition. Considering the Rietveld analysis results shown in Table 2, at the highest Cu content (10 mass% Cu), the sample is no longer single phase and shows about 77 mass% of Mg2Ni phase with the existence of additional phases. For the Al series, Mg2Ni amount decreases with Al addition due to the progressive formation of Ni(Mg,Al) phase (CsCl-type) with disordered mixing of Al and Mg atoms on one crystallographic site.49) From the Rietveld analysis (Table 2), the maximum quantity of Mg2Ni phase (53 mass%) occurs for 2 mass% Al. At 10 mass% Al, Ni(Mg,Al) is the main phase (32 mass%). To summarize, the highest amount of Mg2Ni phase with either Cu or Al additives is found at 10 mass% Cu or 2 mass% Al.
3.3.2 Hydrogenation properties
Figure 14 shows HP-DSC runs under 1 MPa of hydrogen pressure for Cu and Al series. At the first heating run, only the sample without additives presents a large endothermic peak at about 400°C (Fig. 7). During cooling down, one exothermic peak appears in all samples, but for 10 mass% Al, associated with the formation of Mg2NiH4 hydride. The temperature position of this peak decreases with additive amount, especially in the Cu case. This indicates hydride destabilization by the additive likely due to alloying of Cu and Al elements with Mg2Ni which is interesting for applications. The Al-richest sample does not show any significant calorimetric peak. It is explained by the absence of Mg2Ni in this sample and it suggests that the Ni(Mg,Al) phase does not absorb hydrogen at the HP-DSC operation conditions.

Figure 15 shows the XRD measurement results after HP-DSC hydrogenation at 1 MPa for Cu or Al series. Considering the Rietveld analysis results as shown in Table 2, with the increase of Cu (up to 5 mass%) or Al (up to 2 mass%), the amount of Mg2NiH4 increases. A new phase, Mg3Ni2Al, is observed for Al-rich samples after hydrogenation. It crystallizes in the cubic Fd-3m space group with each element Mg, Ni and Al distributed respectively on nonequivalent sites.49) The Mg3Ni2Al amount is 64 and 97 mass% for 5 and 10 mass% Al samples, respectively. From the XRD analysis, we can conclude that the optimal composition to enhance Mg2Ni formation is 5 mass% of Cu or 2 mass% Al.
4. Conclusion
By mechanical alloying of element powders under Ar atmosphere, we aimed to synthesize Mg-based intermetallic compounds such as Mg2Ni and Mg2Cu which are well known phases for hydrogen storage. The results in this study are summarized as follows:
For the Mg–Ni series:
-
1.
The Mg2Ni phase is obtained with a milling of 8 hours.
-
2.
Mechanically alloyed Mg2Ni reacts with hydrogen by HP-DSC without any activation treatment, in contrast with commercial Mg2Ni.
-
3.
Mg in excess (70 at% Mg) with respect to Mg2Ni ideal composition provides higher content of Mg2Ni phase and better crystallinity.
-
4.
In HP-DSC studies, the 70 at% Mg sample exhibits the highest reversible capacity (2.8 mass% of hydrogen) with good cycling properties.
For the Mg–Cu series:
-
1.
Mg2Cu phase is obtained on milling for 4 hours.
-
2.
The largest yield was obtained for Mg-rich 77 at% sample.
For Cu and Al addition series to Mg–Ni:
-
1.
The hydrogenation absorption temperature of Mg2Ni phase decreases with Cu or Al addition, suggesting incorporation of the latter elements in the Mg2Ni crystal structure.
-
2.
The amount of hydrogen absorbed decreases with Al addition due to the formation of non absorbing Mg–Ni–Al phases.
REFERENCES
- 1) C.-J. Winter: Int. J. Hydrogen Energy 34 (2009) S1–S52.
- 2) J.-C. Crivello, R.V. Denys, M. Dornheim, M. Felderhoff, D.M. Grant, J. Huot, T.R. Jensen, P. de Jongh, M. Latroche, G.S. Walker, C.J. Webb and V.A. Yartys: Appl. Phys. A 122 (2016) 85.
- 3) F. Zhang, P. Zhao, M. Niu and J. Maddy: Int. J. Hydrogen Energy 41 (2016) 14535–14552.
- 4) J.-C. Crivello, B. Dam, R.V. Denys, M. Dornheim, D.M. Grant, J. Huot, T.R. Jensen, P. de Jongh, M. Latroche, C. Milanese, D. Milčius, G.S. Walker, C.J. Webb, C. Zlotea and V.A. Yartys: Appl. Phys. A 122 (2016) 97.
- 5) J. Huot, D.B. Ravnsbæk, J. Zhang, F. Cuevas, M. Latroche and T.R. Jensen: Prog. Mater. Sci. 58 (2013) 30–75.
- 6) I.P. Jain, C. Lal and A. Jain: Int. J. Hydrogen Energy 35 (2010) 5133–5144.
- 7) J. Zhang, F. Cuevas, W. Zaïdi, J.-P. Bonnet, L. Aymard, J.-L. Bobet and M. Latroche: J. Phys. Chem. C 115 (2011) 4971–4979.
- 8) J.J. Reilly and R.H. Wiswall, Jr.: Inorg. Chem. 7 (1968) 2254–2256.
- 9) A. Ebrahimi-Purkani and S.F. Kashani-Bozorg: J. Alloys Compd. 456 (2008) 211–215.
- 10) N.A.A. Rusman and M. Dahari: Int. J. Hydrogen Energy 41 (2016) 12108–12126.
- 11) Z. Dehouche, R. Djaozandry, J. Goyette and T.K. Bose: J. Alloys Compd. 288 (1999) 269–276.
- 12) T. Kuji, H. Nakano and T. Aizawa: J. Alloys Compd. 330–332 (2002) 590–596.
- 13) W.R. Myers, L.-W. Wang, T.J. Richardson and M.D. Rubin: J. Appl. Phys. 91 (2002) 4879–4885.
- 14) S.N. Kwon, S.H. Baek, D.R. Mumm, S.-H. Hong and M.Y. Song: Int. J. Hydrogen Energy 33 (2008) 4586–4592.
- 15) L.W. Huang, O. Elkedim and V. Moutarlier: J. Alloys Compd. 504 Suppl. 1 (2010) S311–S314.
- 16) H.-W. Wang, S.-D. Chyou, S.-H. Wang, P.-K. Chiu, C.-C. Yen, B.-Y. Chen, M.-W. Yang, H.-C. Tien and N.-N. Huang: J. Alloys Compd. 491 (2010) 623–626.
- 17) H. Kou, X. Hou, T. Zhang, R. Hu, J. Li and X. Xue: Mater. Charact. 80 (2013) 21–27.
- 18) Z. Zhang, O. Elkedim, M. Balecerzak and M. Jurczyk: Int. J. Hydrogen Energy 41 (2016) 11761–11766.
- 19) M. Abdellaoui, D. Cracco and A. Percheron-Guegan: J. Alloys Compd. 268 (1998) 233–240.
- 20) L. Zaluski, A. Zaluska and J.O. Stöm-Olsen: J. Alloys Compd. 217 (1995) 245–249.
- 21) J. Huot, E. Akiba and T. Takada: J. Alloys Compd. 231 (1995) 815–819.
- 22) J.J. Reilly and R.H. Wiswall: Inorg. Chem. 6 (1967) 2220–2223.
- 23) X. Tan, M. Danaie, W.P. Kalisvaart and D. Mitlin: Int. J. Hydrogen Energy 36 (2011) 2154–2164.
- 24) A. Biris, D. Lupu, R.V. Bucur, E. Indrea, G. Borodi and M. Bogdan: Int. J. Hydrogen Energy 7 (1982) 89–94.
- 25) P. Selvam, B. Viswanathan, C.S. Swamy and V. Srinjvasan: Int. J. Hydrogen Energy 13 (1988) 87–94.
- 26) H. Shao, Y. Wang, H. Xu and X. Li: J. Solid State Chem. 178 (2005) 2211–2217.
- 27) M. Jurczyk, I. Okonska, W. Iwasieczko, E. Jankowska and H. Drulis: J. Alloys Compd. 429 (2007) 316–320.
- 28) H. Wang, X. Hu and D.O. Northwood: Mater. Lett. 62 (2008) 3331–3333.
- 29) J.P. Lei, H. Huang, X.L. Dong, J.P. Sun, B. Lu, M.K. Lei, Q. Wang, C. Dong and G.Z. Cao: Int. J. Hydrogen Energy 34 (2009) 8127–8134.
- 30) S. Kalinichenka, L. Röntzsch, T. Riedl, T. Gemming, T. Weißgärber and B. Kieback: Int. J. Hydrogen Energy 36 (2011) 1592–1600.
- 31) C. Kursun and M. Gogebakan: J. Alloys Compd. 619 (2015) 138–144.
- 32) R. Martínez-Coronado, M. Retuerto, B. Torres, M.J. Martínez-Lope, M.T. Fernández-Díaz and J.A. Alonso: Int. J. Hydrogen Energy 38 (2013) 5738–5745.
- 33) S. Orimo and H. Fujii: Appl. Phys. A 72 (2001) 167–186.
- 34) E. Grigorova, M. Khristov, M. Khrussanova, J.-L. Bobet and P. Peshev: Int. J. Hydrogen Energy 30 (2005) 1099–1105.
- 35) G. Liang, S. Boily, J. Huot, A. Van Neste and R. Schulz: J. Alloys Compd. 267 (1998) 302–306.
- 36) J. Rodríguez-Carvajal: Physica B 192 (1993) 55–69.
- 37) C. Suryanarayana, E. Ivanov and V.V. Boldyrev: Mater. Sci. Eng. A 304–306 (2001) 151–158.
- 38) Á. Révész, M. Gajdics, E. Schafler, M. Calizzi and L. Pasquine: J. Alloys Compd. 702 (2017) 84–91.
- 39) M.V. Lototskyy, V.A. Yartys, B.G. Pollet and R.C. Bowman, Jr.: Int. J. Hydrogen Energy 39 (2014) 5818–5851.
- 40) M. Gajdics, M. Calizzi, L. Pasquini, E. Schafler and Á. Révész: Int. J. Hydrogen Energy 41 (2016) 9803–9809.
- 41) Á. Révész, M. Gajdics and T. Spassov: Int. J. Hydrogen Energy 38 (2013) 8342–8349.
- 42) J. Genossar and P.S. Rudman: J. Phys. Chem. Solids 42 (1981) 611–616.
- 43) R. Vijay, R. Sundaresan, M.P. Maiya and S. Srinivasa Murthy: Int. J. Hydrogen Energy 30 (2005) 501–508.
- 44) D. Sun, H. Enoki, F. Gingl and E. Akiba: J. Alloys Compd. 285 (1999) 279–283.
- 45) G. Urretavizcaya, V. Fuster and F.J. Castro: Int. J. Hydrogen Energy 36 (2011) 5411–5417.
- 46) C. Rongeat, I. Llamas-Jansa, S. Doppiu, S. Deledda, A. Borgschulte, L. Schultz and O. Gutfleisch: J. Phys. Chem. B 111 (2007) 13301–13306.
- 47) H.-K. Hsu, C.-W. Hsu, J.-K. Chang, C.-K. Lin, S.-L. Lee and C.-E. Jiang: Int. J. Hydrogen Energy 35 (2010) 13247–13254.
- 48) B. Sakintuna, F. Lamari-Darkrim and M. Hirscher: Int. J. Hydrogen Energy 32 (2007) 1121–1140.
- 49) C. He, Y. Du, H.-L. Chen and H. Ouyang: Int. J. Mater. Res. 99 (2008) 907–911.


